
Don't be fooled by the rebound! Bitcoin may retest the lows at any time | Invited Analysis
- 核心观点:分析师基于量化模型预判BTC将区间震荡。
- 关键要素:
- 上周精准执行策略,两笔短线交易盈利6.93%。
- 技术模型显示周线即将进入空头市场。
- 本周焦点是美联储决议及降息路径指引。
- 市场影响:宏观政策将直接影响BTC短期方向与波动。
- 时效性标注:短期影响
Conaldo, a featured market analyst at Odaily, holds a Master's degree in Financial Statistics from Columbia University. During his university years, he focused on quantitative trading in US stocks and gradually expanded to digital assets such as Bitcoin. Through practical experience, he has built a systematic quantitative trading model and risk control system. He possesses keen data insight into market fluctuations and is committed to continuous professional development in the trading field, pursuing stable returns. He will provide weekly in-depth analysis of BTC technical, macroeconomic, and funding changes, reviewing and showcasing practical strategies, and previewing recent noteworthy events for reference.
Weekly Trading Report Highlights: Last week's trading strictly adhered to the established strategy, successfully completing two short-term trades and achieving a cumulative return of 6.93%. The following section will provide a detailed review of market predictions, strategy execution, and the specific trading process.
I. Bitcoin Market Review Last Week (December 1st - December 7th)
1. Review of last week's core viewpoints and trading strategies:
In last week's issue, I clearly stated that $89,000 should be used as the dividing line between bullish and bearish sentiment, and formulated corresponding trading strategies based on this. The details are as follows:
① Market Trend Forecast Review: We consider $89,000 as a key short-term watershed. If it provides effective support, the price is expected to rebound upwards; if it breaks through this level, it will begin a downward trend.
Key resistance level:
- First resistance zone: $94,000–$96,500
- Second resistance zone: $98,500–$100,000
Key support level:
- First support level: around $89,000
- Second support level: $85,500–$88,000 area
- Key support level: around $80,500
② Review of operational strategies:
- Medium-term strategy: Maintain a medium-term short position of around 65%.
- Short-term strategy: All short-term operations will be based on a decision made at or above $89,000, and two contingency plans will be developed:
- Option A: If the $89,000 support level holds, and the price rebounds to the $94,000-$96,500 range where it encounters resistance, establish an initial short position of 10% , with a stop-loss set above $100,000. If the rebound continues to around $98,500 and encounters resistance again, add another 20% to the short position, with a unified stop-loss above $100,000.
- Option B: If the price of the coin effectively falls below $89,000, then directly establish a 20% short position, with a stop loss set around $92,000.
- Unified closing rules: When the price moves to the vicinity of the aforementioned important support level and a bottom resistance signal appears, short-term positions may be partially or fully closed for profit as appropriate.
2. Last week, two short-term trades were successfully completed as planned (Figure 1), achieving a cumulative return of 6.93%. Detailed trade records and a recap are as follows:
Bitcoin 30-minute candlestick chart: (Momentum-based model + Spread trading model)
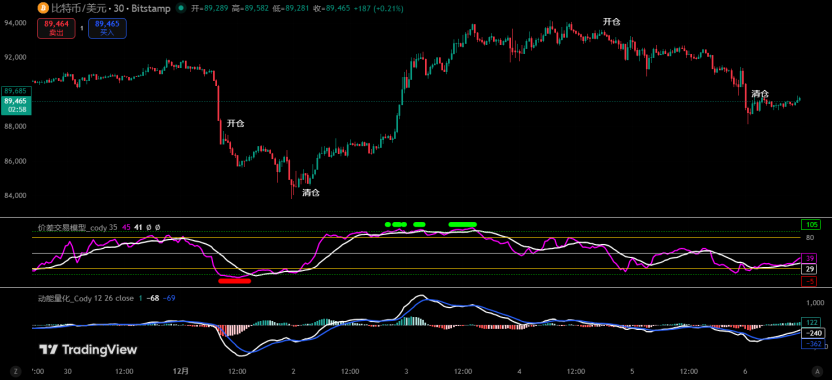
Figure 1
① Summary of transaction details: 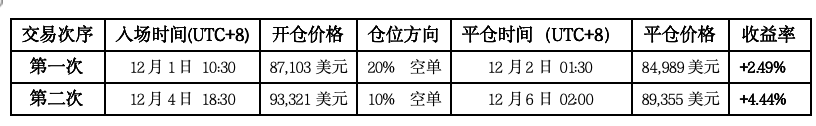
② First Trade (Profit 2.14%): This operation was a classic execution of Plan B. After the price of Bitcoin decisively broke below the key level of $89,000, a 20% short position was established at $87,103 , and ultimately closed out for profit near the second support zone of $84,989. This operation perfectly exemplified the trading discipline of "following the breakout."
③ Second trade (4.44% profit): This operation was a precise implementation of Plan A. After the price found support at $89,000 and rebounded, we patiently waited for it to enter the first resistance zone ($94,000-$96,500). When a signal appeared at $93,321, we established a 10% short position as planned, successfully capturing the subsequent pullback and taking profits near $89,355.
④ Summary of Profits: Last week's strategy execution was highly aligned with market conditions. Both trades strictly followed the pre-set entry, stop-loss, and closing rules, successfully converting market volatility into actual profits, with a total profit of 6.93%, validating the effectiveness of the previous strategy framework.
3. Review of Bitcoin Core Data Last Week:
- Opening price : $90,369
- Lowest price : $83,814 (Monday)
- Highest price : $94,172 (Wednesday)
- Closing price : $90,405
- Weekly change : 0.03% increase, maximum fluctuation: 12.36%
- Transaction volume : US$13.429 billion
- Trend : Wide-range fluctuations, with the weekly chart closing as a "doji" candlestick with upper and lower shadows.
4. Review of last week's market performance:
Last week, Bitcoin exhibited a typical pattern of "violent wide-range fluctuations," with its price action marked by numerous ups and downs. The week ultimately closed with a 0.03% gain, forming a "doji" candlestick with upper and lower shadows. Specifically, after opening on Monday, the price quickly plunged, effectively breaking through the key support level of $89,000, reaching a low of $83,814 before stabilizing and rebounding, closing down 4.53% on the day. The following two days saw a "V"-shaped reversal, with the price continuing to rise, not only recovering all of Monday's losses but also briefly reaching a weekly high of $94,172, a cumulative gain of 8.18% over two trading days. After midweek, the market weakened again, with the price entering a narrow range of fluctuation after experiencing a cumulative decline of 4.45% over two consecutive days, until the weekend. It is worth noting that the midweek high of $94,172 closely matches the lower limit of the first resistance zone of $94,000-$96,500 predicted by the author last week, differing by only $172. This once again confirms the accuracy of the previous judgment on key resistance levels.
II. Systematic Technical Analysis: Comprehensive Judgment Based on Multiple Models and Dimensions
Based on last week's market performance, this article will utilize a multi-dimensional analysis model to conduct an in-depth analysis of the evolution of Bitcoin's internal structure.
Weekly chart:
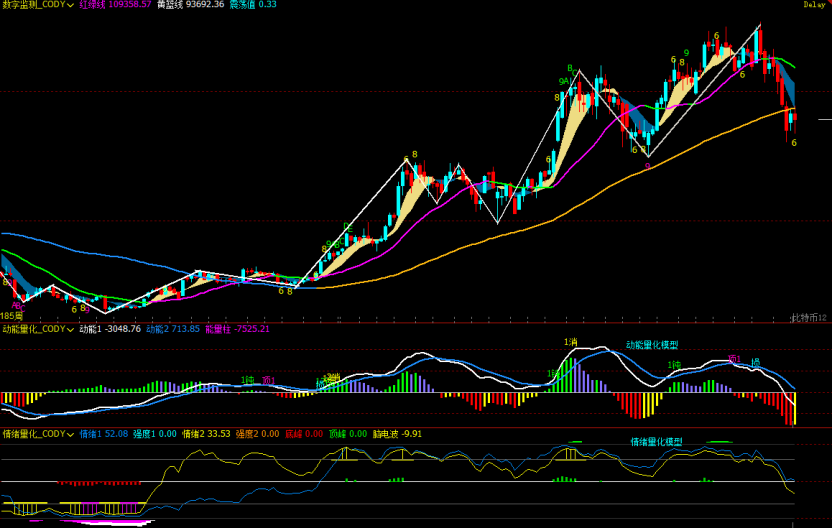
Figure 2
1. As shown in Figure 2, analysis from the weekly chart:
- Momentum Model: Following last week's price action, both momentum lines continued their downward trend. The white momentum line has been below the zero line for three weeks, while the blue momentum line is about to cross it. After two consecutive weeks of oversold rebounds, the negative momentum bars are shortening compared to previous weeks. The bulls must now mount a strong counterattack to pull both momentum lines back above the zero line; otherwise, the bears will unleash even greater selling pressure.
The kinetic energy model predicts: Price decline index: High
- Emotion quantification model: The blue emotion line has a value of 52.08, with an intensity of zero; the yellow emotion line has a value of 33.53, with an intensity of zero and a peak value of 0.
The sentiment quantification model predicts: Price pressure and support index: Neutral.
- Digital monitoring model: No digital signal is currently displayed.
The above data suggests that Bitcoin is in a downtrend and is about to enter a bear market on the weekly chart.
Daily chart:
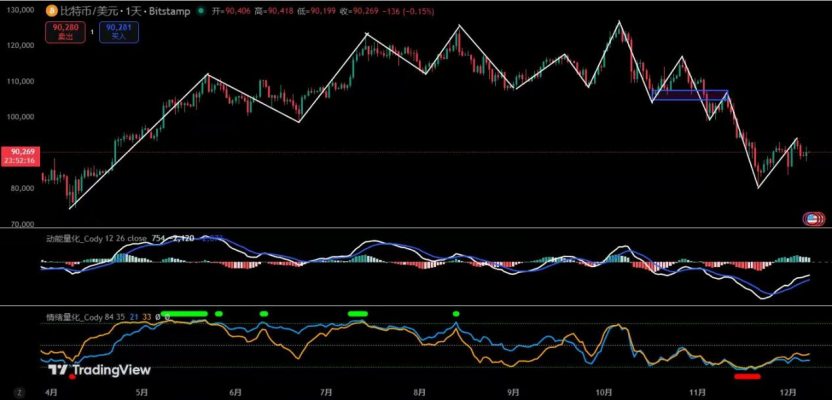
Figure 3
2. As shown in Figure 3, analysis from the daily chart:
- Momentum-based model: After a week of rebound, the two momentum lines continue to move upward below the zero axis and gradually approach the zero axis, but the energy bars are gradually shortening compared to the previous few days.
The kinetic energy model predicts that the upward momentum is gradually weakening.
- Emotion quantification model: Blue emotion line value 21, intensity zero; Yellow emotion line value 32, intensity zero.
The sentiment quantification model predicts: Stress and support index: Neutral
The above data suggests that the market is in a downtrend on a daily chart, with an oversold rebound underway, but the rebound is showing signs of weakening.
III. Market Forecast for This Week ( December 8th - December 14th)
1. It is expected that the price of cryptocurrency will likely remain range-bound this week. I have divided the market into three zones: $94,200-$91,000, $87,500-$83,500 . Currently, it is fluctuating narrowly within the $91,000-$87,000 range, and the market will choose a direction next.
2. Resistance levels: The first resistance level is $91,000, the second resistance level is the $94,000-$96,500 range, and the key resistance level is the $98,500-$100,000 range.
3. Support levels: The first support level is in the $85,500-$87,500 area, the second support level is at $83,500, and the important support level is around $80,000.
IV. This Week's Trading Strategy (excluding the impact of unexpected news)
1. Medium-term strategy: Maintain a medium-term position of around 65% (short positions).
2. Short-term strategy: Use 30% of your position, set a stop-loss point, and look for opportunities to profit from price differences based on support and resistance levels. (Use 60-minute/240-minute charts as the trading timeframe).
3. Based on the high probability of range-bound trading this week, the author has developed the following two short-term trading strategies to cope with market trends.
Option A: If the price fluctuates upwards at the beginning of the week: (Sell on rallies)
- Opening a position: If the price rebounds to the $91,000-$94,200 range and encounters resistance, establish a 15% short position.
- Add to short position: If the price continues to rebound to around $98,500 and encounters resistance again, add another 15% to the short position.
- Risk control: Stop loss for all short positions is set above $100,000.
- Reduce position: When the price rebound ends and moves downward, and resistance appears near the first support level, 50% of the position can be closed.
- Closing positions: If the price continues to fall to the second support level and encounters resistance, close out the remaining positions and complete the transaction.
Option B: If the price breaks below the $87,500 support level early in the week, it will test lower levels (a deep drop could lead to a rebound).
- Opening a position: If the price of the coin falls to the $83,500-$80,000 range and a top signal appears, establish a 15% long position.
- Risk control: Stop loss set below $80,000.
- Close positions: When the price rebounds to the $87,500-$88,000 range and encounters resistance, close all positions and realize profits.
V. Special Note:
1. When opening a position: immediately set the initial stop loss level.
2. When the profit reaches 1%, move the stop loss to the opening cost price (break-even point) to ensure the safety of the principal.
3. When the profit reaches 2%, move the stop loss to the position where the profit is 1%.
4. Continuous monitoring: For every additional 1% profit in the coin price thereafter, the stop loss level will be moved by 1% to dynamically protect and lock in existing profits.
(Note: The above 1% profit trigger threshold can be adjusted flexibly by investors based on their own risk appetite and the volatility of the underlying asset.)
VI. Macroeconomic and Funding Analysis (December 8-14):
This week is the most crucial "super central bank week" for global financial markets before the end of the year, with the core focus on the December Federal Reserve interest rate decision, the updated dot plot, and Powell's speech. Although the market almost unanimously expects a rate cut at this meeting, what truly determines risk assets (including Bitcoin) is not the rate cut itself, but rather the Fed's guidance on the path of rate cuts in 2025. Therefore, this week's macroeconomic and funding structures will revolve around "expectation gaps," and asset price volatility is expected to amplify significantly.
From a macro perspective, this week is packed with key data releases: Tuesday's US JOLTs job openings will reveal the extent of the cooling in the job market; if this weakens further, it will reinforce the logic of an earlier interest rate cut. Wednesday's Chinese CPI and social financing will determine the direction of Asian demand and liquidity. Friday's UK GDP and European CPI will influence expectations of synchronized global easing. However, the importance of these data is significantly less than that of the Fed's interest rate meeting, and the market as a whole is in a state of "waiting for the Fed to give an answer."
The tone of this Fed meeting has almost certainly locked in a December rate cut, but the dot plot will determine the market's direction over the next 3-6 months. If the dot plot leans hawkish, suggesting only 0-1 rate cuts in 2025, the market will quickly revise its current easing expectations, leading to higher US Treasury yields, a stronger dollar, and short-term pressure on risk assets. BTC might even retest the $85,000 area. If the dot plot leans dovish, suggesting at least 2 rate cuts in 2025, it indicates that the easing cycle may accelerate earlier than expected, leading to a rapid rebound in risk assets, and BTC is expected to retest above $90,000. Powell's speech will also further influence sentiment; any wording emphasizing "sticky inflation" or "the need for continued restrictive policy" will amplify short-term volatility.
From a funding perspective, the market is currently in a state of consolidation with no clear direction. While BTC failed to effectively reclaim the $90,000 mark over the weekend, trading volume decreased significantly, indicating a slowdown in share turnover and stable retail investor sentiment without panic selling. Institutional funds generally chose to reduce risk exposure before the "super central bank week," thus there were no significant increases or decreases in positions last week, representing a typical "pre-interest rate decision lull." The macroeconomic environment itself lacked new negative factors; US employment and inflation data continued to weaken, actually increasing the probability of a medium-term easing cycle. This is a key reason why BTC has been able to maintain strong fluctuations at high levels.
Overall, the core variable for BTC this week is not sentiment or liquidity, but whether the Federal Reserve will provide guidance on a rate-cutting path consistent with market expectations. Positive factors include: a very high probability of a December rate cut, continued cooling of employment and inflation, and a high likelihood of a dovish stance from the new Fed chair, all of which support further easing in 2025. Risks mainly lie in a hawkish dot plot, tighter rhetoric from Powell, and a weakening of short-term sentiment due to a decline in expectations of a January rate cut.
In summary, this week is a crucial window for determining the direction of risk assets in 2025. The Federal Reserve's dot plot and stance will directly impact the medium-term trend of BTC. A dovish guidance could lead to a year-end rebound; a hawkish guidance might result in a short-term pullback, but would not alter the medium-term bullish structure. For BTC, this week's volatility is not merely a short-term price change, but a repricing of future trends.
Financial markets are constantly changing, and all market analysis and trading strategies need to be dynamically adjusted. All views, analytical models, and operational strategies presented in this article are derived from personal technical analysis and are for personal trading journal use only. They do not constitute any investment advice or basis for action. The market is risky; invest with caution. DYOR.


