BTC continues its downward trend; internal structure changes | Invited Analysis
- 核心观点:比特币周线空头信号,反弹属技术性修复。
- 关键要素:
- 周线动能模型显示空头能量持续释放。
- 日线反弹由情绪指标触底信号触发。
- 资金面呈现机构接盘散户的换手结构。
- 市场影响:短期走势关注关键支撑与宏观数据。
- 时效性标注:短期影响。
Conaldo, a featured market analyst at Odaily, holds a Master's degree in Financial Statistics from Columbia University. During his university years, he focused on quantitative trading in US stocks and gradually expanded to digital assets such as Bitcoin. Through practical experience, he has built a systematic quantitative trading model and risk control system. He possesses keen data insight into market fluctuations and is committed to continuous professional development in the trading field, pursuing stable returns. He will provide weekly in-depth analysis of BTC technical, macroeconomic, and funding changes, reviewing and showcasing practical strategies, and previewing recent noteworthy events for reference.
I. Bitcoin Market Review Last Week (November 24 - November 30)
1. Review of key data from last week
- Opening price : $86,808
- Lowest price : $85,225 (Monday)
- Highest price : $93,091 (Friday)
- Closing price : $90,382
- Weekly change : 4.12% increase, maximum fluctuation: 9.23%
- Transaction volume : US$10.591 billion
- Trend : Oversold rebound, weekly candlestick closed with a medium-sized positive line.
2. Review of last week's market performance
Last week, Bitcoin exhibited an overall "oversold rebound" trend. The chart shows that the price rebounded continuously for the first four days, experiencing a brief period of fluctuation upon reaching the first resistance level of $89,000, before continuing its upward movement. In the latter half of the week, influenced by holiday factors, market trading became less active, and the price entered a narrow range of fluctuation. The week ultimately closed with a 4.76% gain, ending with a medium-sized bullish candlestick.
3. Review of last week's operations
- Medium-term strategy : 65% of the position is short .
- Short-term strategy: Last week, we executed trades according to our established short-term strategy.
II. Systematic Technical Analysis: Comprehensive Judgment Based on Multiple Models and Dimensions
Based on last week's market performance, this article will utilize a multi-dimensional analysis model to conduct an in-depth analysis of the evolution of Bitcoin's internal structure.
Bitcoin Weekly Chart: (Momentum-based quantification model + sentiment-based quantification model)
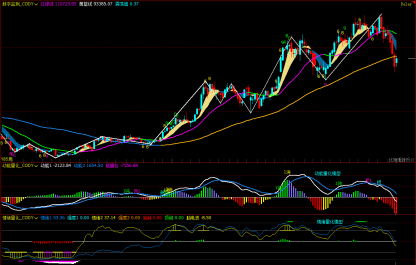
Figure 1
1. As shown in Figure 1, analysis from the weekly chart
- Momentum-based model: After last week's adjustment, the two momentum lines continue to move downwards, with the white momentum line having crossed below the zero axis. The energy (negative) bars continue to expand, indicating that short-selling energy is gradually being released.
Model predicts a price drop index: High
- Emotion quantification model: The intensity of both emotion indicators is 0, and the peak value is 0.
Model predicts price pressure index: Neutral
- Digital monitoring model: No digital signal is currently displayed.
The above data indicates that Bitcoin is in a downtrend, and a bearish market signal has appeared on the weekly chart.
Bitcoin daily candlestick chart:
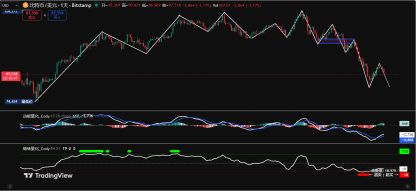
Figure 2
Bitcoin 4-hour candlestick chart:
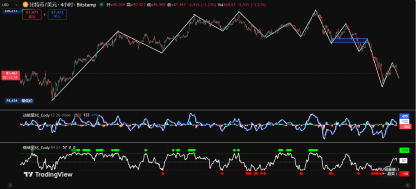
Figure 3
2. As shown in Figure 2, analysis from the daily chart
- Momentum-based model: After the market closed last Thursday, the two momentum lines formed a "golden cross" below the zero axis and began to move upward, gradually approaching the zero axis, and the energy bars changed from negative to positive.
The model predicts: during the release of bullish momentum
- Sentiment Quantification Model: The daily sentiment indicator first dipped to the bottom area some time ago, and issued a bottom (red) signal, which then triggered the technical oversold rebound last week.
The model predicts that the rebound is an oversold bounce.
The above data suggests that the market is in a downtrend on a daily chart, and the current rise is a technical rebound after an oversold condition.
III. Market Forecast for This Week ( December 1st - December 7th)
1. Bitcoin is expected to retrace to around $89,000 this week to test its support level .
- If this support level holds, the price will have upward momentum and could challenge last week's high.
- If this level is broken, the price will begin a downward trend to seek support.
2. Resistance levels: The first resistance level is the $94,000-$96,500 area, and the second resistance level is the $98,500-$100,000 area.
3. Support levels: The first support level is around $89,000, the second support level is in the $85,500-$88,000 range, and the key support level is around $80,500.
IV. This Week's Trading Strategy ( December 1st - December 7th): Excluding the impact of unexpected news.
1. Medium-term strategy: Maintain a medium-term position of around 65% (short positions).
2. Short-term strategy: Use 30% of your position, set a stop-loss point, and look for opportunities to short at higher levels based on resistance signals. (Use 60-minute/240-minute charts as the trading timeframe).
3. The core basis for short-term trading is the effectiveness of the support level around $89,000.
- First short-term trading strategy: If the support at this level holds, the price will continue to rebound.
- Initial entry: If the price rebounds to the $94,000-$96,500 range and shows signs of resistance, a 10% short position can be established, with a stop-loss set above $100,000.
- Second addition to the position: If the price continues to rebound to around $98,500 and encounters resistance again, add another 20% to the short position, with a stop loss set above $100,000.
- First reduction in position: When the price rebound ends and starts to decline, and the short-term position shows signs of resistance near the first support level, half of the position can be closed.
- Close all positions: If the price continues to fall to the second support level and a resistance signal appears, close all remaining short-term positions and take profits.
- The second short-term trading strategy: If the price retraces to this level and breaks below it, the price will begin a downward trend.
- Initial entry: If the price breaks below the $89,000 support level, a 20% short position can be established, with a stop-loss order placed near $92,000.
- Closing point: When the price of the coin is falling to the bottom, especially when a bottom resistance signal appears in the $80,500-$82,000 range, close all positions in the short term and realize profits.
V. Special Notes
1. When opening a position: immediately set the initial stop-loss level.
2. When the profit reaches 1%, move the stop loss to the opening cost price (break-even point) to ensure the safety of the principal.
3. When the profit reaches 2%, move the stop loss to the position where the profit is 1%.
4. Continuous monitoring: For every additional 1% profit in the coin price thereafter, the stop loss level will be moved by 1% to dynamically protect and lock in existing profits.
(Note: The above 1% profit trigger threshold can be adjusted flexibly by investors based on their own risk appetite and the volatility of the underlying asset.)
VI. Macroeconomic and Funding Analysis
Last week, the US financial market was in a low-liquidity environment due to the Thanksgiving and Black Friday holidays. Trading activity decreased during the holidays, market sentiment remained stable, and neither risk aversion nor risk appetite showed significant fluctuations; therefore, the short-term trend of BTC was not substantially affected. However, from the perspective of capital structure and institutional behavior, noteworthy changes are emerging within the market, which are of reference value for judging the medium- to short-term structure of BTC.
1. Analysis of Macroeconomic Funding Structure Last Week (November 24-30)
Risk appetite exhibits phased shifts
① The inflow of funds from retail investors is weakening.
- According to the latest BofA data, retail investors continued their buying trend in the third week of November, but the net inflow narrowed significantly, while the proportion of outflows increased, showing an overall "buying while reducing positions" pattern. Retail investors have been a major driving force behind risky assets over the past two years, and this weakening may be related to year-end funding needs and the holiday season.
- Impact on BTC:
Decreased retail investor participation reduces short-term trading activity, which helps to narrow volatility and reduces emotional selling. This has a positive impact on the stability of Bitcoin within its trading range.
② Hedge funds increase their holdings in the opposite direction
- Hedge funds that had previously maintained short positions saw a clear directional reversal in the third week of November, with net buying approaching $2 billion. Meanwhile, CTAs, after their earlier sell-off, also began to gradually build new long positions, achieving positive inflows for four consecutive weeks.
- Impact on BTC:
Hedge fund and CTA buying activity typically reflects an improved outlook for the market environment over the next 1-3 months. Institutional buying during price declines suggests that medium-term risk assets (including tech stocks and Bitcoin) offer some valuation appeal.
③ Institutional investors return
- After four consecutive weeks of net outflows, traditional institutional funds resumed net buying in the third week of November. This recovery in institutional risk appetite is crucial for the stability of long-term trending assets.
- Impact on BTC:
The correlation between BTC and tech stocks remains high. The stabilization of the tech sector, coupled with institutional inflows, has eased the marginal macroeconomic pressure on BTC, helping to support a potential rebound.
2. Summary
Overall, retail investors flowed out while institutions and hedge funds took over, a typical "strong hands replacing weak hands" structure within a volatile trading range. This is also the main reason why BTC was able to maintain stable operation during the low-liquidity holiday period.
VII. Macroeconomic Outlook for This Week ( December 1st - December 7th) : Key Focus Areas: Inflation Path and Official Speeches
Although this week is not a period of major data releases, several macroeconomic events may still affect the short-term trend of the market and are key variables for observing the fluctuation range of BTC.
1. Federal Reserve Chairman Jerome Powell's speech on Tuesday will be the most influential event for the market. With market expectations for a December rate cut now exceeding 80%, Powell's remarks will directly impact market sentiment and asset price movements.
- If it releases a dovish signal, it will help boost market risk appetite, thereby providing further impetus for a Bitcoin rebound.
- If it emphasizes that inflation is sticky or maintains a hawkish stance, it may lead to a decline in expectations of interest rate cuts, and risk assets may face resistance near key resistance levels.
2. The performance of employment data (ADP and initial jobless claims) will directly influence market sentiment by affecting expectations of interest rate cuts.
- If the slowdown continues, it will strengthen the downward trend in inflation, support expectations of interest rate cuts, and thus benefit risk assets, including BTC.
- If the market unexpectedly strengthens, it could trigger concerns about a "postponement of the interest rate cut," putting downward pressure on highly valued assets.
3. As a core basis for the Federal Reserve's policy-making, the core PCE data released on Friday will be key to determining the expected direction of interest rates in December.
- Meets or falls short of expectations: solidifying expectations of interest rate cuts and acting as a catalyst for a rebound in tech stocks and BTC.
- Significantly higher than expected: This triggered concerns about monetary policy tightening, leading to profit-taking in BTC at this level.
All viewpoints, analytical models, and operational strategies presented in this article are derived from personal technical analysis and are intended solely for personal trading journal purposes. They do not constitute any investment advice or basis for action. The market is risky; invest with caution. (DYOR)