
Breaking below key support, where is Bitcoin's bottom? How to trade now?
- Core View: Based on a proprietary technical analysis model, the article points out that Bitcoin's correction from its all-time high exhibits an A-B-C three-wave structure. The current C-wave decline has been confirmed, indicating a short-term bearish trend. However, the probability of a deep decline is reduced due to improved liquidity, suggesting a scenario where time is exchanged for space.
- Key Elements:
- Technical Structure Confirmation: Bitcoin's weekly chart broke below the key level of $80,600, confirming the C-wave correction. The correction targets point to $75,200 and the $69,000-$72,500 zone.
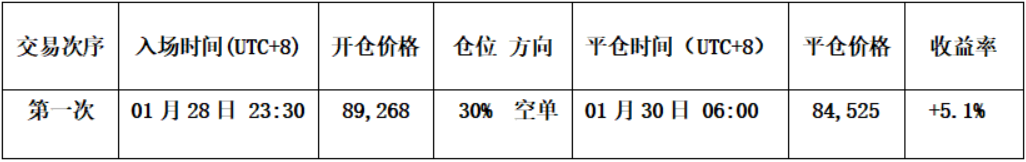
- Model Signal Convergence: The author's proprietary momentum quantitative and spread trading models issued top signals, successfully guiding a short-term trade to short around $89,268 and close the position at $84,525, yielding a 5.1% profit.
- Market Sentiment & Cycle: Previously, market sentiment turned optimistic after a rebound to $97,924. However, the author judged this as merely a B-wave rebound, not a trend reversal, emphasizing the value of structural analysis during optimistic periods.
- Current Bull-Bear Assessment: Both weekly and daily technical models show accelerating bearish momentum release. Sentiment models indicate weak support, suggesting bottom signals have not yet appeared.
- Outlook & Strategy: Expect volatility this week between the resistance zone of $80,000-$80,600 and the support zone of $74,500-$75,200. Operationally, maintain a medium-term bearish position. Two short-term contingency plans are outlined: shorting upon touching resistance levels or chasing the short upon breaking below support.
In the analysis a month ago, I repeatedly reminded investors that the rally initiated around $80,600 was more likely a technical correction rather than a trend-level move. Based on the structure, sentiment, and cycle analysis at the time, caution was warranted for a secondary decline risk following the rebound.
The actual market performance has precisely validated my analysis over the past few months, illustrating that structural analysis often holds greater reference value when sentiment is at its most optimistic.
Core Summary:
• Bitcoin broke below the key level of $80,600 last week, establishing a weekly Wave C correction, aligning with the earlier assessment of the overall market structure.
• Strategy Execution (Short-term) Verification: Last week's trading strictly followed the established strategy, completing one short-term operation (1x leverage), successfully achieving a 5.1% return.
• Core View (Short-term) Verification: At the beginning of last week, the price rebounded near the lower boundary of the rising channel (around $90,500), showing clear exhaustion in upward momentum, forming a technical pattern of "failed breakout retest." Subsequently, the price declined rapidly, consecutively losing multiple support levels, and ultimately broke below the $80,000 psychological level.
The following sections will provide a detailed review of the market forecast, strategy execution, and specific trading process.
1. Analyzing Bitcoin's Decline from a Technical Perspective
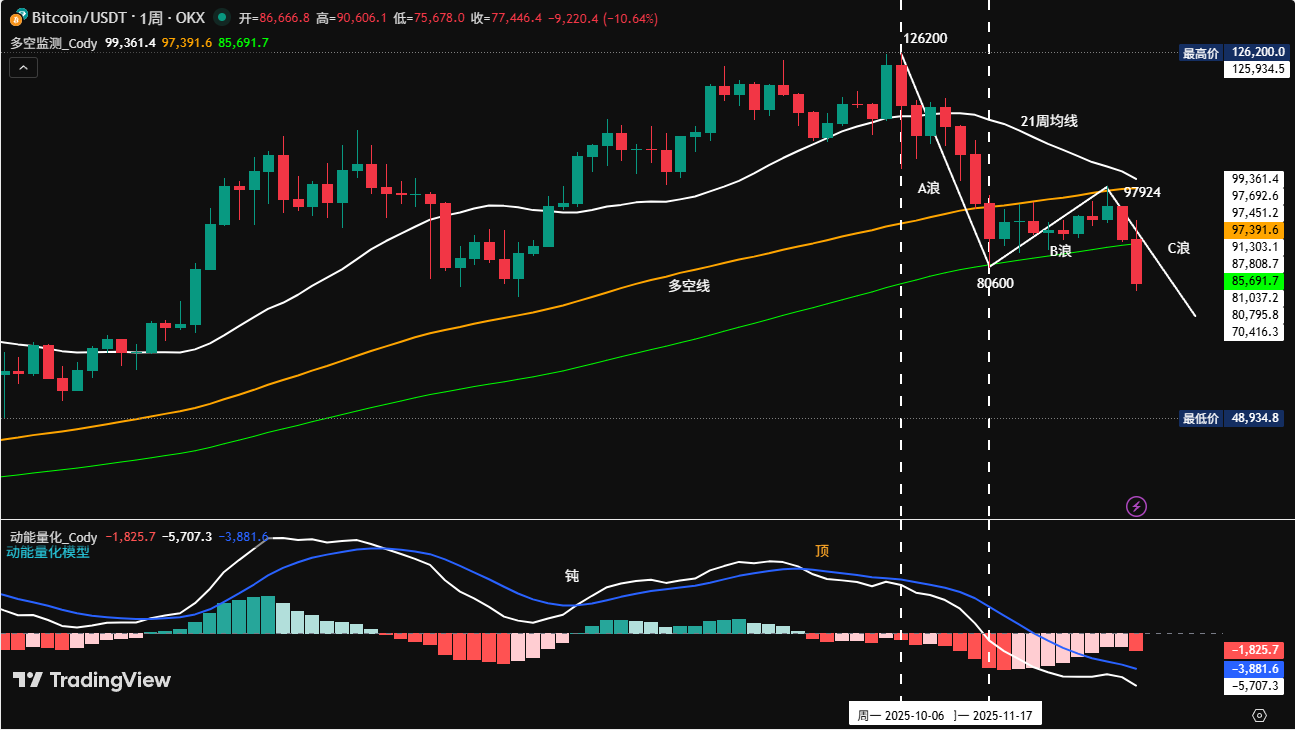
Chart 1
1. Continuity and Consistency Technical Analysis of Bitcoin's Prior Price Structure: (See Chart 1)
• Bitcoin entered a correction phase after hitting a high of $126,200 on October 6, 2025, declining to $80,600 by November 21, a period of 46 days with a maximum drawdown of approximately 36%. According to our proprietary trading system, by the close on November 24, Bitcoin's weekly price had broken below the Bull-Bear Line of the Bull-Bear Monitoring Model (yellow line in Chart 1). Simultaneously, the white momentum line of the Momentum Quantification Model had crossed below the zero axis. The convergence of these two signals led us to conclude that Bitcoin had entered a medium-term bearish trend. Therefore, in my December 28, 2025 and January 4, 2026 weekly reviews, I indicated that the rally from the low of $80,600 was of an oversold rebound nature.
• After Bitcoin's price rebounded to a high of $97,924 on January 16, 2026, market sentiment briefly turned optimistic, with a widespread belief that the correction had ended and a new uptrend had begun. However, based on comprehensive analysis using our proprietary models, in the January 18 weekly review, I clearly stated that the current price action remained a "rebound, not a reversal," with the 21-week moving average serving as the bull-bear watershed. I also noted that the market was in a Wave B rebound phase, with a subsequent Wave C decline still to come, which would break below the Wave B starting point of $80,600.
• In the January 25 weekly review, I further analyzed the price structure, pointing out that the correction from the $126,200 high exhibited an A-B-C three-wave structure. The Wave C decline starting from $97,924 had a first target of breaking below $80,600, with the next target around $75,200.
2. Technical Structure of Wave C Correction and Key Support Analysis: (See Chart 1)
• Wave A: $126,200 to $80,600, lasting 46 days, a 36% decline.
• Wave B: $80,600 to $97,924, lasting 54 days, a 21.5% gain.
• Wave C: $97,924 to present. Key downside support and confluence logic:
• $74,500~$75,200 region (50% Fibonacci retracement of Wave A decline and confluence with the April 2025 correction low)
• $69,000~$72,500 region (61.8% Golden Ratio retracement of Wave A decline and confluence with a previous high region; this area offers stronger support)
• $64,500~$65,500 region (Previous consolidation pivot)
3. Although Bitcoin's price has fallen to around $75,000, I believe it is not advisable to be overly bearish on the market at this juncture. With improving market liquidity and positive policy expectations, the probability of a deep price decline is reduced (this is also a difference from the correction following the November 2021 high of $69,000). However, this may also lead to a prolonged Wave C adjustment, forming a pattern of trading time for space.
2. Last Week's Market Review: (01.26~02.01)
1. Last Week's Short-term Trading Review: As shown in (Chart 2)
First, presenting the results:
We strictly followed the trading signals generated by our proprietary Spread Trading Model and Momentum Quantification Model, as discussed in all previous articles, combined with our market forecast, to execute one short-term trade, achieving a 10% profit on this trade.
Specific trade details and review are as follows:
Bitcoin 30-minute K-line chart: (Momentum Quantification Model + Spread Trading Model)
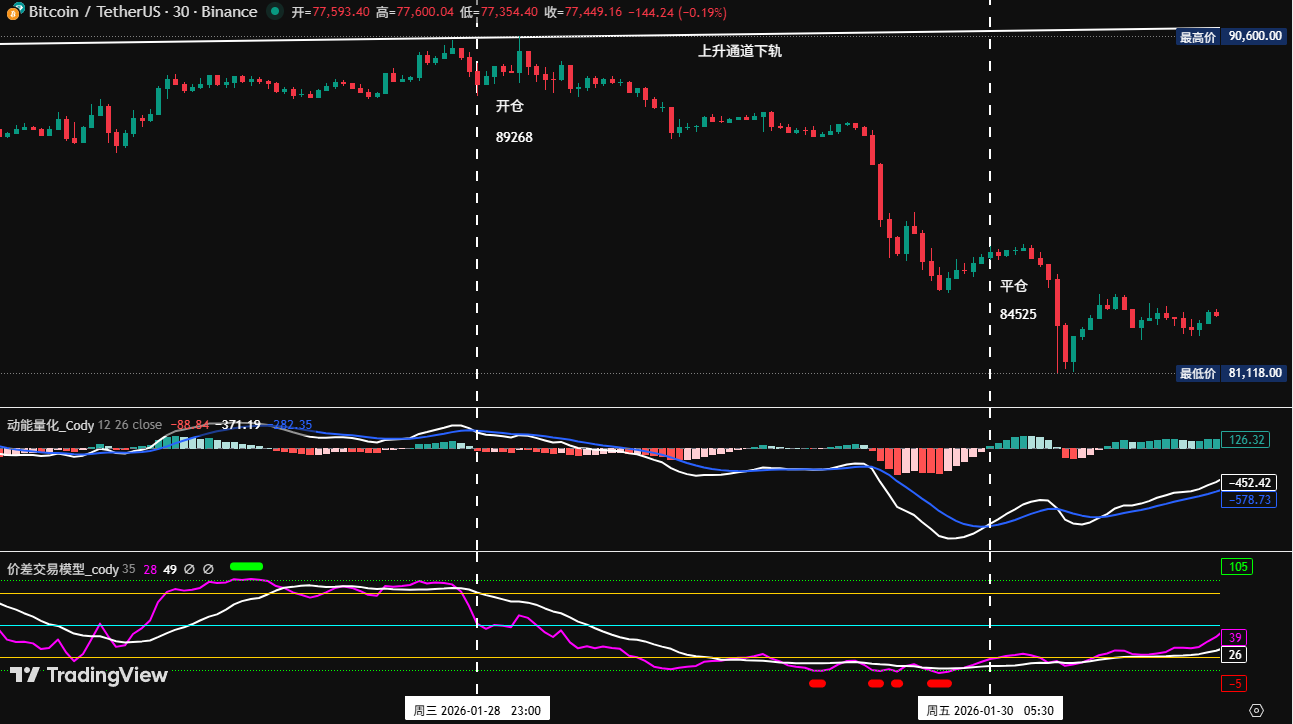
Chart 2
②、Short-term Trade Review:
• First Trade (Profit 5.1%): This operation executed Plan A (Shorting upon valid breakdown of the rising channel's lower boundary) strategy: When the price retested the lower boundary of the rising channel and showed signs of exhaustion, the Spread Model first issued a top warning signal (green dot), followed by a convergence with the Momentum Model triggering a top signal. We established a 30% short position at $89,268. Subsequently, the market trend adjusted. When the price fell to the $84,000 support level, the Spread Model率先 issued a bottom warning signal (red dot), followed by the Momentum Quantification Model and Spread Trading Model converging again to generate a bottom signal. Accordingly, we closed the entire position at $84,525, realizing a successful profit.
2. Last Week's Market Forecast and Operation Strategy Review:
①、Last Week's Core View: Focus on the valid confirmation after breaking below the rising channel's lower boundary. If the breakdown is valid, the price would accelerate its adjustment, with the first target around $84,000.
②、Key Level Review:
Resistance zone: $88,500~$91,200; Support level: $84,000; Important support zone: $80,000~$80,600.
③、Operation Strategy Review:
• Medium-term Strategy: Upon the price retesting and confirming the valid breakdown of the rising channel's lower boundary, we followed the plan to establish a 60% short position around $89,000.
• Short-term Strategy: As the price validly broke below the rising channel's lower boundary, we chose to execute Plan A:
• Entry: Upon valid breakdown combined with model top signals, establish a 30% short position.
• Risk Control: Initial stop-loss for the short position set around 1.5% above the entry price (i.e., 1.015 * entry price).
• Exit: When approaching important support levels combined with model signals, gradually close the position to take profits.
3. Bitcoin Weekly and Daily Charts Converge Bearishly: Has the Bottom Been Reached?
Combining market dynamics, I will conduct an in-depth analysis of Bitcoin's price structure from multiple models and dimensions based on our proprietary trading system.
1. As shown in (Chart 3), analyzing from the weekly chart:
Bitcoin Weekly K-line chart: (Momentum Quantification Model + Sentiment Quantification Model)
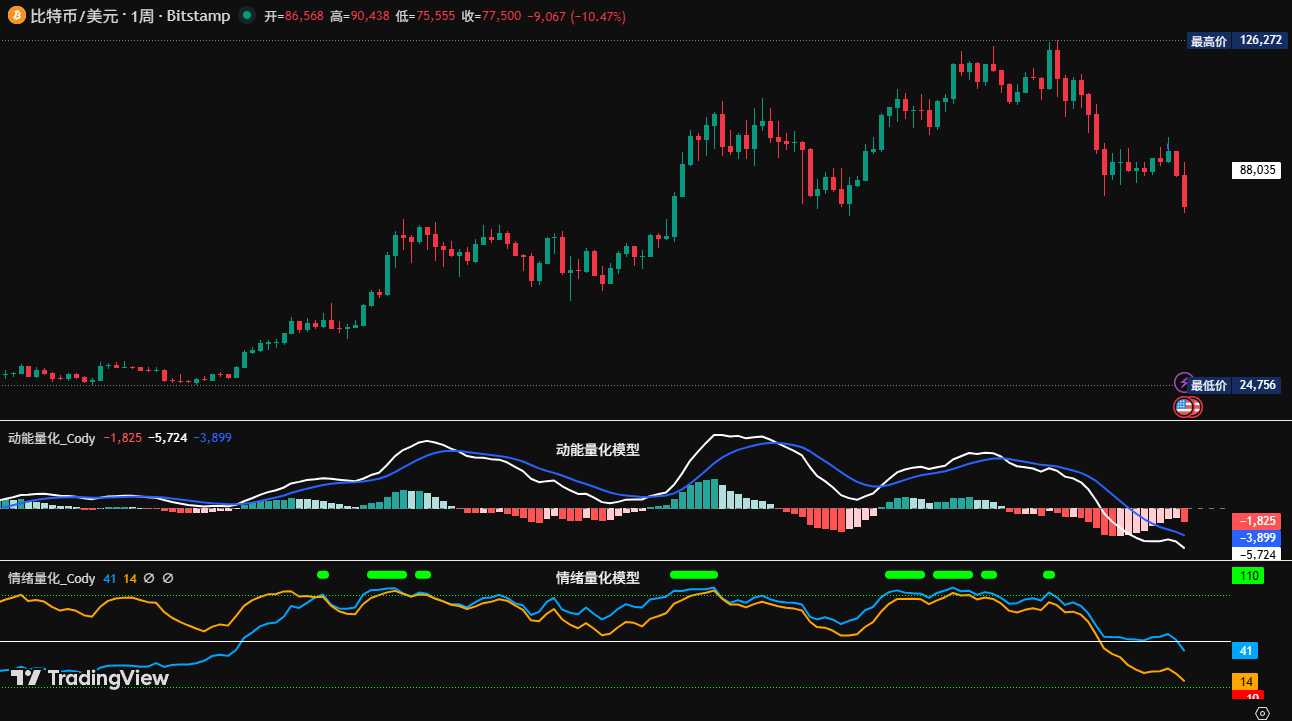
Chart 3
• Momentum Quantification Model: Technical indicators show that selling momentum continued to be released last week, with both momentum lines declining synchronously, and negative energy bars expanding, indicating an accelerating adjustment state.
Momentum Quantification Model indicates: Price Decline Index: High
• Sentiment Quantification Model: Blue sentiment line value 41, intensity zero; Yellow sentiment line value 13 (near bottom area), intensity zero, peak value is 0.
Sentiment Quantification Model indicates: Price Pressure & Support Index: Neutral
• Digital Monitoring Model: No monitoring (top/bottom) digital signals appeared; accelerated decline.
Digital Monitoring Model indicates: Bottom signal not present; Weekly K-line closed as a large bearish candle, decline approximately 11.19%.
The above data suggests: Bitcoin is in a weekly bearish trend; beware of volatile downside risks.
2. As shown in (Chart 4), analyzing from the daily chart:
Bitcoin Daily K-line chart: (Momentum Quantification Model + Sentiment Quantification Model)
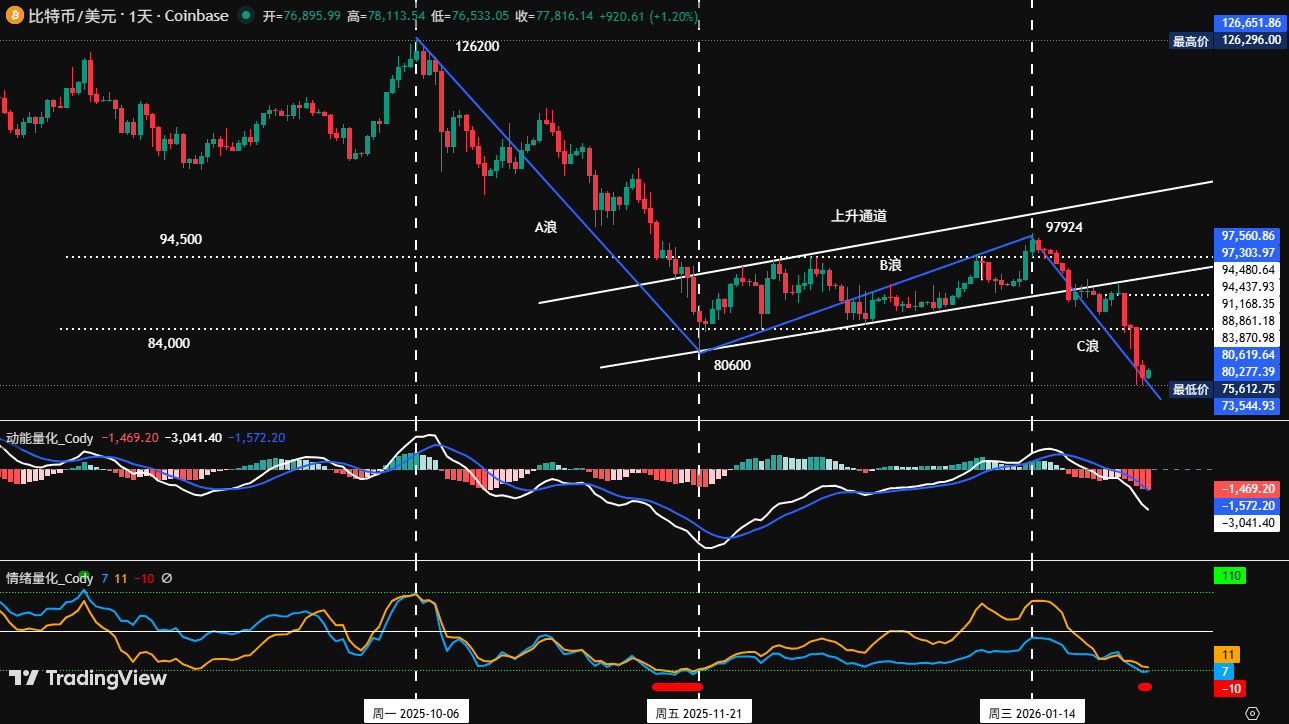
Chart 4
• Momentum Quantification Model: Last week overall presented a pattern of "retesting channel lower boundary confirmation - accelerated decline." By Sunday's close, both momentum lines had crossed below the zero axis, with negative volume bars gradually expanding.
Momentum Quantification Model indicates: Daily timeframe has entered a bear market, selling momentum accelerating.
• Sentiment Quantification Model: After last Sunday's close, the blue sentiment line value was 6, intensity 2,首次出现 bottom warning signal (red dot) for the first time; yellow sentiment line value 12, intensity zero.
Sentiment Quantification Model indicates: Pressure & Support Index: Support strength is weak
The above data suggests: The bottom may not be in yet!
4. This Week's Market Forecast: (02.02~02.08)
1. This Week's Core View: The market is highly likely to maintain a range-bound consolidation pattern this week. Monitor the resistance effect of the $80,000~$80,600 region and the support effect of the $74,500~$75,200 region.
2. Core Resistance Levels:
• First Resistance Zone: $80,000~$80,600 region (Previous low area)
• Second Resistance Zone: Around $84,000 (Lower edge of previous range)
• Important Resistance Zone: $86,000~$86,500 region (Previous high-volume trading concentration area)
3. Core Support Levels:
• First Support Level: $74,500~$75,200 region (Last April's low area)
• Important Support Level: $69,000~$72,500 region (Upper edge area of previous adjustment pivot)
5. How to Operate This Week: (02.02~02.08)
1. Medium-term Strategy: Maintain 60% short position. If the price rebounds and breaks above and stabilizes within the $86,000~$86,500 region, reduce the position to 40%.
2. Short-term Strategy: Utilize 30% of capital, set stop-loss points, and look for "spread" trading opportunities based on support and resistance levels. (Using the 30-minute timeframe as the operational cycle).
3. Operationally, to dynamically respond to market evolution combined with real-time model signals, we have formulated two short-term operation plans, A/B:
• Plan A: If the price rebounds to the $80,000~$80,600 region and confirms the breakdown as valid: (Sell on resistance)
• Entry: When retesting confirms resistance combined with model top signals, establish a 30% short position.
• Risk Control: Initial stop-loss for the short position set around 1.5% above the entry price (i.e., 1.015 * entry price).
• Exit: When approaching important support levels combined with model signals, gradually close the position to take profits.
• Plan B: If the price validly breaks below the $74,500~$75,200 region: (Sell on breakdown of support)
• Entry: Upon valid breakdown of the support level combined with model convergence signals, establish a 30% short position.
• Risk Control: Initial stop-loss for the short position set around 1.5% above the entry price (i.e., 1.015 * entry price).
• Exit: When declining to support levels combined with model signals, gradually close the position to take profits.
6. Special Notes:
1. Upon Entry: Immediately set the initial stop-loss level.
2. When Profit Reaches 1%: Move the stop-loss to the entry price (breakeven point) to ensure capital safety.
3. When Profit Reaches 2%: Move the stop-loss to the 1% profit level.
4. Continuous Tracking: Thereafter, for every additional 1% profit, move the stop-loss up by 1% accordingly, dynamically protecting and locking in profits.


