February 2026 Macro Outlook: Inflation, Liquidity, and Key Variables in Global Markets
- Core View: The direction of global markets in February 2026 will be dominated by marginal changes in liquidity. Markets are entering a "verification phase," analyzing inflation, policy, and asset correlations to understand how liquidity is priced and to filter out short-term noise.
- Key Elements:
- The market's baseline scenario is slowing inflation with lingering service sector stickiness, central banks maintaining a relatively hawkish stance, rate cut expectations pushed back to mid-2026, and risk assets entering a consolidation phase.
- The core risk lies in service sector inflation and wage trends; if they persistently exceed expectations, they will push real rates higher, suppressing duration-sensitive assets like stocks and crypto.
- The February macro rhythm is divided into three stages: early-month data sets the direction, mid-month data intensively tests inflation and central bank credibility, and late-month data confirms the trend and sets up for March.
- Crypto assets (e.g., Bitcoin around $77,000) primarily act as liquidity amplifiers, with their prices highly sensitive to macro signals like interest rates.
- The tokenization scale of Real World Assets (RWA) is significant (e.g., ~$10 billion in on-chain U.S. Treasuries), evolving from speculative tools into interest-rate-sensitive on-chain cash management instruments.
- Geopolitics (e.g., OPEC+ decisions, Japan's election) are key "surprise variables" that can rapidly repricethe market through energy prices and regional risk premiums.
What will determine the direction of the market in February 2026 is not a single event, but the marginal changes in liquidity. When liquidity becomes the core variable, inflation, the labor market, and central bank credibility are no longer isolated indicators; instead, they collectively form the foundational coordinates for market pricing. Even if the macroeconomic trend has not completely reversed, asset prices may undergo structural changes due to subtle adjustments in expectations.
This makes February 2026 a "verification period" rather than a "narrative period." The market is filtering which signals are sustainable and which are merely short-term disturbances. This macro outlook, through the analysis of linkages between interest rates, exchange rates, stocks, crypto assets, and real-world assets, helps readers understand how liquidity dominates pricing, thereby reducing misjudgments caused by noise.

February 2026 Decision-Making Framework
- Baseline Scenario: The Market Seeks Confirmation. Inflation continues its overall deceleration trend, but service sector inflation remains sticky; economic growth performance diverges, and central banks maintain a relatively hawkish stance. Expectations for rate cuts in the US and Europe are mostly pushed back to mid-2026, front-end interest rates remain range-bound, and risk assets enter a consolidation phase after data-driven volatility.
- Upside Inflation Risk: Interest Rate Repricing. Service sector inflation and wage trends remain the core risks, with energy prices potentially acting as an amplifier. If inflation persistently exceeds expectations, real interest rates rise and the US dollar strengthens, putting pressure on stocks, crypto assets, and other duration-sensitive assets.
- Downside Growth Risk: Liquidity Tightening. If employment or consumption data weakens significantly, market focus will shift back to recession risks, typically accompanied by defensive sector rotation, increased FX volatility, and tightening liquidity, with high-beta assets often bearing the brunt first.
February Macro Rhythm: Three Key Phases
The macro risks in February are better understood from the perspective of rhythm and sequence rather than looking at single events in isolation. The entire month can be divided into three phases, each influencing the repricing mechanisms for interest rates, foreign exchange, and risk assets.
Phase 1 (Feb 1–6): Early-Month Data and Policy Signals
The first week sets the initial market direction. The OPEC+ meeting, early policy signals from Asia, and US ISM Manufacturing Index and Non-Farm Payrolls data collectively shape the market's assessment of inflation stickiness and economic resilience, with interest rates and FX typically reacting first.
Phase 2 (Feb 8–18): Inflation and Credibility Test
Mid-month data releases concentrate inflation risks. US CPI, China CPI/PPI, and Japanese political developments impact global asset pricing, while geopolitical events, even without triggering direct policy action, add risk premiums to the market.
Phase 3 (Feb 20–27): Verification and Positioning
In late February, the market shifts from "reaction" to "confirmation." Data such as GDP, PCE, and PPI help determine whether trends are sustainable and guide market positioning for March.
2026 February High-Impact Macro Calendar Date Event Primary Market Sensitivity February 1 OPEC+ Meeting Crude Oil Price (OILUSDT), Inflation Expectations February 2–3 Reserve Bank of Australia Policy Meeting AUD Exchange Rate (AUDUSDT), Asian Risk February 2 US ISM Manufacturing Index Interest Rates, Cyclical Assets February 4–5 European Central Bank Policy Meeting EUR Exchange Rate (EURUSDT), European Duration February 5 Bank of England Interest Rate Decision GBP Exchange Rate (GBPUSDT), UK Gilts February 6 US Non-Farm Payrolls Interest Rates, FX, Risk Assets February 8 Japan Snap Election JPY, Regional Risk February 11 US CPI / China CPI–PPI Interest Rates, Global Inflation February 13–15 Munich Security Conference Geopolitical Risk Premium February 16 Japan GDP JPY, BOJ Expectations February 18 UK CPI GBP Exchange Rate (GBPUSDT), BoE Pricing February 20 US GDP and PCE Growth-Inflation Balance February 27 US PPI / Japan CPI (Tokyo) Inflation Pass-Through, Interest Rates
The Inflation Signals That Truly Move Markets
- Inflation runs through February's macro rhythm. From energy signals at the start of the month, CPI data mid-month, to confirmatory indicators at month-end, the market's focus is no longer on the inflation "number itself," but on whether the inflation structure is threatening central bank policy credibility.
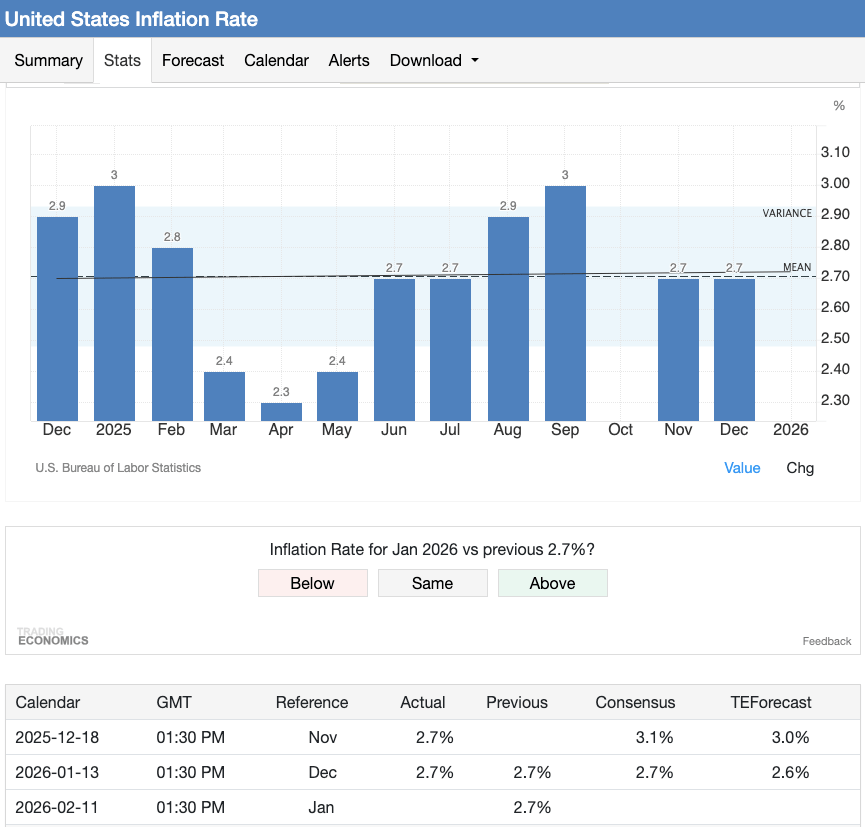 CPI remains around 2.7%, but the market is more focused on the impact of service sector and wage trends on interest rate expectations and risk sentiment. (Source: Trading Economics)
- Energy shocks impact markets first, but the decisive factor is "whether they persist." OPEC+ decisions and geopolitical risks can rapidly reprice oil, pushing up inflation expectations and triggering short-term volatility in interest rates and equities. However, if energy prices fail to rise persistently or do not transmit to inflation expectations and service costs, central banks typically choose to "look through" such shocks.
- Service sector inflation and wages are the most critical constraints. Wage trends can be measured by broader indicators such as the Employment Cost Index (ECI, released February 10), whose changes directly affect service sector inflation. Once wage pressures persist, real interest rates will undergo more sustained repricing, and the policy environment will remain relatively tight.
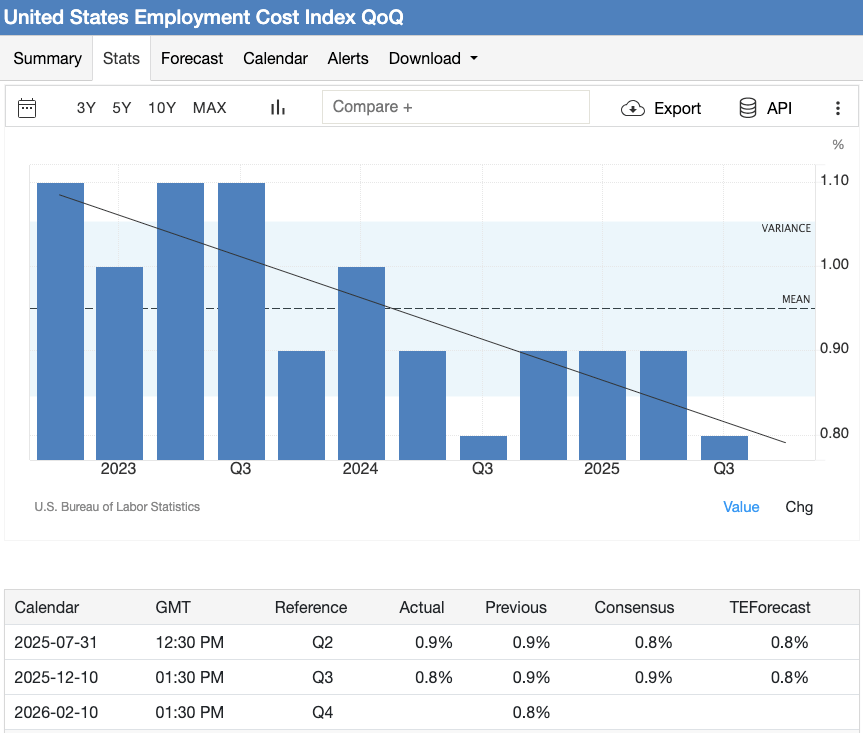 The ECI quarter-on-quarter is approaching 0.8%–0.9%, indicating a slowdown in wage growth and a reduced risk of persistent service sector inflation. (Source: Trading Economics)
- Interpretation risk is rising. Adjustments to Eurozone statistical methodology on February 4th, and seasonal distortions from the Chinese New Year, could amplify the risk of misinterpreting short-term data.
These inflation signals not only affect policy expectations but are also shaping strategy choices highly correlated with interest rates. Taking XT.com's RWA Zone as an example, capital allocation for products like tokenized fixed income is increasingly based on "interest rate stability and policy predictability" as core judgment criteria, reflecting the practical impact of inflation structural changes on on-chain capital allocation.
Possible Central Bank Response Paths
Federal Reserve: On Hold, but Highly Data-Dependent
The Fed maintained the federal funds target rate range at 3.50%–3.75% at its January 27–28 meeting. Since there is no scheduled rate decision window in February, policy influence will come more from subsequent data, changes in financial conditions, and market interpretation of Fed communication, including the January meeting minutes released at month-end.
The Fed's reaction function still centers on service sector inflation and labor costs as core references; these indicators, compared to headline CPI, better reflect the persistence of inflation. During the leadership transition phase, the importance of policy credibility rises further. With President Trump nominating Kevin Warsh as the next Fed Chair, market interpretation of February data may become more sensitive, focusing not only on short-term policy pace but also trying to glean signals about the Fed's tolerance for inflation and long-term expectation anchoring.
Therefore, the risks from rising inflation have clear asymmetry. Real interest rates remain the primary transmission channel; even without immediate policy action, rising real rates can tighten liquidity and suppress risk appetite.
Europe and the UK: Rising Communication Risks
The European Central Bank enters February with a deposit rate of 2.00%, and market consensus on policy stability is strengthening. In this context, upside surprises in inflation data are more likely to trigger market reactions than downside misses, especially given the adjustments to Eurozone inflation statistical methodology.
In the UK, the Bank of England's February 5th rate decision precedes the release of key labor and CPI data for the month, making the importance of forward guidance, tone of communication, and voting splits often greater than the rate decision itself.
Japan and Asia: Normalization Process Overlaid with Political Variables
With the policy rate around 0.75%, the Bank of Japan's policy normalization process remains a focus. GDP and CPI data released in February will directly influence expectations for further tightening, while the February 8th snap election adds political uncertainty to monetary policy, amplifying sensitivity in the yen and Japanese bond markets.
In broader Asia, exchange rate stability and inflation credibility remain core concerns. In an event-packed February, even modest data surprises could trigger amplified reactions in FX and regional markets.
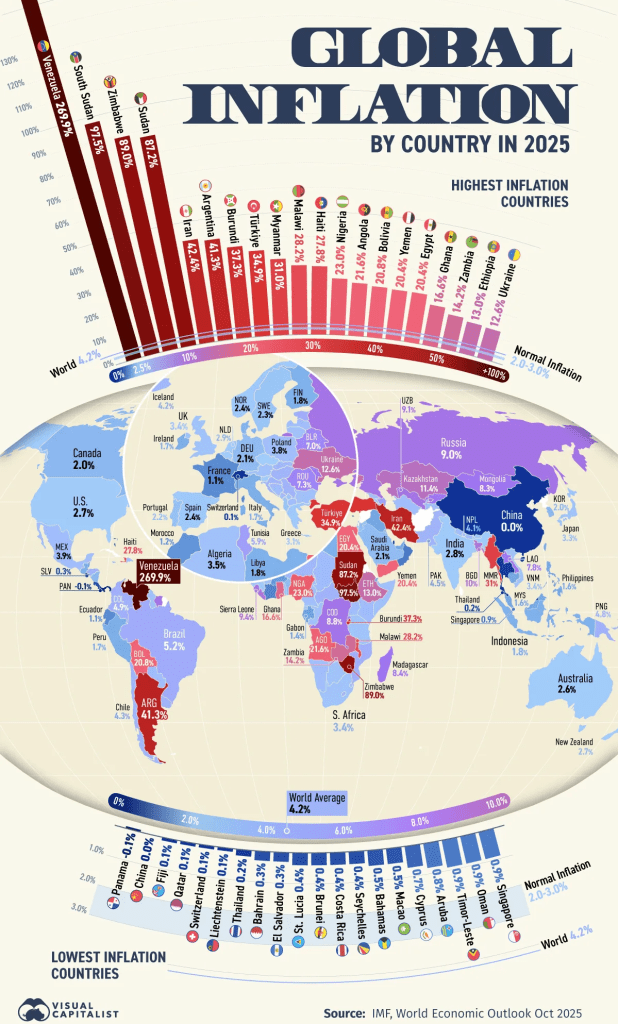 Source: VisualCapitalist.com
Risk Asset Performance Under Liquidity Dominance
Entering February, risk assets remain highly sensitive to the liquidity environment, with interest rates and real rates constituting the primary transmission channels. When inflation or policy expectations change, price repricing often first manifests in duration-sensitive assets before spreading to broader risk markets.
Equities and Valuation Sensitivity
The current trading logic for stocks leans more towards valuation discipline than narrative-driven momentum. As of late January, the S&P 500's forward 12-month P/E ratio is around 22x, significantly above its long-term average. This elevated starting point amplifies market sensitivity to changes in earnings guidance and interest rate expectations.
The performance of large-cap tech stocks is particularly illustrative. In late January, Microsoft (MSFTONUSDT Spot) stock price retreated by about 10%, with market concerns that its cloud business growth may not match the intensity of its AI investments. Pure themes or hype are no longer sufficient to support valuations; capital is flowing more decisively back to companies focused on return on capital and earnings visibility.
Credit, Commodities, and Foreign Exchange
Credit spreads remain at relatively tight levels, leaving limited buffer space should the macro environment weaken. In commodities, crude oil (OILUSDT Perpetual Contract) fluctuates around $70 per barrel, continuing to serve as a rapid-response indicator for inflation changes.
In the FX market, rising volatility typically first impacts high-beta and emerging market currencies, thereby reinforcing overall risk-off sentiment.
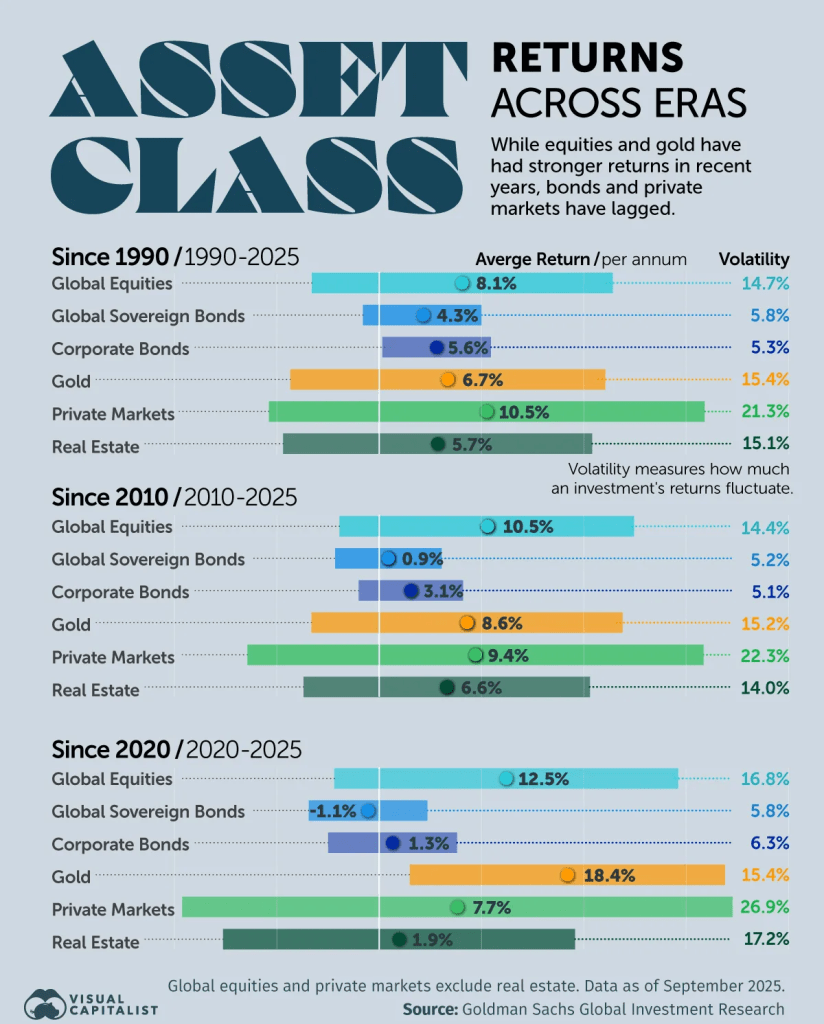 Source: VisualCapitalist.com
Crypto Assets: Amplifiers of Macro Changes
The crypto market continues to play the role of a liquidity amplifier more than an independently operating asset class. As of early February, Bitcoin trades around $77,000, Ethereum around $2,300, and Solana around $100. In February, macro signals are likely to continue outweighing protocol-layer narratives, making crypto assets "early reactors" to liquidity changes rather than dominant forces of independent trends.
For traders looking to observe how macro signals transmit to crypto prices, XT.com's TradFi Zone provides an intuitive tool, displaying contract markets alongside global interest rate, FX, and stock index indicators. This feature can be accessed directly within the contract trading interface.
Desktop (Web)
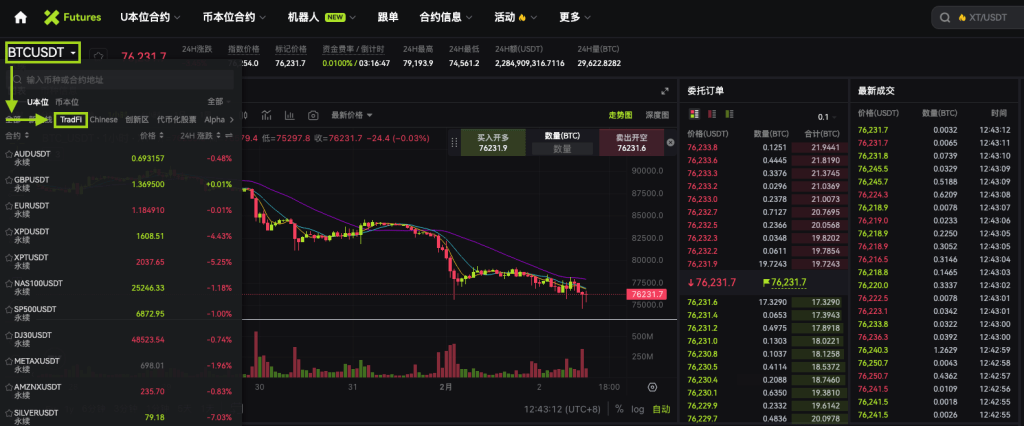 Go to Contract Trading → USDT-Margined Contracts → USDT-Margined Perpetual Contracts, select a trading pair, then open the TradFi Zone from the category menu.
Mobile (XT App)
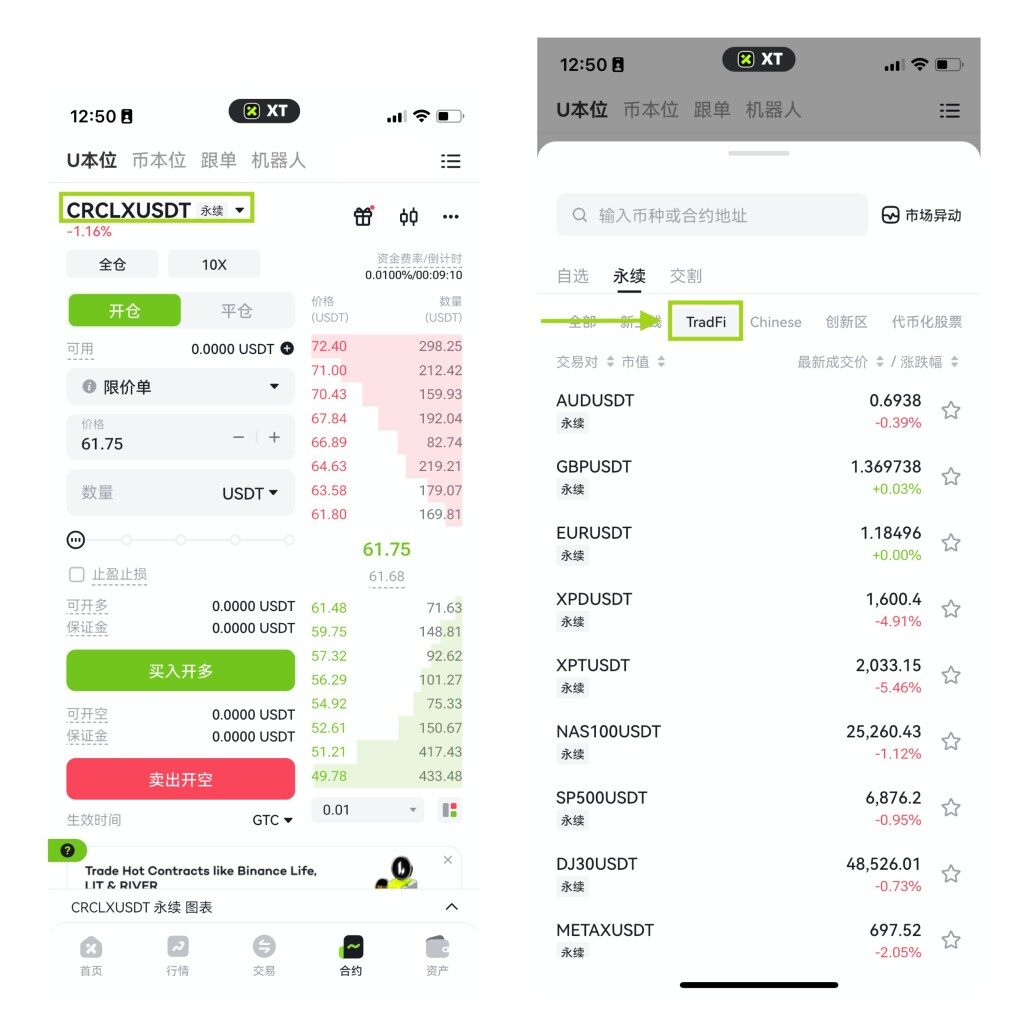 In the XT App's contract trading interface, tap the current trading pair, then select TradFi from the category menu to enter the TradFi Zone.
Real-World Assets (RWA): Translating Interest Rate Expectations into Strategy Execution
When the liquidity environment simultaneously affects the pricing of stocks, credit, commodities, FX, and crypto assets, real-world assets are at the intersection of macro interest rates and on-chain capital allocation. Unlike traditional risk assets that repricing through volatility, RWAs can directly translate interest rate expectations into yield structures and collateral strategies, becoming the "execution layer" for interest rate changes.
Scale and Market Maturity
The tokenization of real-world assets has reached a meaningful scale. According to RWA.xyz data, the current value of on-chain tokenized assets is approximately $25.2 billion, with the stablecoin market exceeding $310 billion. Among these, tokenized US Treasuries account for about $10 billion, becoming one of the largest and most widely adopted RWA categories. This indicates the field is transitioning from early experimentation to practical application scenarios highly relevant to liquidity management and sensitive to interest rates.
As the market expands, the allocation value of RWAs is increasingly viewed as an independent macro theme rather than a mere crypto sub-narrative. XT.com's RWA Zone aggregates various tokenized real-world assets, helping traders more intuitively track their reactions to interest rate changes and policy expectation adjustments.
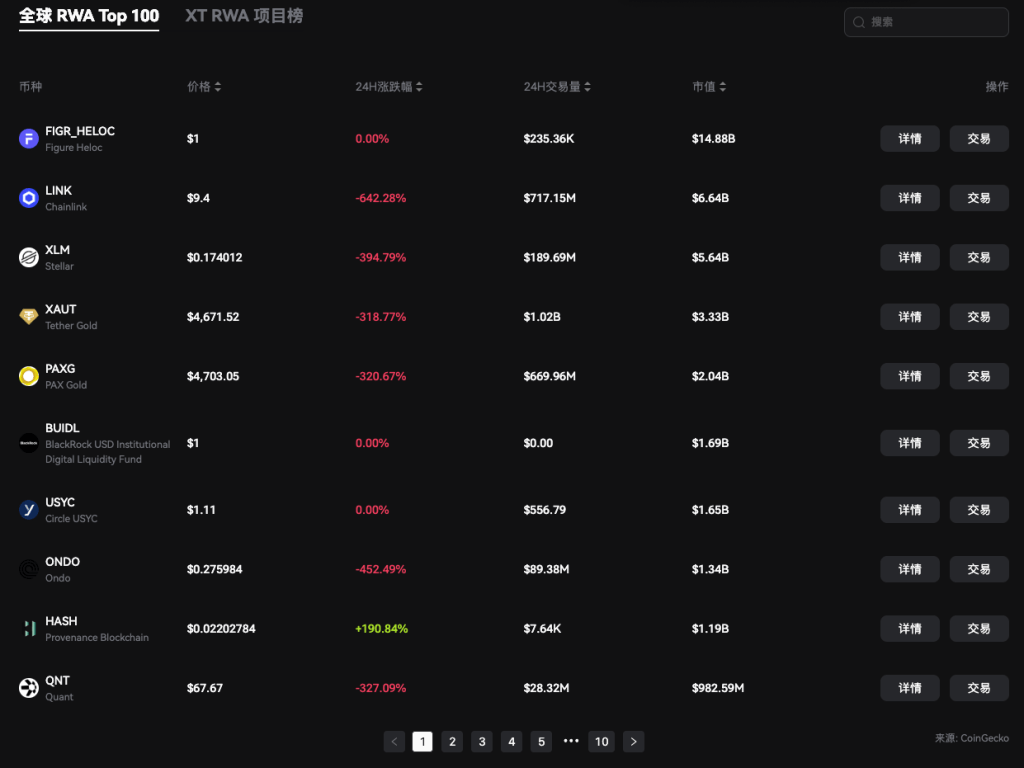 XT's RWA Zone showcases a rapidly expanding ecosystem of tokenized real-world assets, from stablecoins and US Treasuries to gold-backed tokens. As liquidity deepens and individual categories reach multi-billion dollar market caps, RWA exposure is increasingly viewed as a macro sector highly sensitive to interest rates, rather than a niche crypto theme.
From Speculative Tool to Cash Management
The role of tokenized fixed-income products is shifting