
Gate Research: BTCFi diffusion drives Starknet's upward surge; high-performance L1 and on-chain finance narrative gain momentum.
- 核心观点:链上数据揭示市场结构性分化与轮动。
- 关键要素:
- Solana链上活跃度与交易量持续领先。
- Arbitrum资金净流入显著,获机构青睐。
- BTC跌破短期成本线,进入调整换手阶段。
- 市场影响:资金向有叙事和增长潜力的生态集中。
- 时效性标注:短期影响。
On-chain data digest
Overview of on-chain activity and fund flows
To accurately assess the real-world usage of the blockchain ecosystem, this section will examine several key on-chain activity metrics, including daily transaction volume, gas fees, active addresses, and net cross-chain bridging traffic, covering multiple dimensions such as user behavior, network usage intensity, and asset liquidity. Compared to simply observing capital inflows and outflows, this native on-chain data provides a more comprehensive reflection of fundamental changes in the public chain ecosystem, helping to determine whether capital flows are accompanied by actual usage demand and user growth, thereby identifying a network foundation with sustainable development potential.
Transaction volume analysis: Solana remains at a high level, while mainstream public chains maintain stable activity.
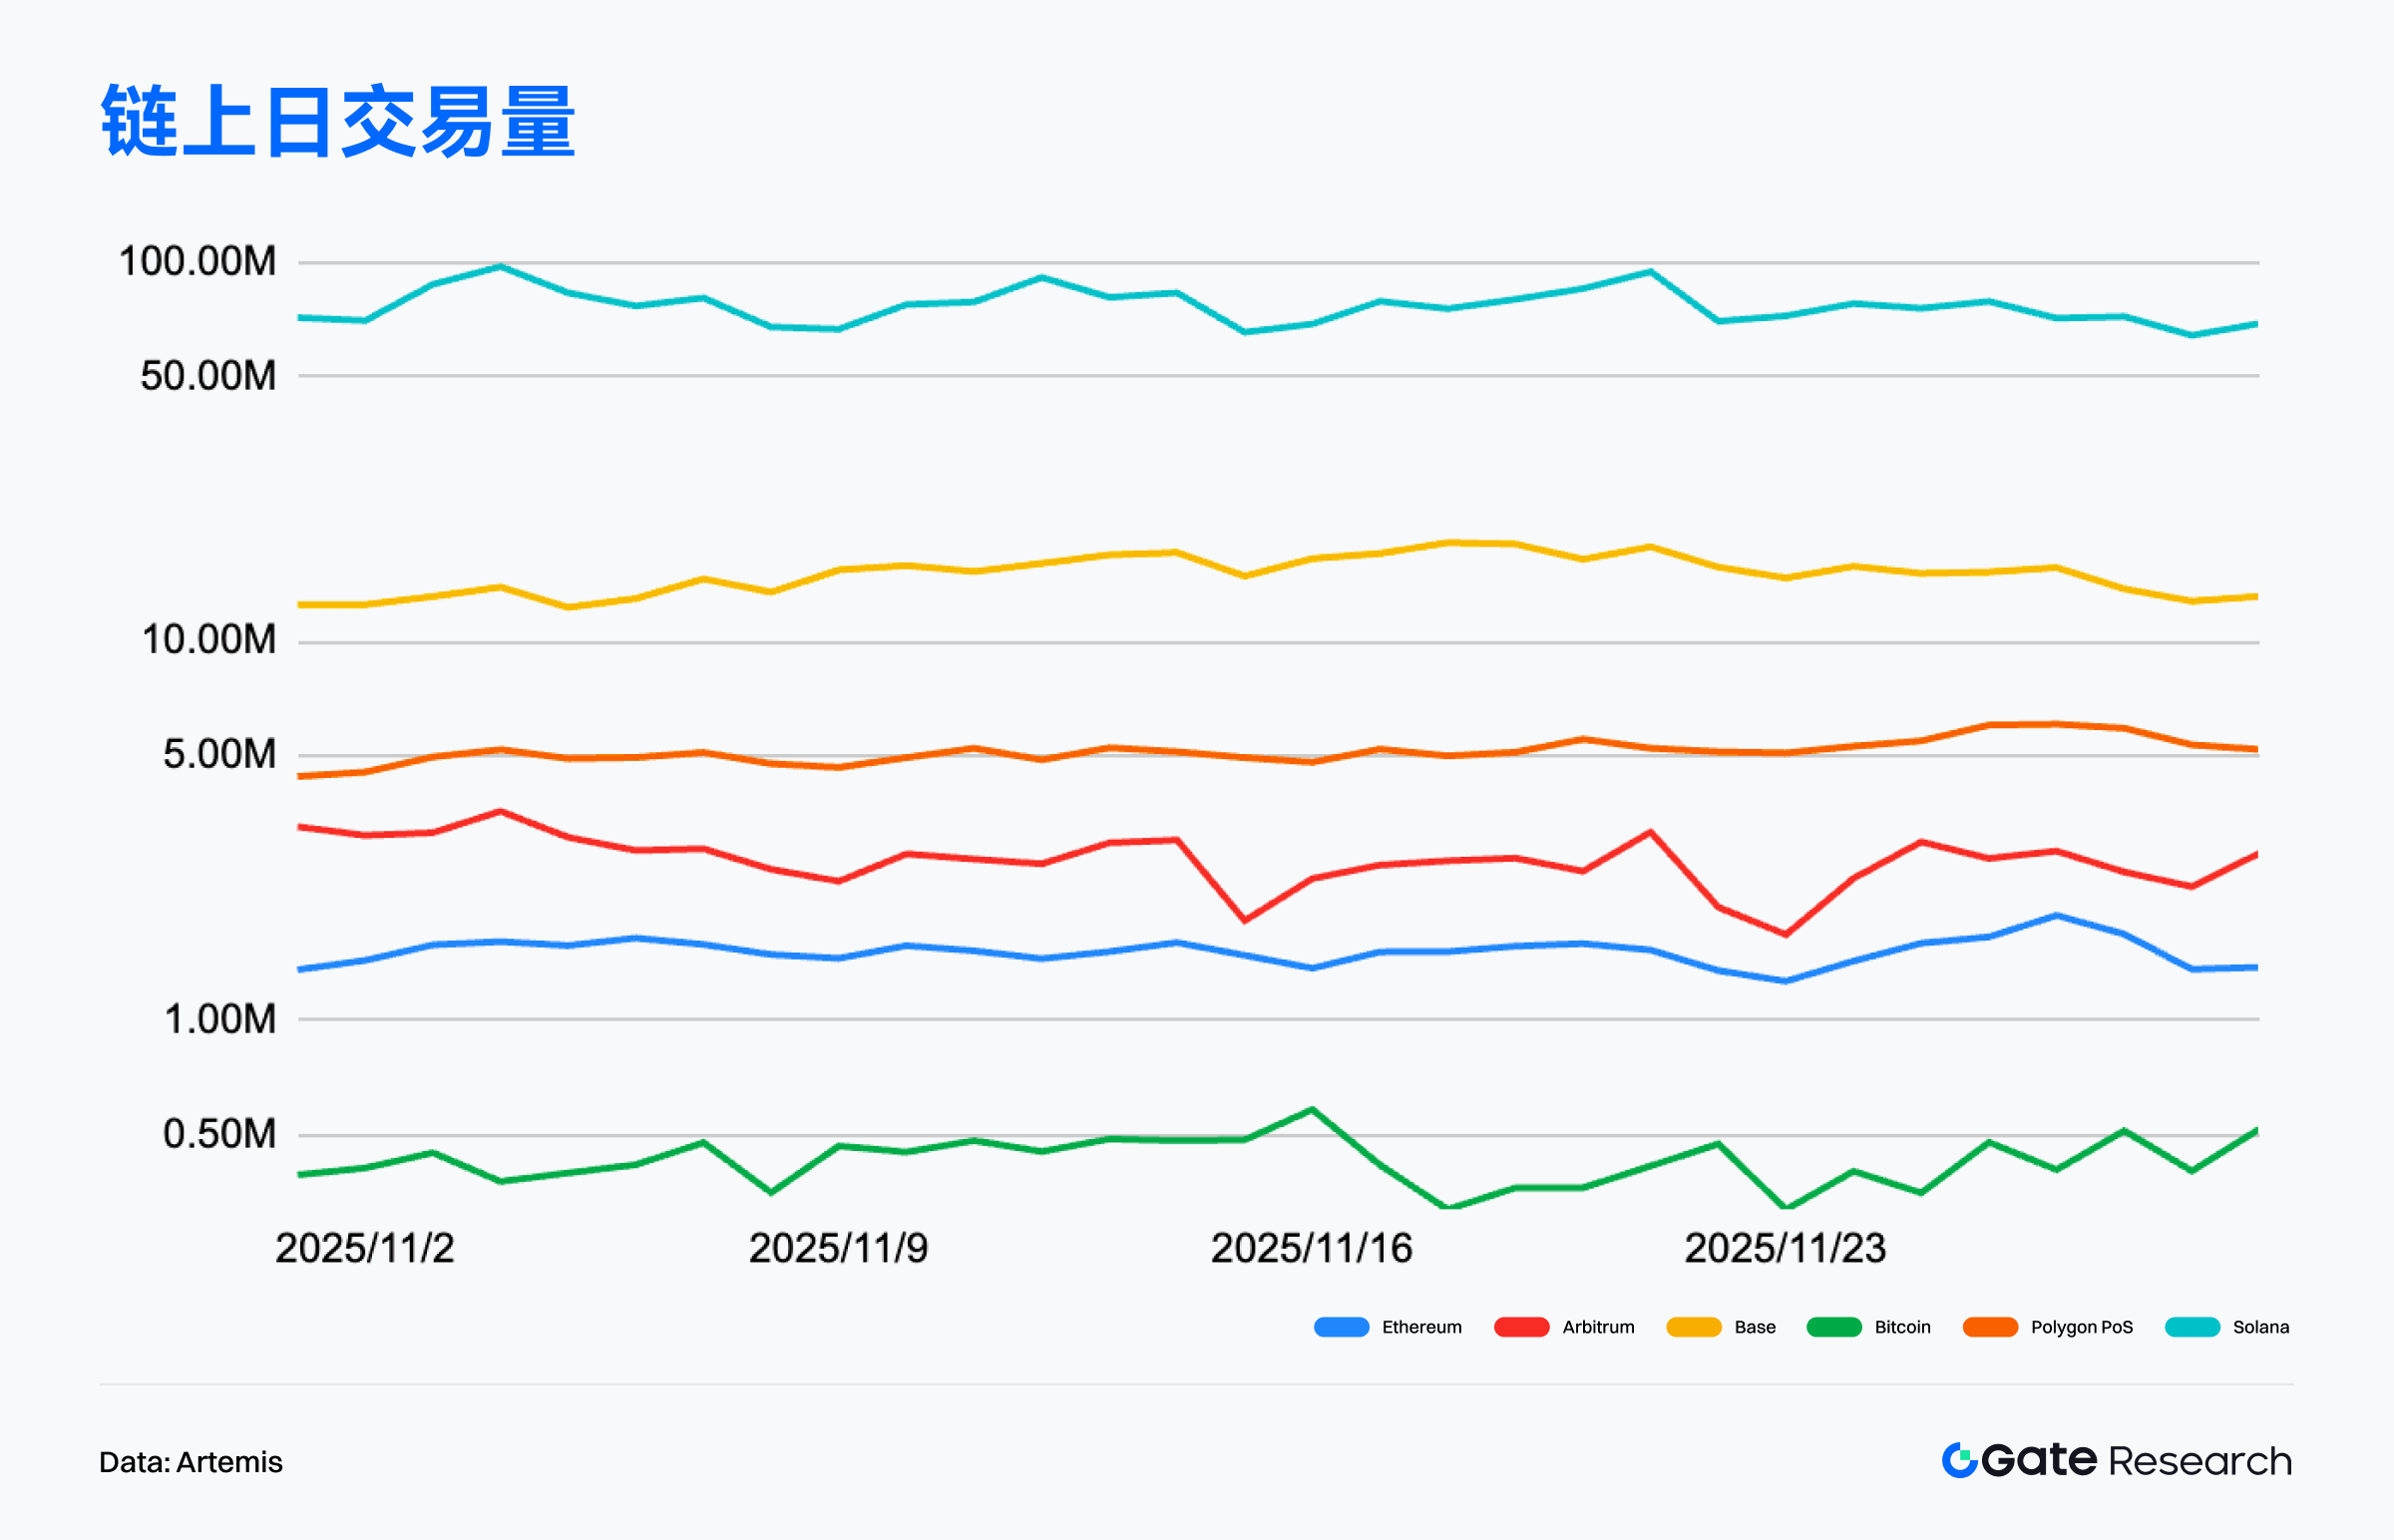
According to Artemis data, on-chain transaction activity across multiple mainstream public chains maintained a moderate upward trend in November, exhibiting a structural pattern dominated by high-performance public chains and a gradual recovery of Layer 2 blockchains. In terms of trends, Solana maintained a significant lead throughout the month, with daily transaction volume mostly falling between 70 million and 100 million transactions, and experiencing several surges in the middle and end of the month, demonstrating that its high-frequency interactive applications continued to support ecosystem activity, and its usage intensity remained stable even during market volatility. [1]
Base's overall trend shows a moderate upward movement, with transaction volume gradually increasing from approximately 10 million transactions in September to between 12 and 14 million transactions in November. The monthly structure remains relatively stable, reflecting the robust interaction demand generated by its social and lightweight application ecosystem. In contrast, Arbitrum's on-chain transaction volume exhibits a typical sideways oscillation structure over the three months: fluctuating repeatedly within the range of 2.5 to 4.5 million transactions, without a sustained upward trend. From a medium-term perspective, Arbitrum has not shown the "continuous recovery" or "significant transaction rebound" commonly described in the market narrative; rather, it is closer to maintaining a weak range-bound oscillation with stable but stagnant ecosystem activity.
Overall, the transaction volume structure over the past three months exhibits the following characteristics: Solana remains stable at a high level, a strong trending chain that ignores market fluctuations; Base shows a slight upward trend in the medium term, with its ecosystem diffusion effect continuing. This may mean that the stratification of on-chain activity remains clear, with high-performance chains driving overall traffic. Among Layer 2 chains, only Base shows structural improvement, while Arbitrum is currently closer to a state of "stable but not expanding." The market should avoid over-interpreting its short-term fluctuations as a trend recovery.
Active address analysis: Solana leads the pack, while Arbitrum remains in a low-level consolidation.
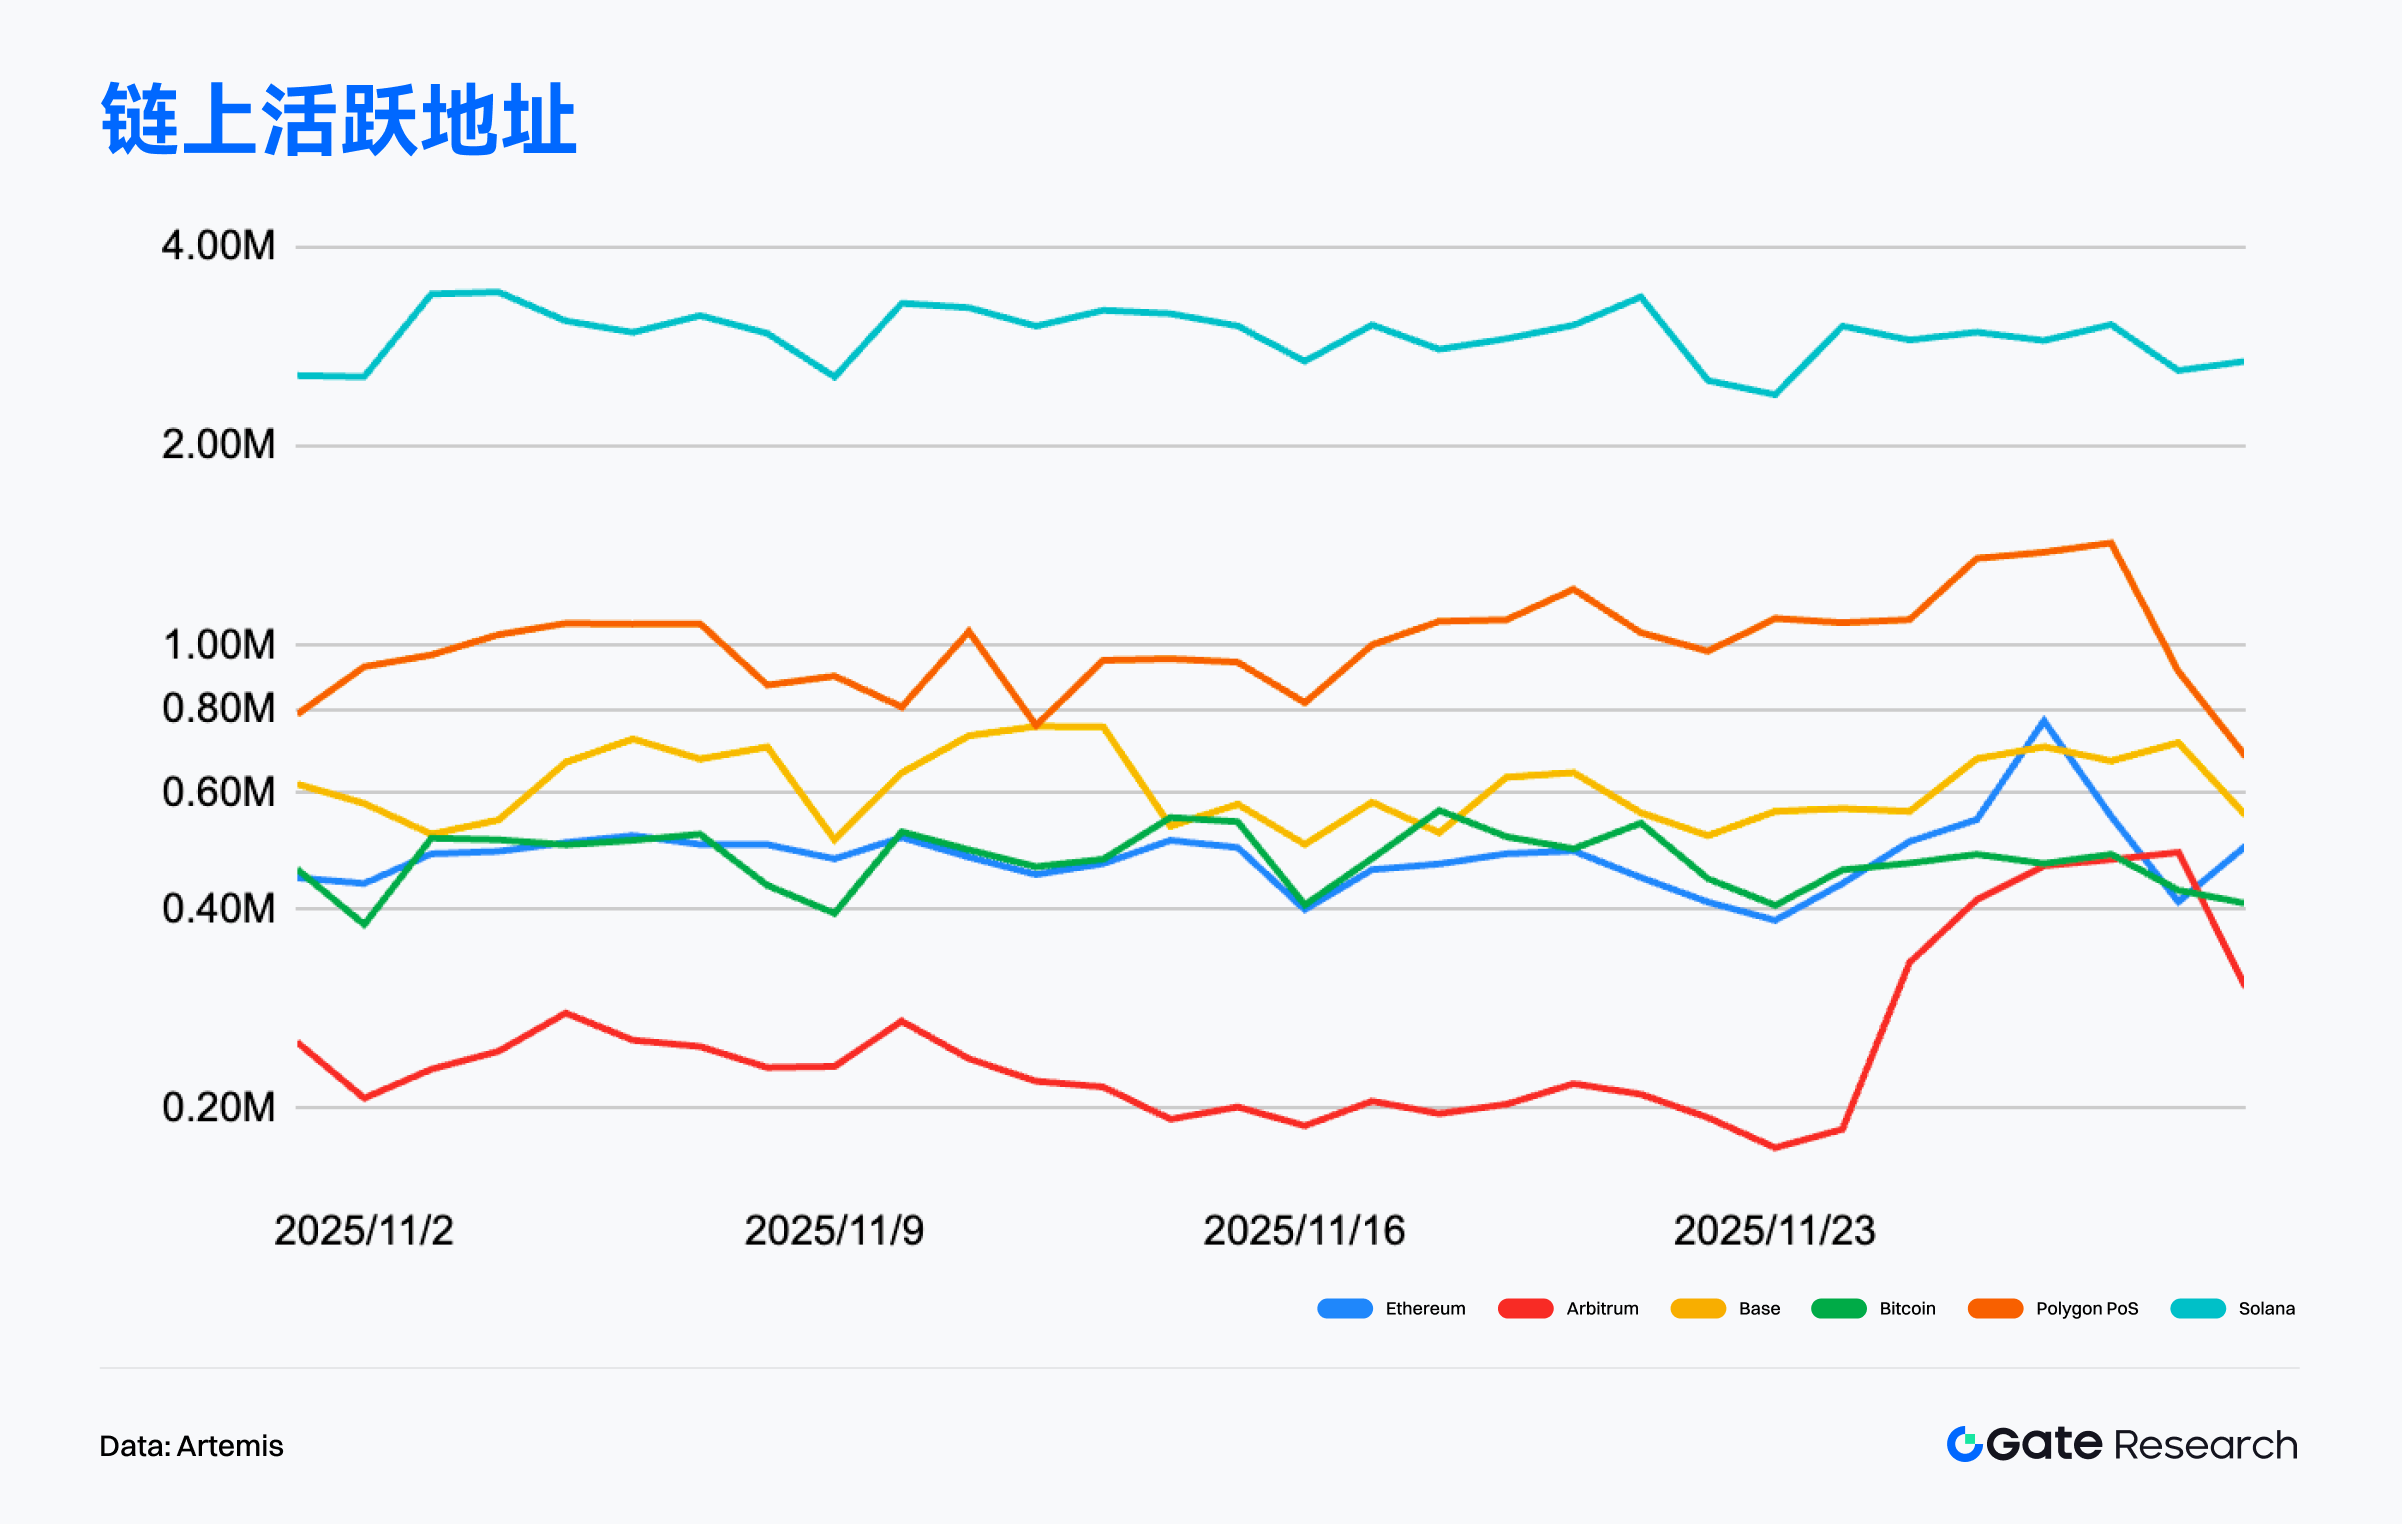
According to Artemis data, the overall active addresses across multiple chains remained stable in November, but the structural differences between different public chains were more pronounced. Solana significantly outperformed other chains with an average of 2.5 million to 3.5 million active addresses per day. Although there were cyclical fluctuations, it maintained a high level overall, demonstrating the stickiness and high-frequency interaction characteristics of its application ecosystem. [2]
Polygon PoS performed steadily in November, with active addresses mostly ranging from 800,000 to 1.2 million, briefly exceeding 1.3 million at the end of the month, making it one of the most active mainchains besides Solana. Base followed closely with approximately 550,000 to 750,000 daily active users, maintaining a stable structure and reflecting the continued appeal of its social and lightweight application ecosystem. Arbitrum, on the other hand, exhibited more pronounced low-level fluctuations, with active addresses gradually declining from approximately 250,000-300,000 at the beginning of the month to a low of 180,000-200,000 in the middle of the month. Although there was a rebound at the end of the month, it remained within a low-level fluctuation range overall. Compared to other chains, Arbitrum's user interaction activity was weaker in November, indicating that some activities may have temporarily shifted to the Base and Polygon ecosystems.
Overall, on-chain activity in November exhibited a clearly stratified structure. Solana maintained its absolute leading position in high-frequency interaction scenarios, with activity far exceeding other public chains. Polygon PoS remained consistently higher than Base, indicating that its ecosystem still has a robust and continuously expanding user base. Mainchains Ethereum and Bitcoin maintained stable operation, with no significant expansion or contraction in activity, continuing to play a core role in value settlement and system stability. In contrast, Arbitrum's activity declined significantly this month, fluctuating at a cyclical low level, indicating a temporary cooling of the popularity of some Layer 2 ecosystems. Overall, high-performance chains continued to dominate high-frequency interactions, mid-range chains expanded steadily, while some Layer 2s entered a correction phase, making the stratification trend of multi-chain ecosystems clearer.
On-chain transaction fee revenue analysis: Ethereum and Solana remain the top two, while Base volatility increases.
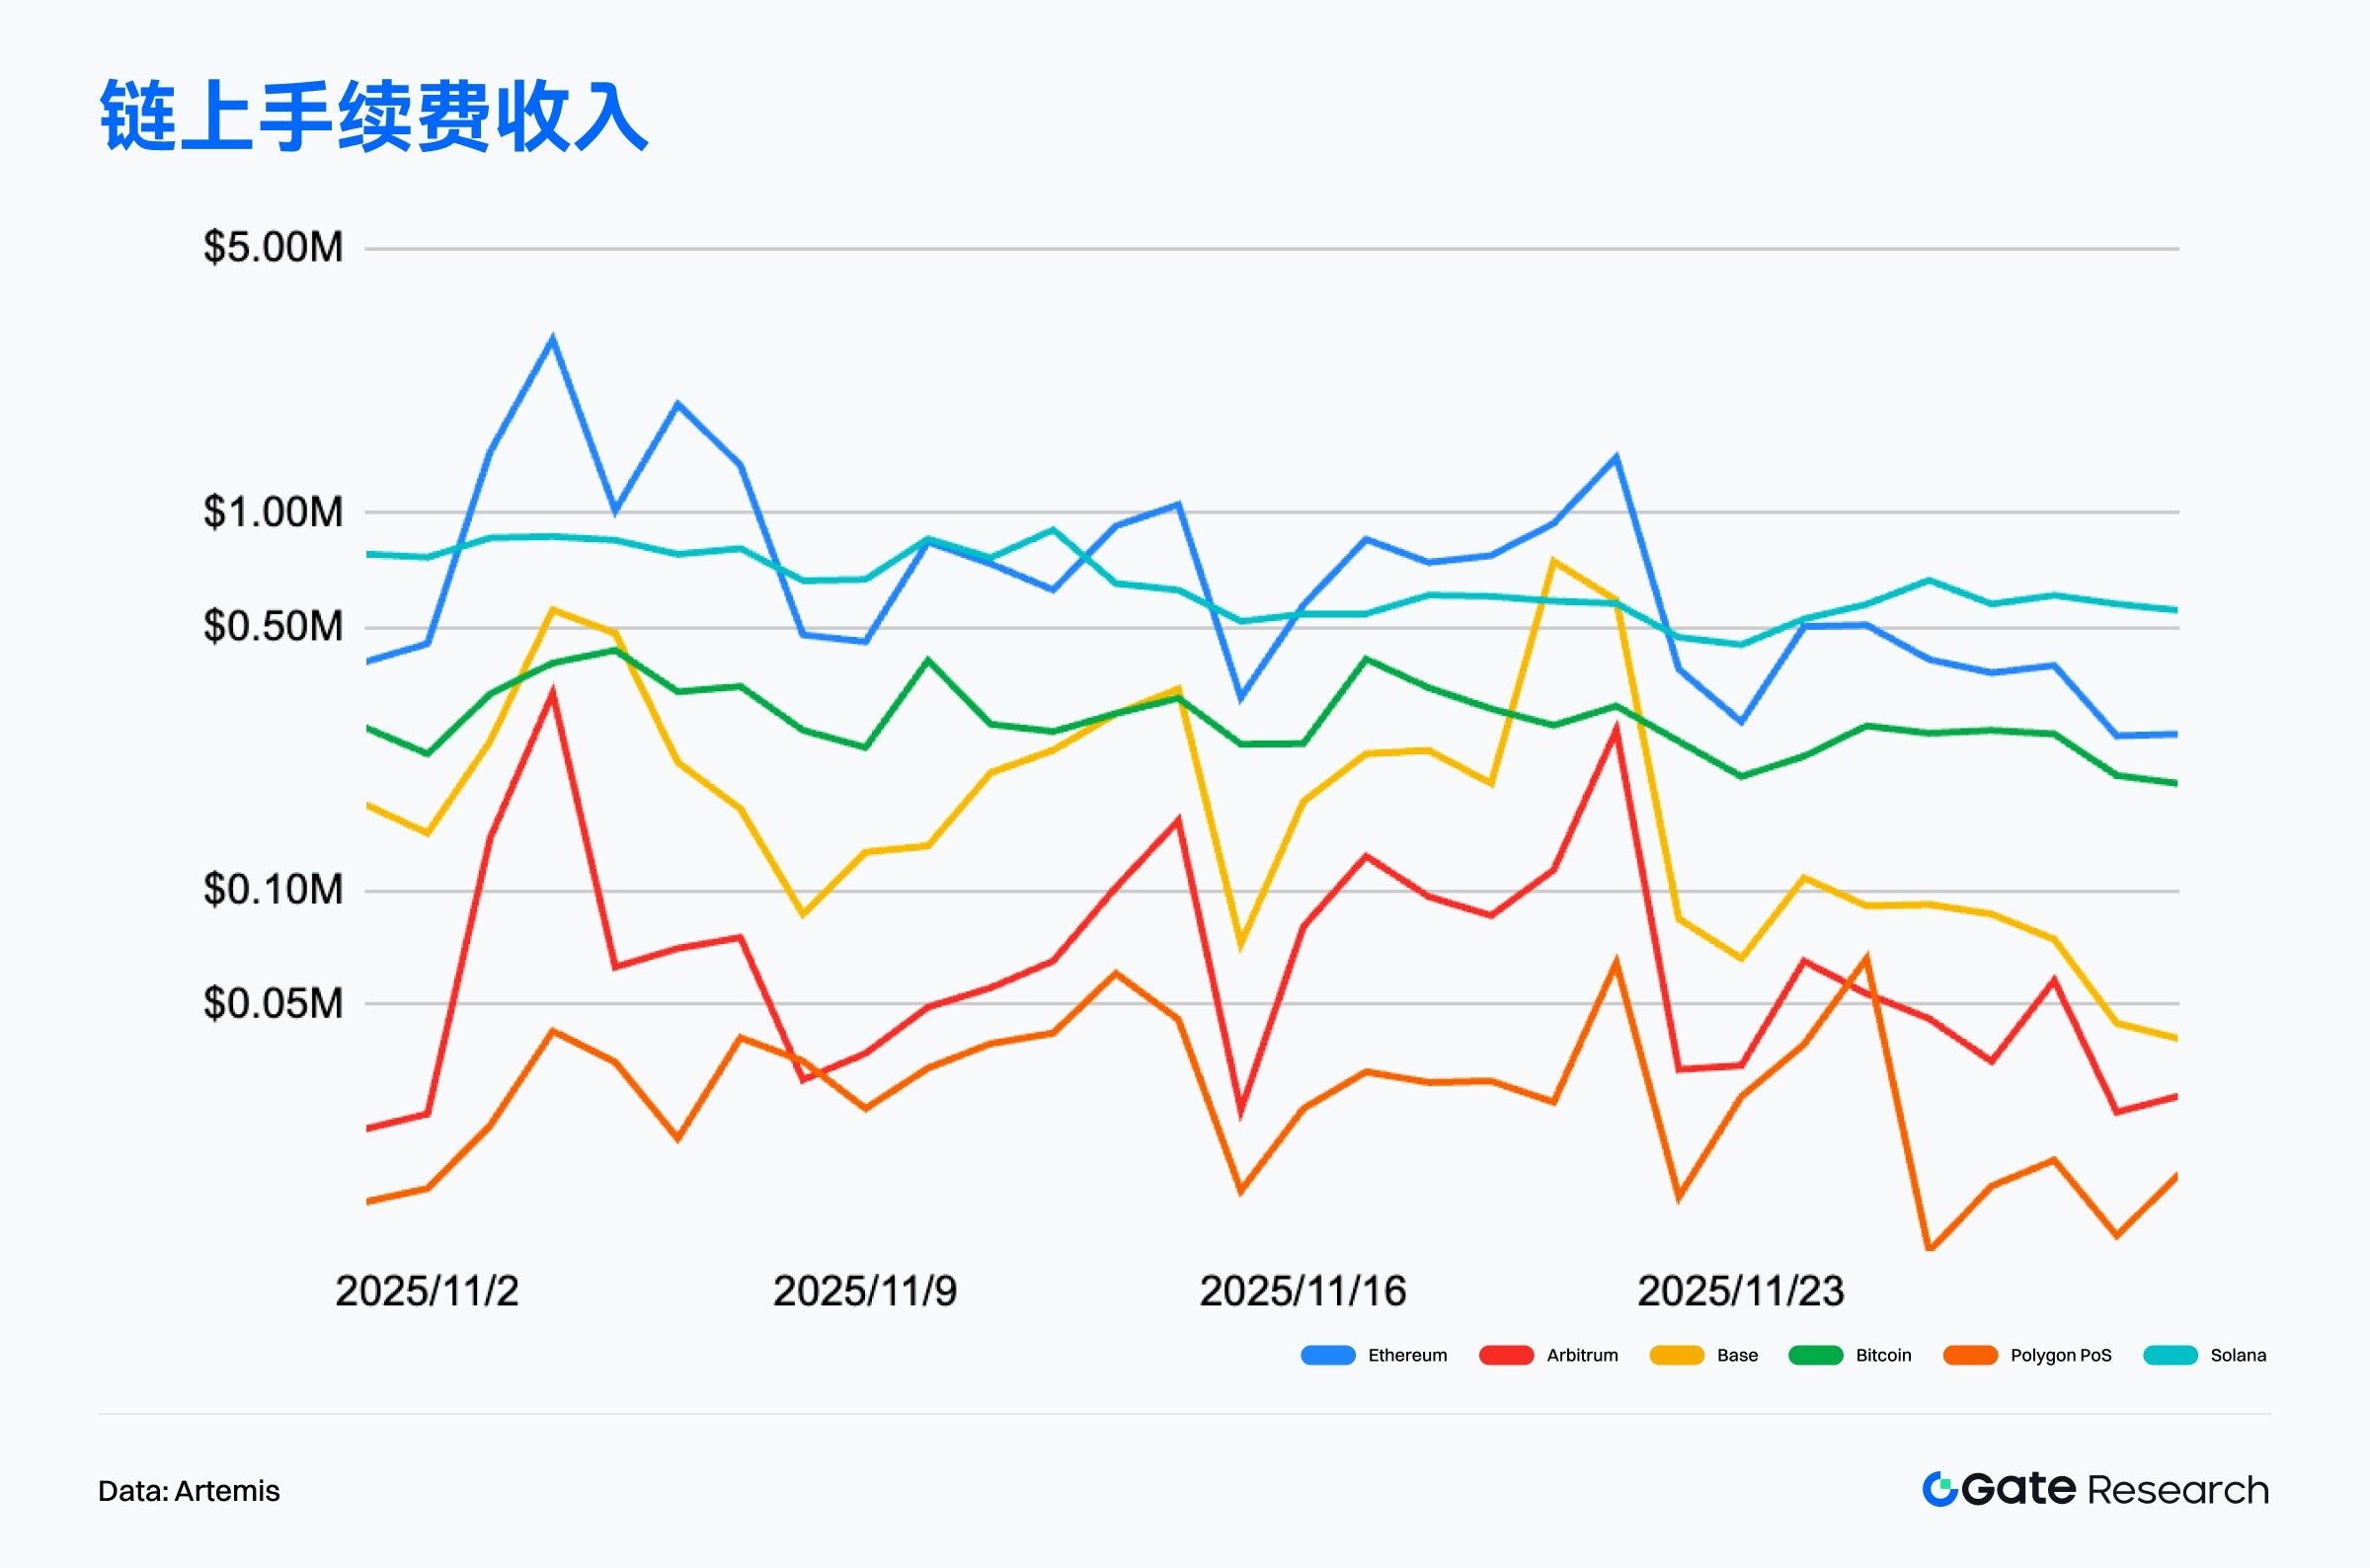
According to Artemis data, the overall transaction fee revenue of mainstream public chains in November showed a structural pattern of "high-value chains maintaining a stable lead, while mid-range chains fluctuated and weakened." Ethereum's total revenue for the month was significantly higher than other chains, with daily transaction fees mostly falling between $500,000 and $1.5 million, and showing three distinct peaks at the beginning, middle, and end of the month, making it the core chain that best reflects changes in market activity. Its transaction fee structure is still dominated by DeFi clearing, high-value transfers, and contract calls, consolidating its position as the economic center of the mainnet. [3]
Solana continues to hold its position in the second tier, with transaction fee revenue mostly concentrated in the $800,000 to $1 million range. Overall volatility is relatively limited, and even with changes in market sentiment, its high-frequency trading, DEX activities, and application interactions maintain stable revenue contributions. In contrast, Base exhibited more significant volatility in November, with daily transaction fee revenue rising repeatedly from below $100,000 to short-term highs of $400,000 to $600,000, and even peaking at over $700,000 at the end of the month. This indicates that certain protocols or transaction activities within its ecosystem can periodically amplify on-chain fees.
Overall, November's fee revenue structure showed a clear stratification, with Ethereum and Solana consistently leading the way, Base experiencing periods of increased volume amidst volatility, while Polygon and Arbitrum remained at low levels. The overall fee revenue did not show sustained expansion, indicating that the on-chain economy, in a low-volatility market, relies more on event-driven growth rather than structural growth.
Public blockchain funding flows diverge: Arbitrum continues to lead the gains, while Starknet and BTCFi narratives rise.
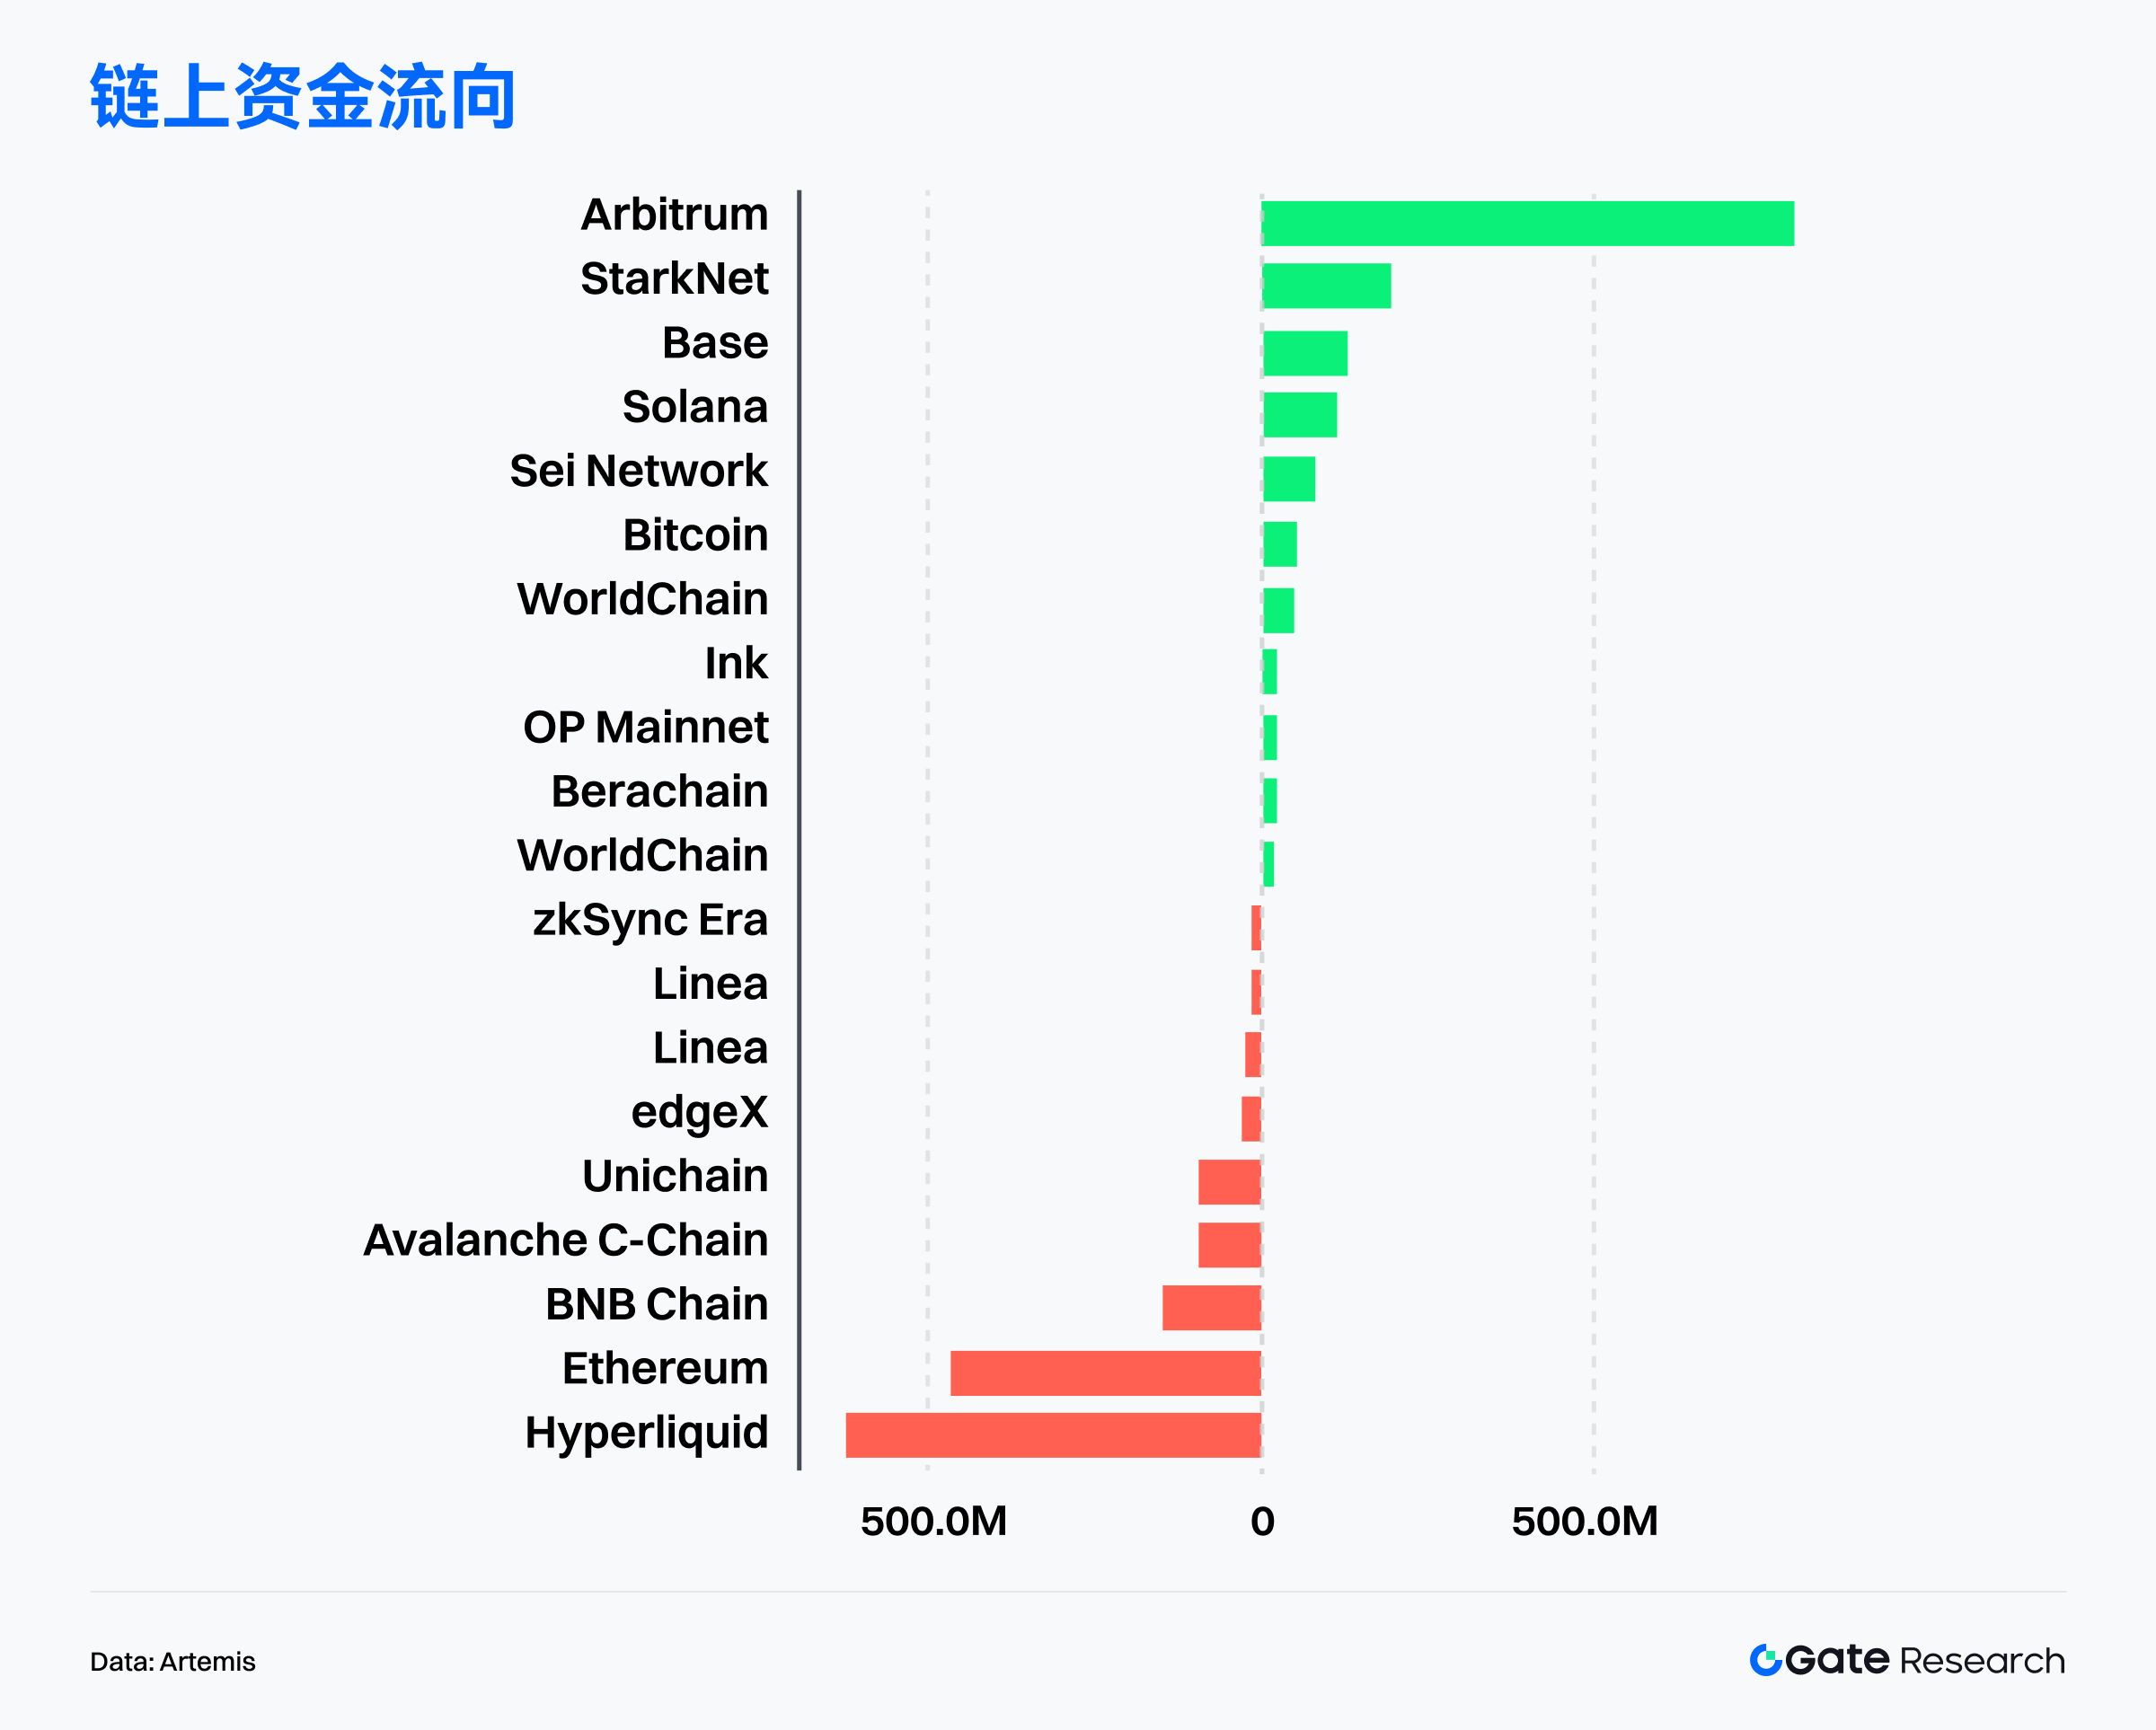
According to Artemis data, on-chain fund flows have shown significant divergence in the past month. High-growth Layer 2 and emerging public chains have continued to receive incremental funds, while some high-valuation main chains have experienced large-scale outflows. Among them, Arbitrum ranked first with a net inflow far exceeding other public chains, reflecting its comprehensive advantages in incentive continuity, institutional layout, and financial infrastructure expansion. Ecosystems such as Starknet, Base, Solana, and SEI also recorded positive inflows, indicating that market funds prefer projects with expansion momentum and narrative extensibility. [4]
Arbitrum's funding appeal stems from multiple accelerations: Robinhood uses it as the core issuance layer for regulated securities tokenization, with on-chain tokenized assets approaching ten million US dollars and a real trading cycle taking shape; the intensive deployment of institutional-grade infrastructure such as Deblock, BlockControl, and Hermes has elevated its positioning from a "DeFi chain" to a "cross-chain liquidity and asset settlement hub"; the supply of USDC and USDT has both increased, and the ETH inventory of cross-chain bridges has reached a new high, continuously enhancing the on-chain funding capacity.
Starknet also performed exceptionally well under the BTCFi narrative: its BTC staking scale accumulated rapidly, multiple BTC asset paths were implemented, accelerating its move towards the "Bitcoin yield layer"; its STRK staking system and validator structure matured, with over 1 billion STRK participating in staking, and its network security and economic model stabilized; its DeFi ecosystem and consumer-grade applications grew in parallel, with user scale exceeding one million driven by application scenarios based on account abstraction.
In contrast, previously popular ecosystems such as Hyperliquid, Ethereum mainnet, BNB Chain, and Avalanche have generally experienced significant net outflows, indicating that funds are withdrawing from overvalued ecosystems and shifting towards public chains with higher growth potential and stronger narratives. Overall, the market has entered a phase of "structural rotation + risk repricing," with funds concentrating on on-chain ecosystems with established narratives, stable user growth, and expansion potential.
Bitcoin Key Indicator Analysis
The cryptocurrency market accelerated its decline in November due to excessive leverage, falling 17.5% for the month, marking the largest monthly correction this year and putting pressure on risk assets overall. Against the backdrop of weakening economic data and a dovish stance from the Federal Reserve, the probability of a December rate cut has risen to over 80%. Although BTC and ETH recovered $90,000 and $3,000 respectively last week, trading volume decreased significantly, indicating limited upward momentum. Institutional investors remain cautious, with weak inflows into Bitcoin spot ETFs, and structural demand remains subdued.
Against this backdrop, on-chain data presents more structured signals. BTC is still operating above the multi-core cost line, and the overall risk indicators remain neutral to strong, indicating that the main trend has not been broken. However, the densely packed area above still constitutes short-term resistance. At the same time, the realized loss indicator has rebounded significantly, indicating that the market is undergoing a phase of adjustment with a mix of sentiment clearing and high-level selling pressure. Short-term funds are still cautious about taking over. In a longer time frame, the profit margin of long-term holders continues to decline and there are signs of net selling, reflecting that some early holders are entering the realization phase, and the market structure is shifting from inertial upward movement to trend turnover and cyclical cooling.
BTC has fallen below the short-term and active investor cost line, and risk indicators have shifted to a neutral to weak range.
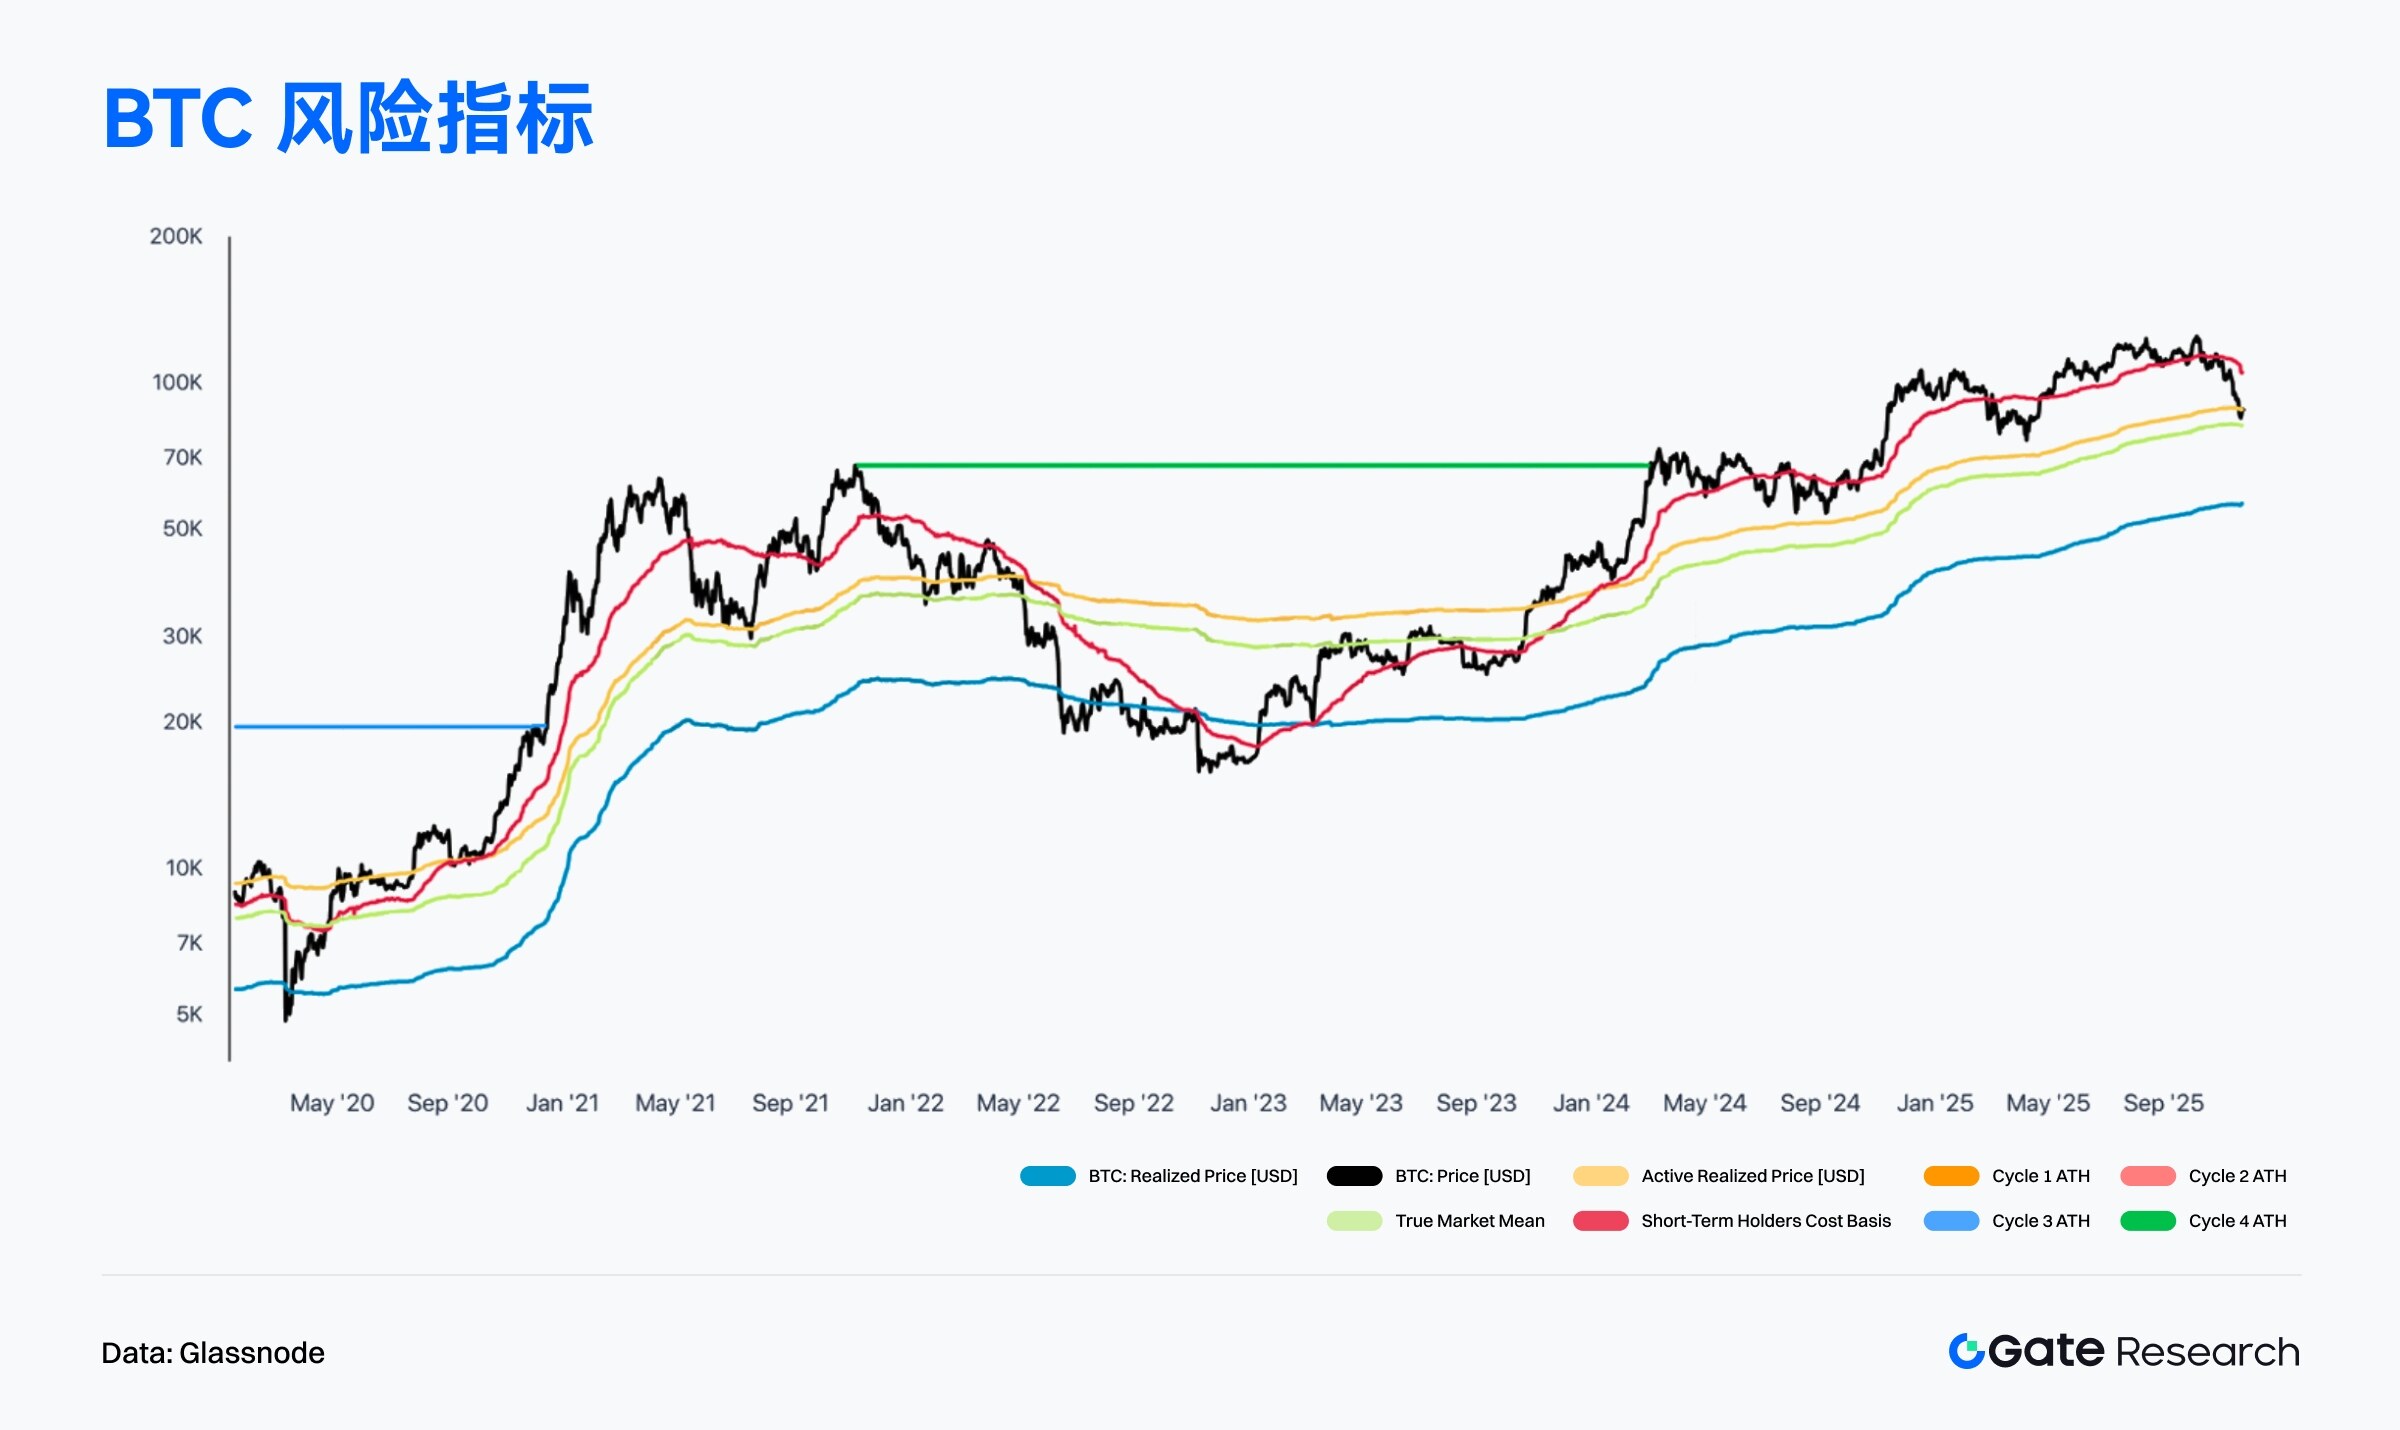
According to Glassnode data, the latest price of BTC has fallen below the Short-Term Holder Realized Price (STH Realized Price) and the Active Investor Mean, indicating that short-term funds are starting to enter a loss-making range, and market sentiment has shifted from neutral to slightly bullish to neutral to slightly bearish. The short-term support zone formed by the yellow and red cost lines from bottom to top has been effectively broken, meaning that short-term buying momentum is weakening, and the market has entered a pressure-dominated structural phase. [6]
Meanwhile, although the BTC price remains above both the Realized Price and the True Market Mean, the divergence between the two is narrowing, reflecting that market momentum is transitioning from an upward phase to a digestion and turnover cycle. If the price continues to trade below the average of active investors, short-term funds' risk appetite may continue to contract, causing the price to move closer to the market mean or the Realized Price range.
The multi-period ATH cost line remains above the current price, indicating that the long-term structure has not been broken and BTC remains within the broader framework of a bull market. However, with the short-term cost line broken, the market is more likely to evolve into a phase of high-level consolidation and a redistribution of positions. If BTC can subsequently rise back above the cost of short-term holders, it will help restore the short-term bullish structure; conversely, if it continues to hover below the cost line, the pressure for correction will further increase. Overall, the risk indicator combination shows that BTC has shifted from a neutral-to-strong to a neutral-to-weak rebalancing phase, facing short-term pressure but the medium-term trend remains intact.
BTC has recovered from its losses, and the market has entered a phase of mixed sentiment clearing and high-level pressure.
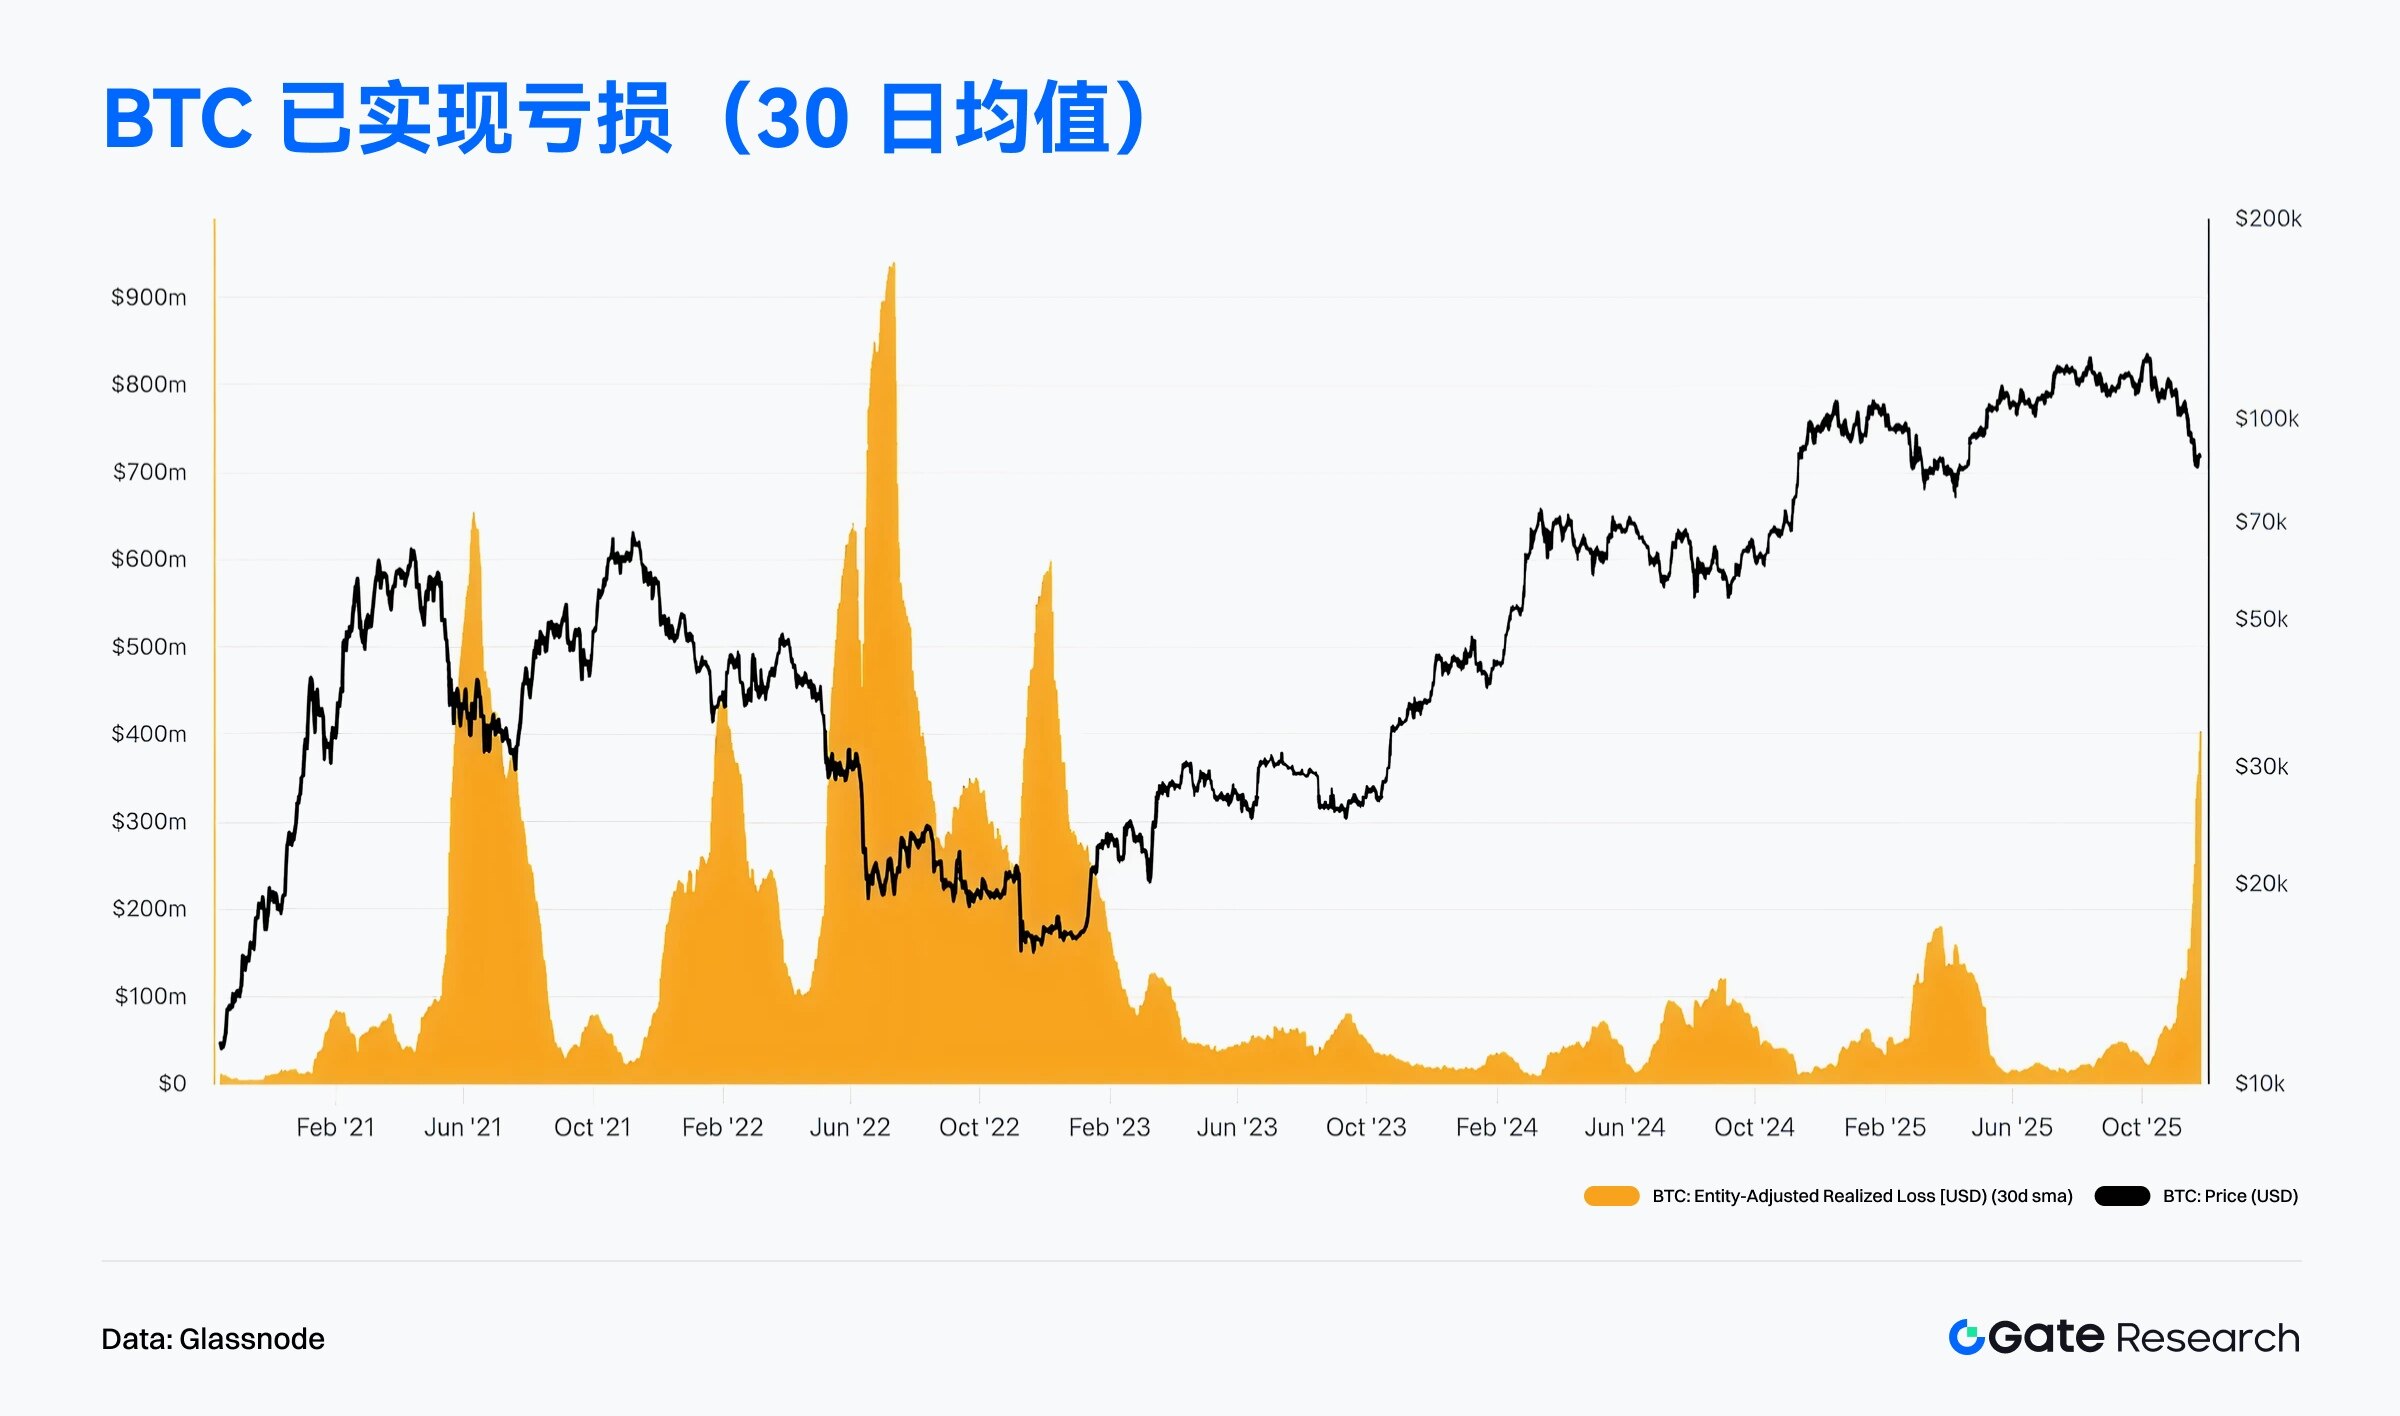
According to Glassnode data, the realized losses from entity adjustments (30-day average) increased significantly during November, showing a steep structure of rapid rise from a low level, reflecting concentrated and continuous selling losses during the recent downward price fluctuations. This trend has similar characteristics to historical high volatility periods: in the past, each large-scale loss release usually corresponds to the simultaneous occurrence of short-term holders' passive stop-loss, liquidation pressure after leverage increases, and emotional selling. Although the current loss scale has not reached the extreme peak of 2021 and 2022, it is significantly higher than the normal level of 2023-2024, indicating that the market has entered a short-term adjustment cycle, and speculative positions are undergoing an active or passive deleveraging process. [7]
While widening losses indicate short-term pressure, from a cyclical perspective, the release of losses at higher levels is essentially a correction in bullish sentiment and can be seen as a "risk absorption" phase within a price pullback. Compared to historical price action, if realized losses decline rapidly within the following 1-3 weeks, it usually signifies a short-term market turnover, and the price is likely to return to its trend structure. Conversely, if the loss indicator remains high and is accompanied by increased trading volume, it warrants caution as selling pressure could amplify, pushing BTC further back to test deeper support levels. Overall, the widening losses in November indicate increased short-term market volatility but have not disrupted the medium-term bullish trend. It appears to be a necessary correction within an upward cycle, preparing for the continuation of the trend in the next phase.
Profit margins for long-term BTC holders are declining, and the market is entering a phase of trend reshuffling and cyclical cooling.
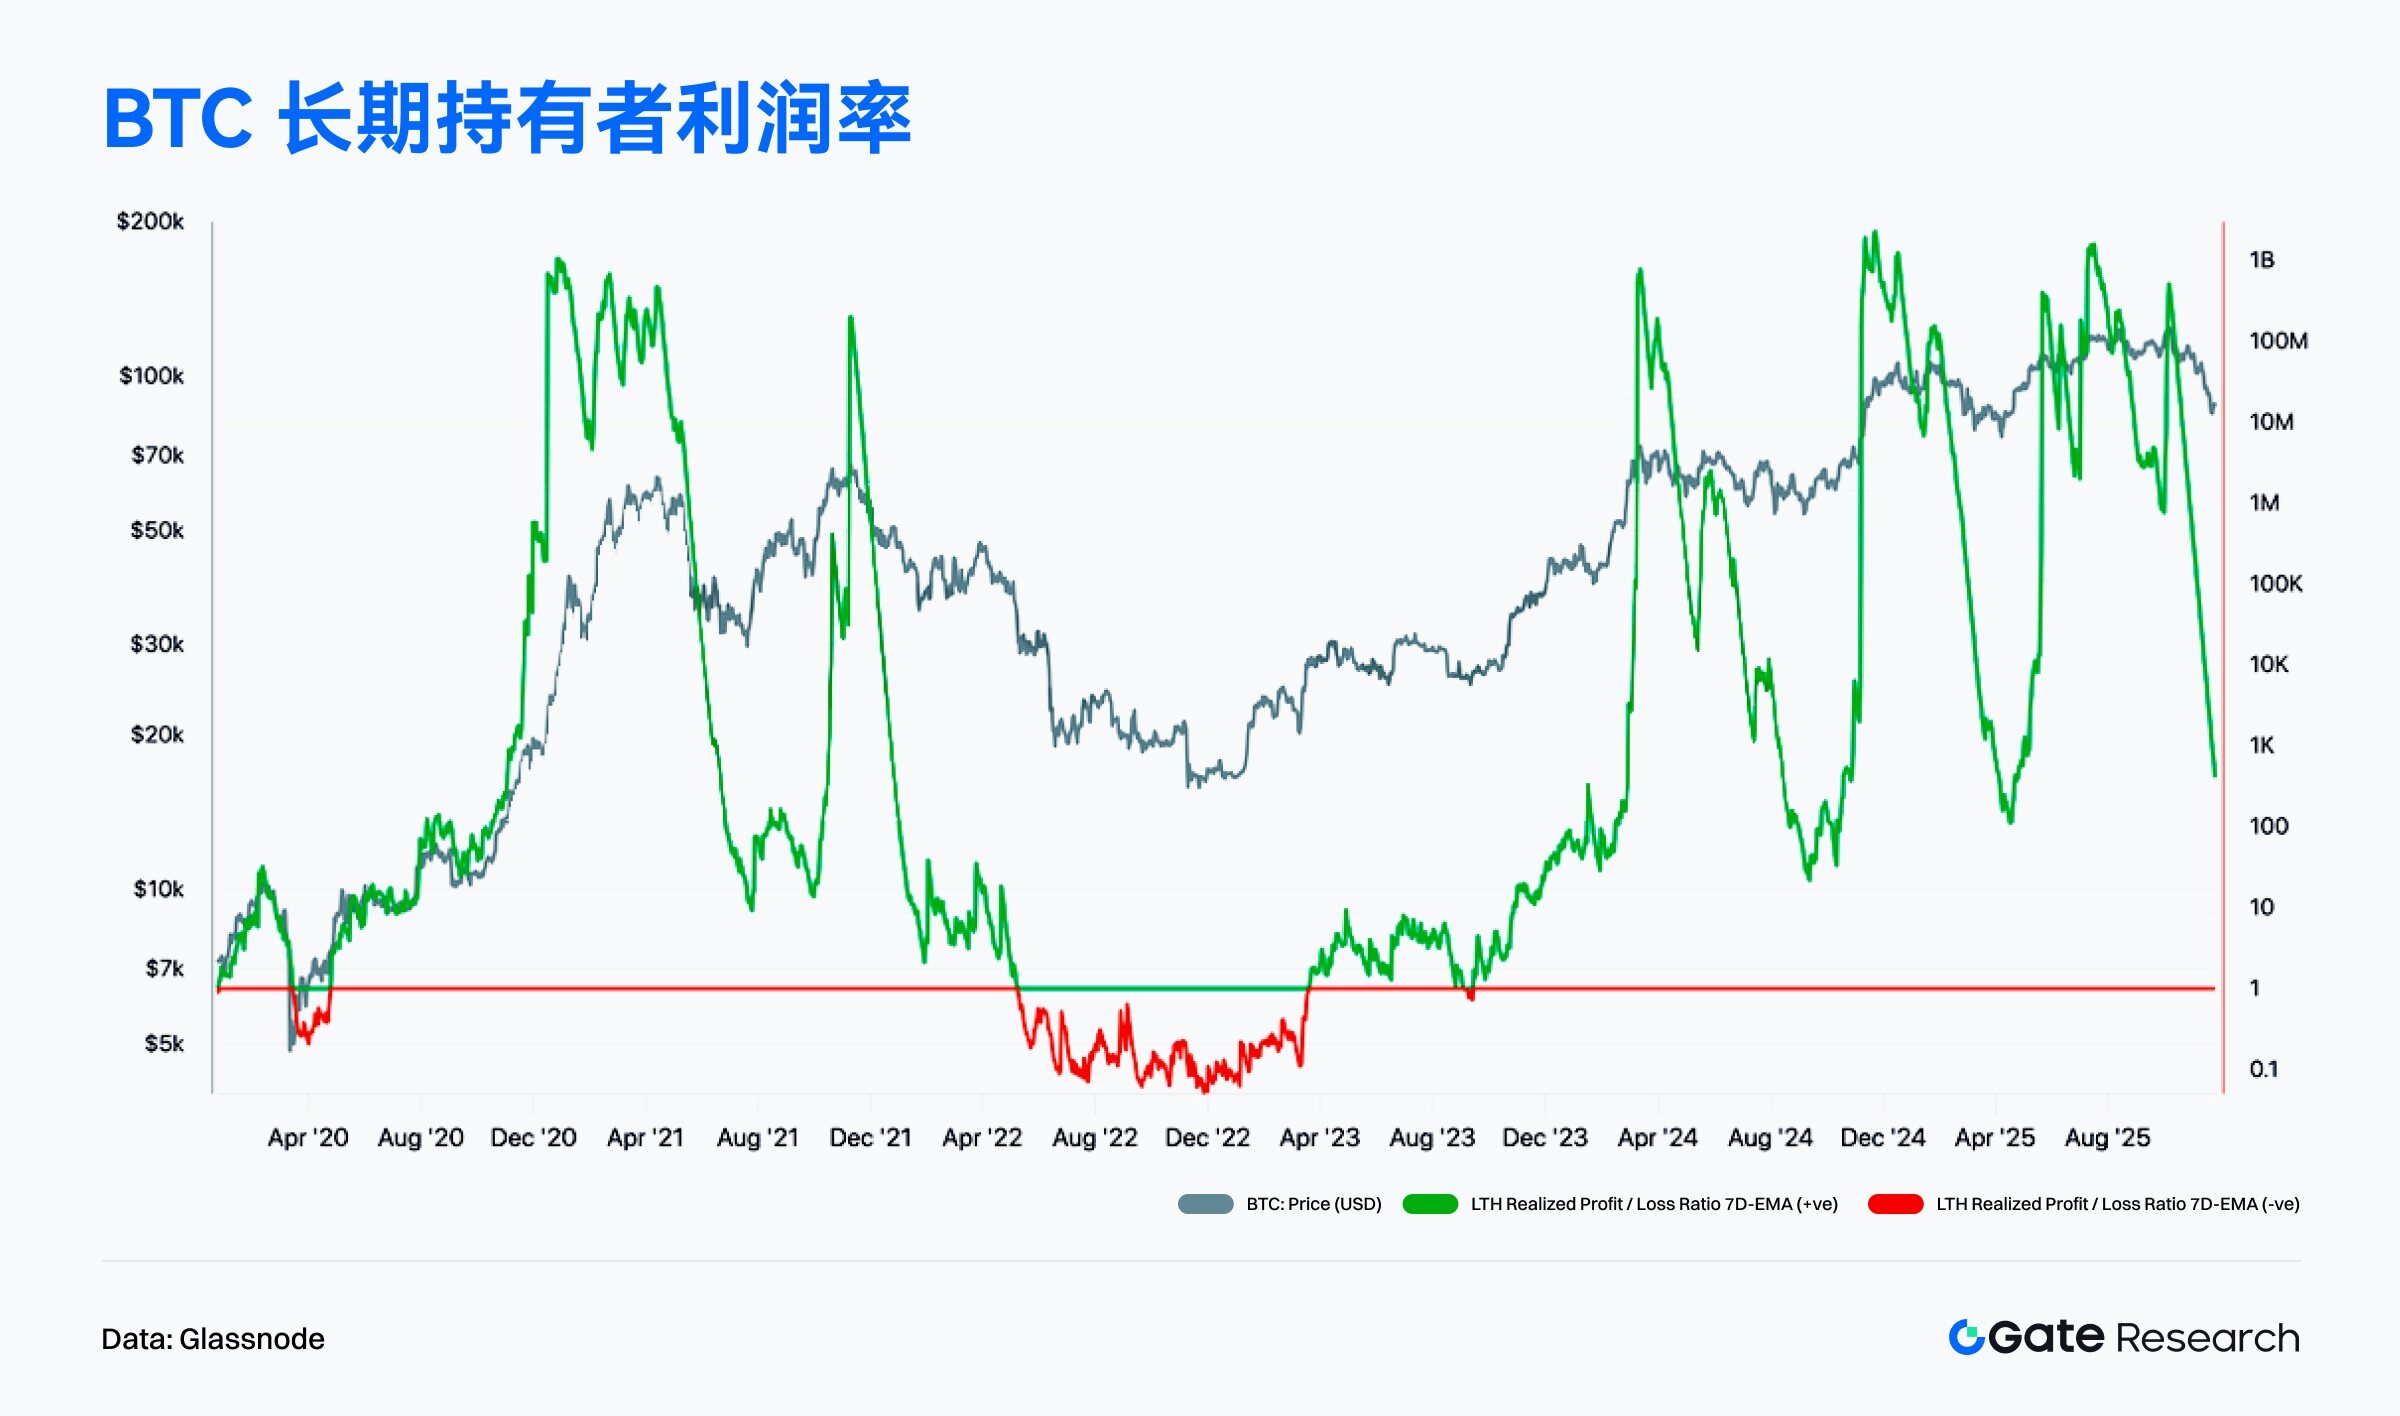
According to Glassnode data, the LTH Realized Profit/Loss Ratio showed a significant downward reversal in November, with the indicator falling sharply from its high level, reflecting a narrowing profit margin for long-term funds and some holders starting to realize profits when prices were weak. Historically, a rapid decline in this indicator has usually been accompanied by a cooling of sentiment after a cycle top, indicating that the profits of early investors are being eroded by market volatility. With prices still fluctuating at high levels, the profitability of LTH has weakened, indicating that the continuity of the strong trend is beginning to be tested, and the market has entered a mid-term correction phase of "trend turnover + profit contraction". [8]
Although the LTH profit ratio has declined significantly, it has not fallen into the loss zone (red area) typical of a bear market, as shown in the chart. This indicates that long-term funds have not experienced large-scale panic selling or loss-making pressure. Currently, the profit ratio remains above the key threshold, representing that the market's long-term profit structure remains healthy, only with a slowing marginal increase. If the ratio stabilizes and rises again, it usually means that long-term funds have completed a phase of clearing out, laying the foundation for the next trend; however, if it continues to decline and falls into the loss zone, we need to be wary of the market entering a deeper cyclical correction. Overall, the November LTH data leans more towards a cooling trend and healthy turnover than a full reversal.
Trending Projects and Token Updates
On-chain data shows that funds and users are gradually concentrating on ecosystems with interactive foundations and deep applications, while projects with buzzworthy content and technological innovation capabilities are becoming the new focus of capital investment. This article will focus on recently outstanding projects and tokens, analyzing the underlying logic and potential impact.
Overview of popular project data
Monad
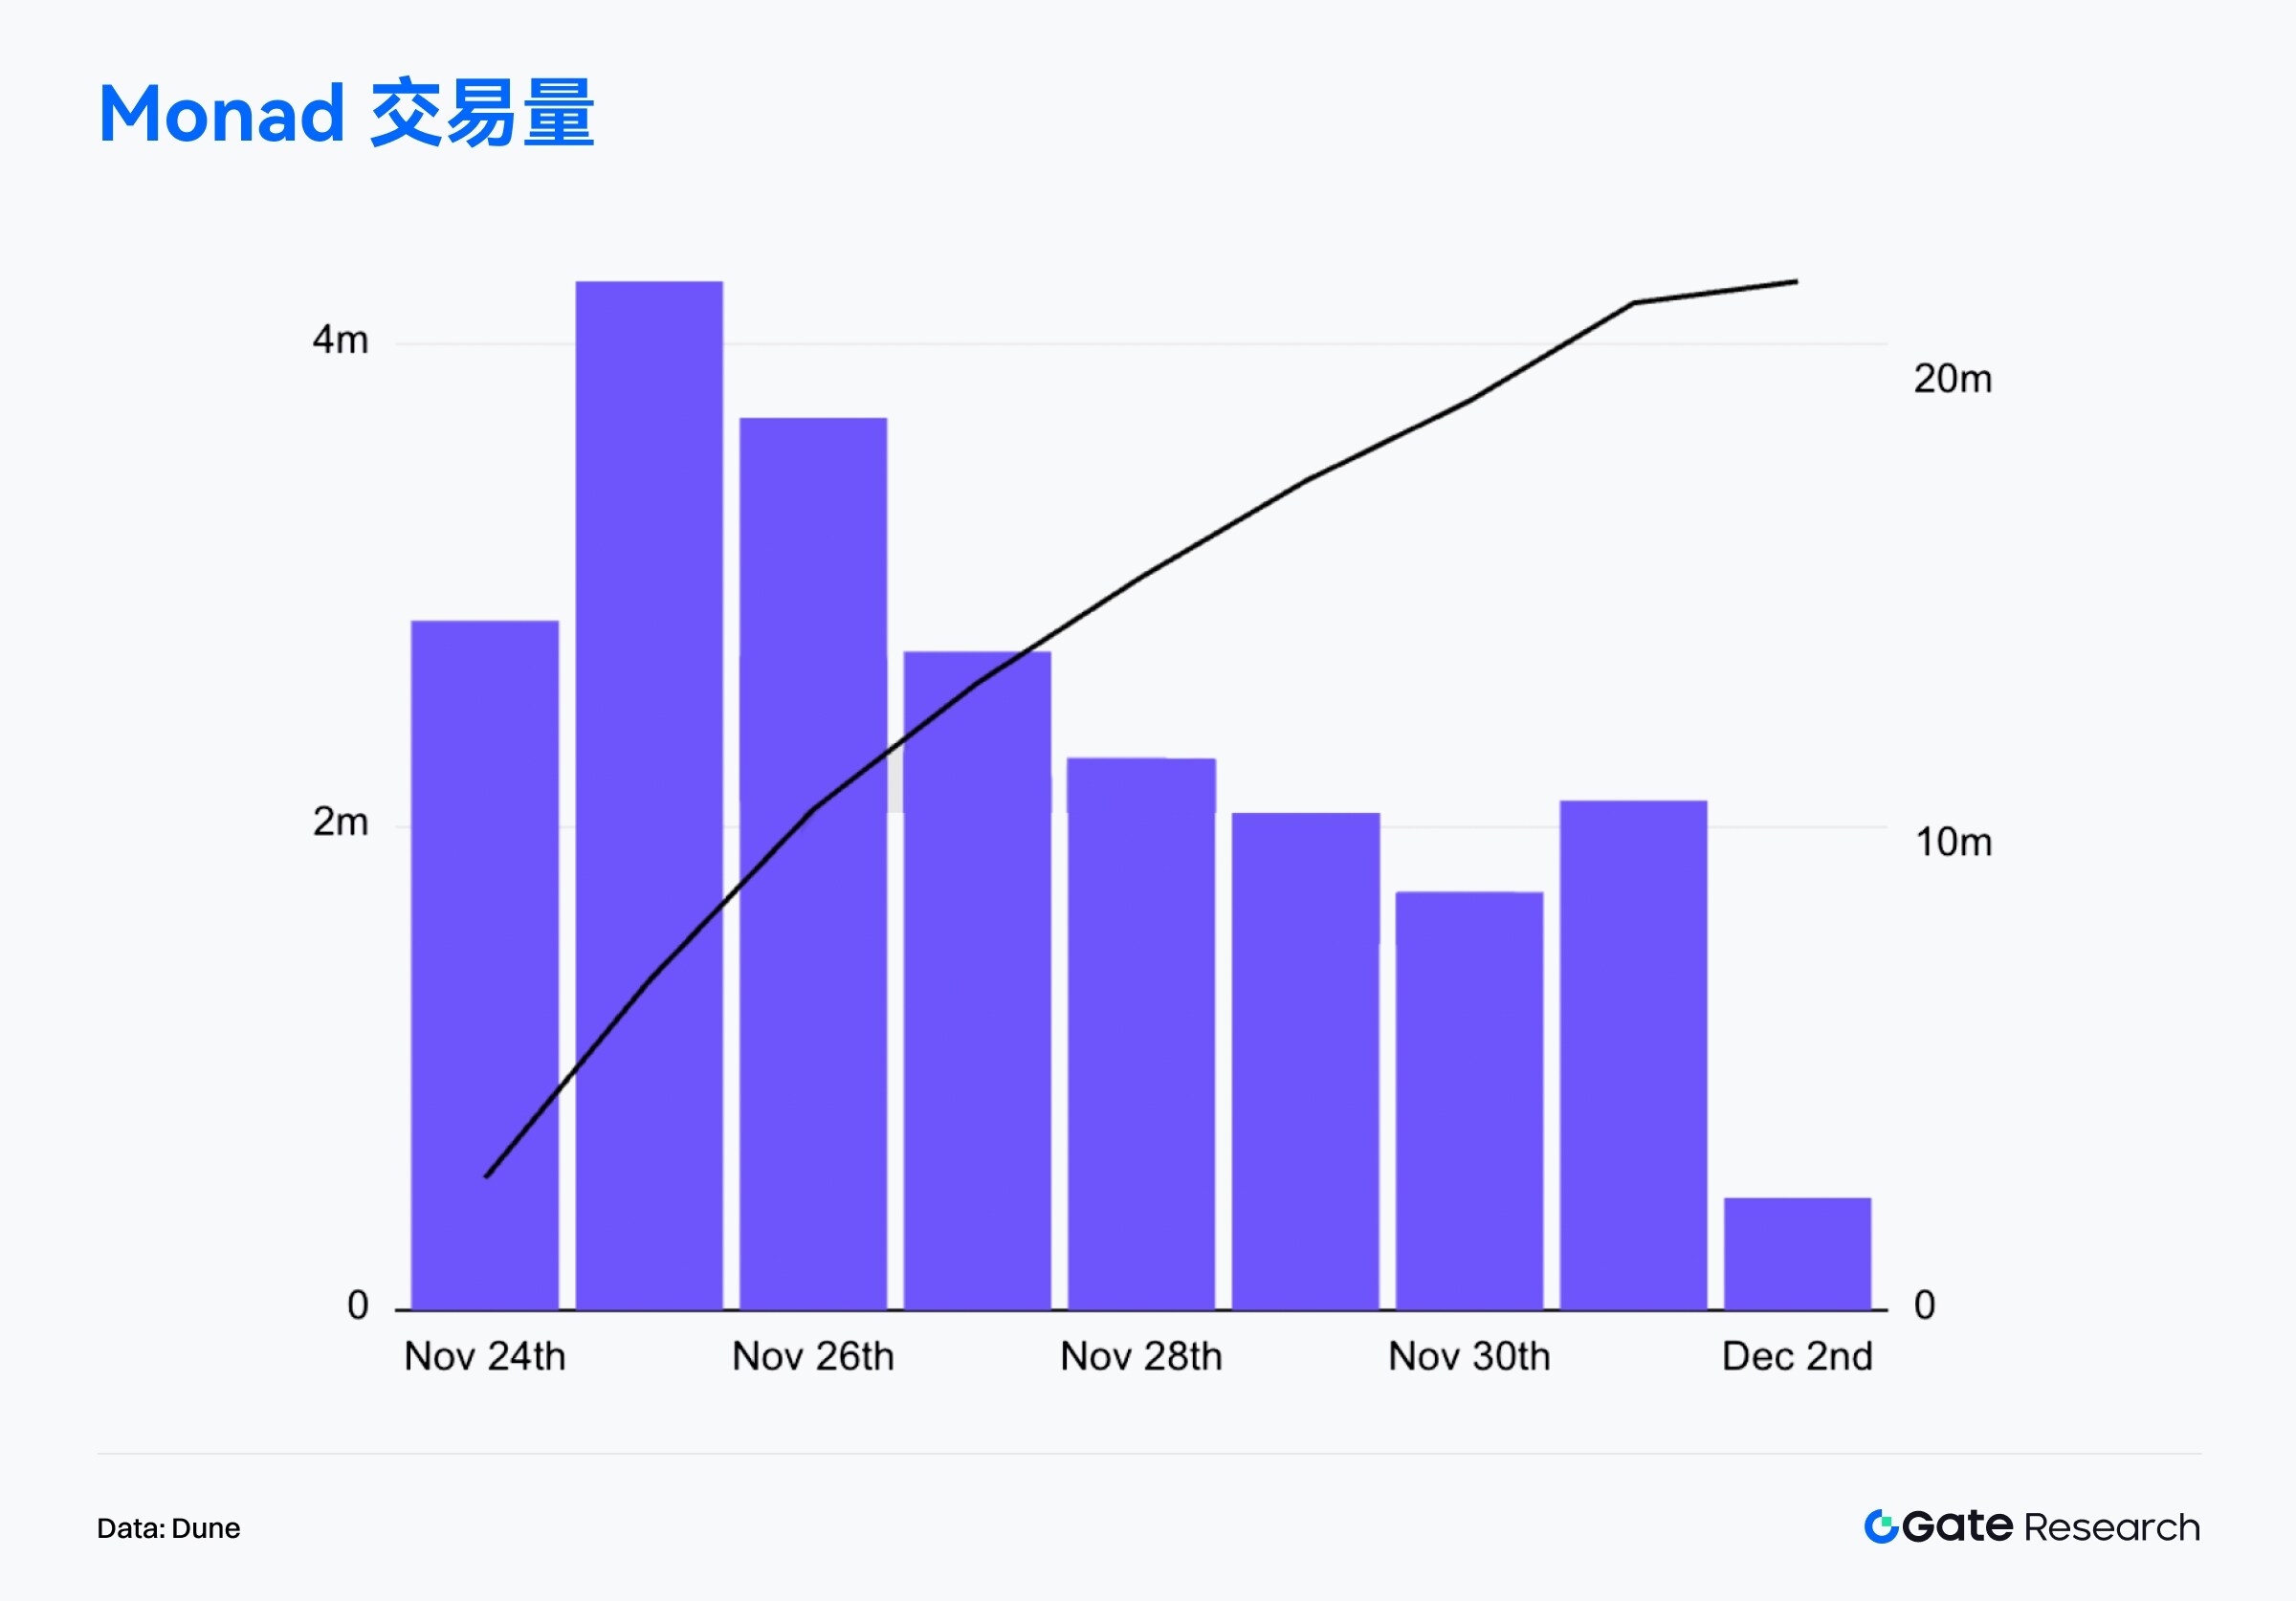
Monad is the most watched high-performance Layer 1 public chain project on the blockchain recently. It takes "single-threaded high-efficiency EVM" as its core technology path and aims to significantly improve execution efficiency and network throughput while being fully compatible with Ethereum. On November 24, Monad officially launched its mainnet and released its native token MON. At the same time, it launched a large-scale airdrop plan covering 225,000 active users on the chain. Beneficiaries include users of lending protocols such as Aave, Euler, and Morpho, users of decentralized exchanges such as Hyperliquid and Uniswap, and participants in communities and meme platforms such as Pump.fun and Virtuals, forming a broad distribution pattern across tracks and ecosystems. On the day of the mainnet launch, more than 140,000 new active addresses were added, the on-chain transaction volume exceeded 2.66 million, and the 24-hour average TPS reached 32.75, demonstrating the high activity and stable carrying capacity of the new L1 in the launch phase. [9]
In terms of price performance, MON exhibited a typical "news-driven effect" after its launch. Influenced by concentrated cash-outs from airdrops, the release of ICO shares, and high-frequency speculative forces, the token briefly surged to $0.048 at the opening before quickly falling back to around $0.022, achieving a short-term drop below its initial offering price. With the simultaneous integration of OpenSea, Pyth oracles, and multiple wallet tools, over 300 ecosystem applications became available, and on-chain measured TPS exceeded 5,000. On-chain transaction volume surged to $400 million within half a day on the first day, becoming a typical high-volatility case in the new public chain issuance cycle.
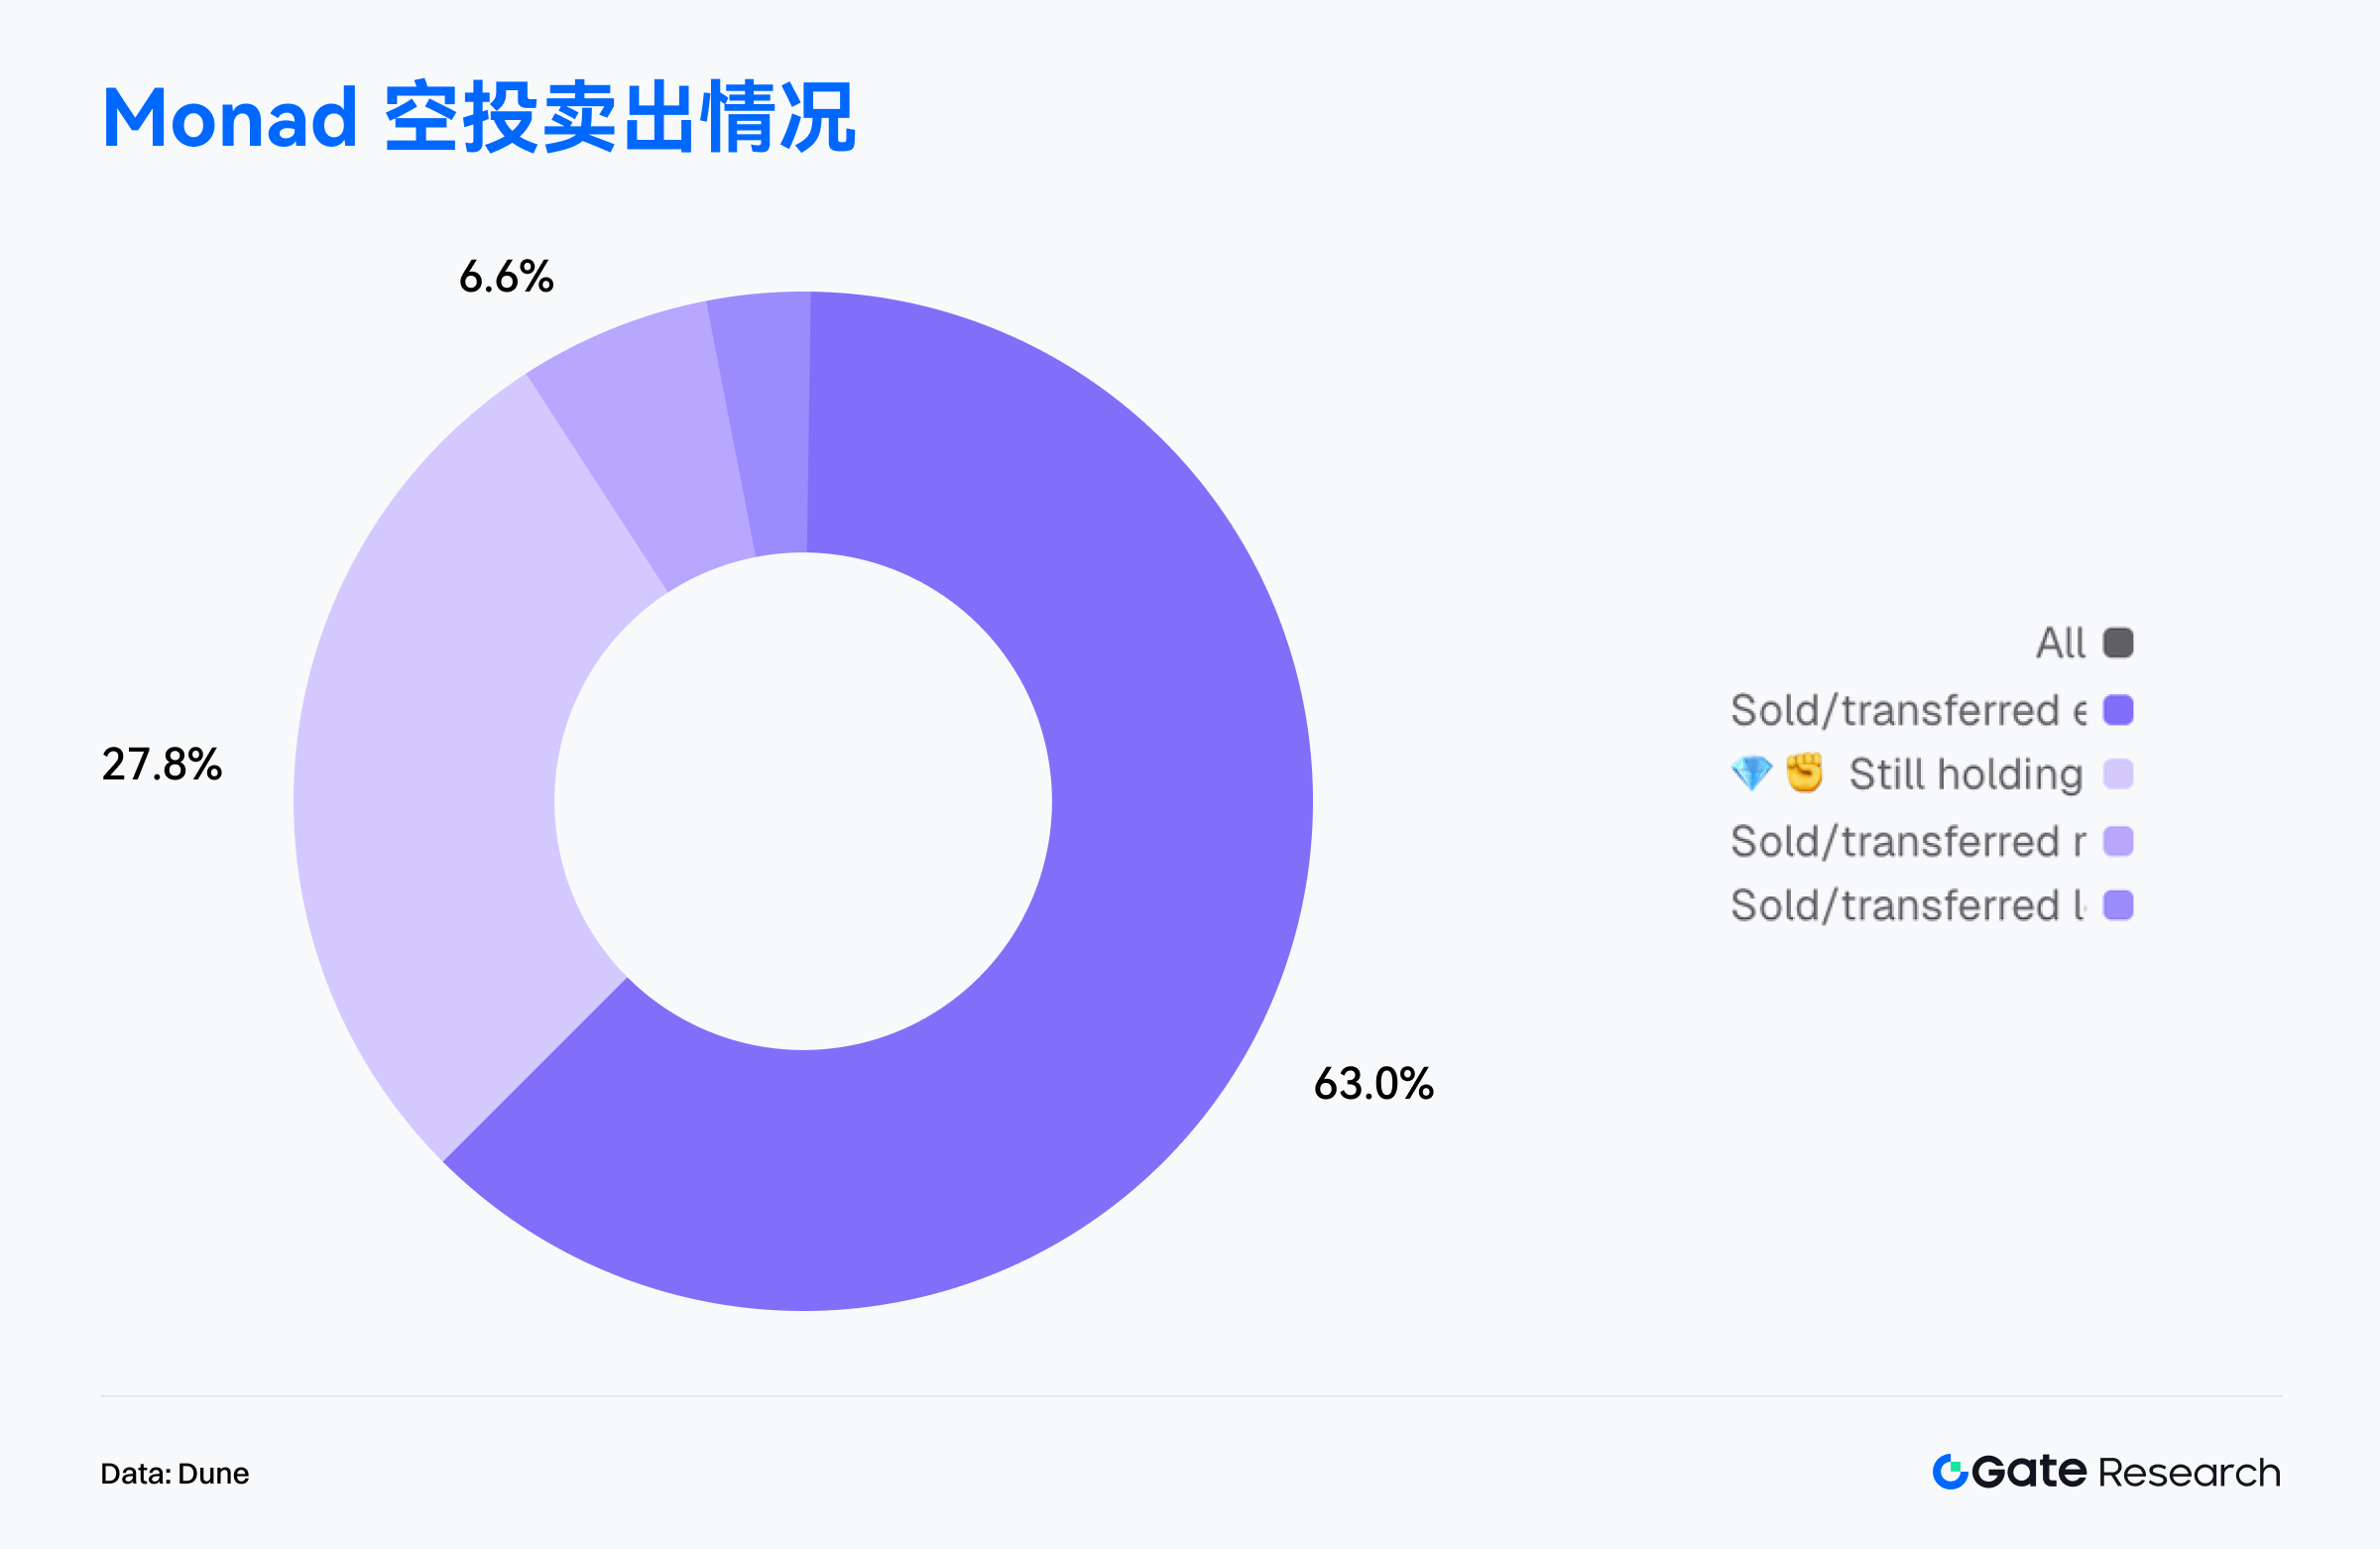
From the perspective of on-chain wallet behavior, the pressure to cash out the airdrop was clearly dominant in the early stages. Data shows that among all 76,021 addresses that completed the claim, 63% had sold or transferred all the airdrop tokens, becoming the main source of selling pressure in the market; 27.8% of users chose to continue holding their full positions, reflecting a relatively firm long-term expectation; another 6.6% of addresses sold more than half, with only a very small portion retaining a small position. Overall, the proportion of true long-term holders is less than 30%, and this highly concentrated cashing-out behavior is one of the core driving forces behind the sharp price fluctuations after MON's launch. [10]
In terms of ecosystem incentives, multiple projects have simultaneously launched MON staking and yield activities to enhance liquidity and user stickiness. FastLane Labs launched shMON minting staking, with over 122 million MON already staked; Magma offers gMON liquidity staking with an annualized return of approximately 15%. Meanwhile, game and application ecosystems have also launched initiatives, such as Lumiterra launching a 1 million MON season prize pool, and Kuru DEX launching a 25% platform fee reward program, driving continuous growth in user activity within the ecosystem.
Overall, Monad's market performance follows a typical launch curve for a new L1 blockchain: technological innovation and high expectations fueled initial hype, while airdrops and early liquidity releases put short-term price pressure; on-chain activity, ecosystem incentives, and staking demand provided support for medium-term network development. Future TVL growth, developer migration, and ecosystem expansion will be key indicators for measuring MON's medium-term price performance and long-term network competitiveness, marking the official start of a new round of competition in the high-performance public blockchain landscape.
Overview of popular token data
$TEL
Telcoin is a multinational fintech project founded in 2017, focusing on integrating blockchain technology, telecommunications networks, and digital banking services to provide global mobile users with low-cost, instant, and inclusive cross-border remittance and digital asset services. The project is managed by the Swiss non-profit organization Telcoin Association, operates the EVM-compatible Telcoin Network, and its security is jointly maintained by global mobile operators through a Proof-of-Stake (PoS) mechanism. Its ecosystem includes the multi-signature digital banking application Telcoin Wallet, and the compliant digital bank Telcoin Bank, which is currently under development, aiming to build a global infrastructure for "mobile users to directly access on-chain finance."
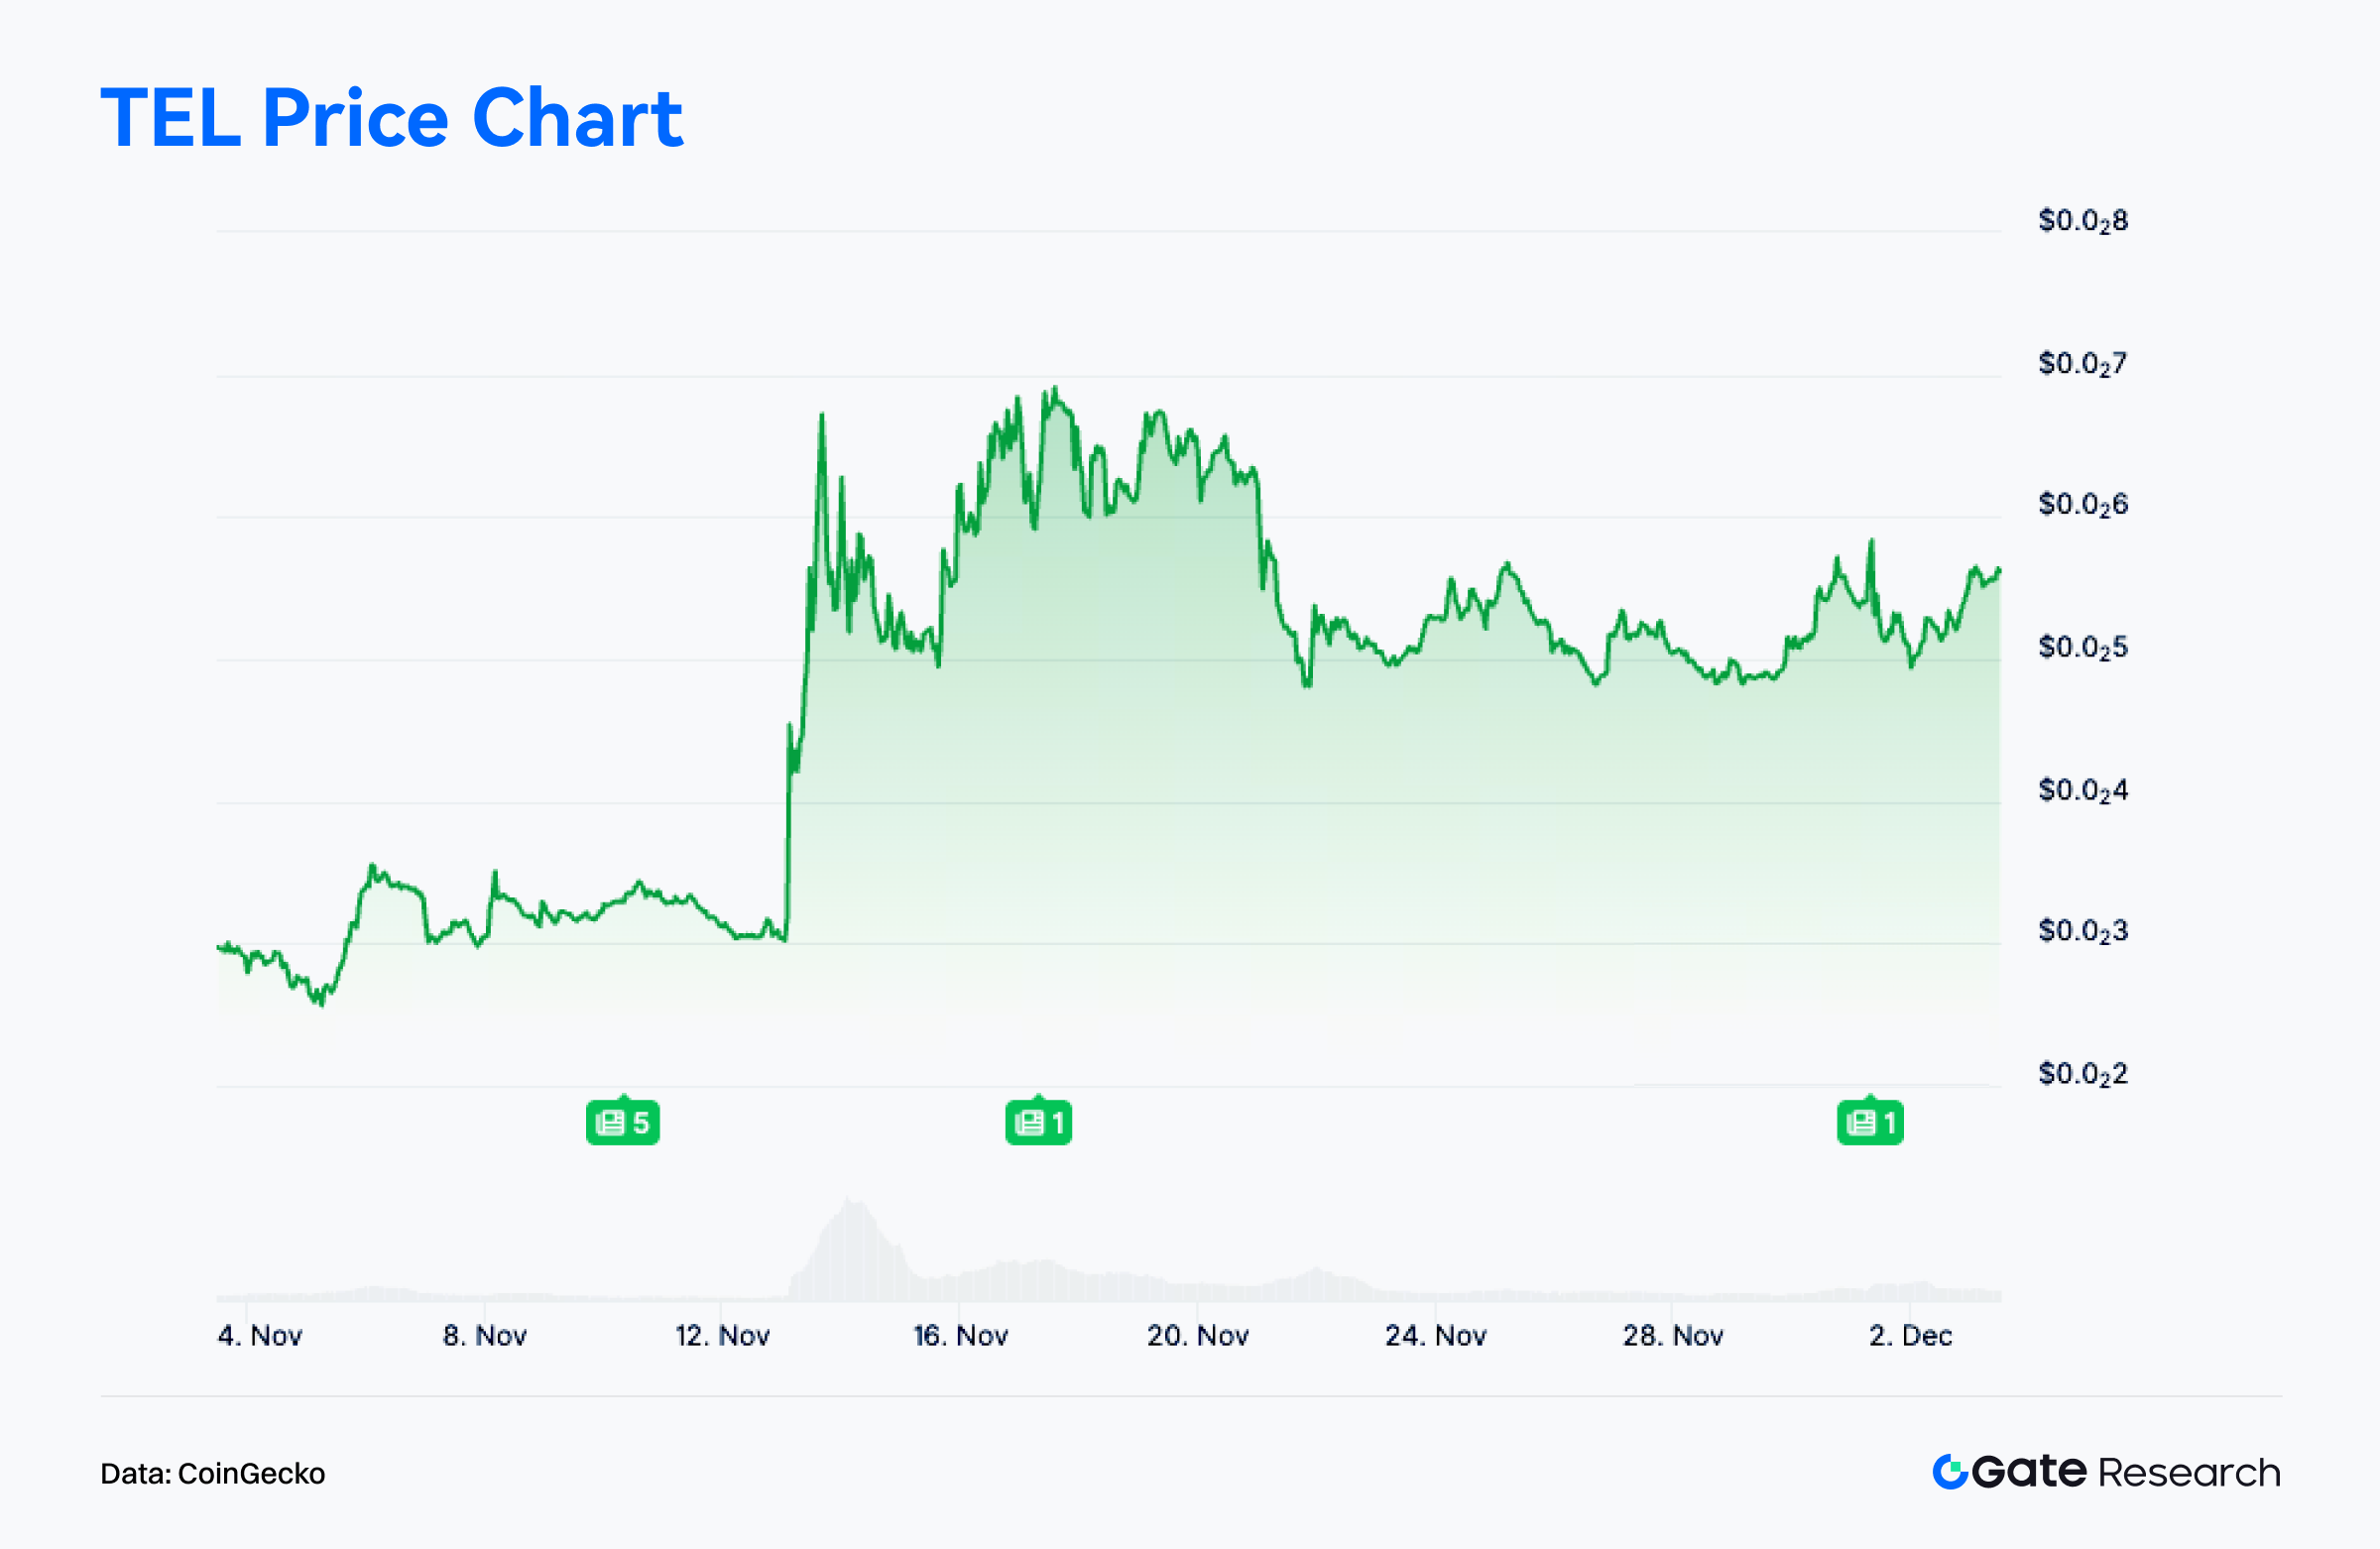
According to CoinGecko data, $TEL has risen by 88.9% in the past 30 days. This strong performance this month is closely related to the rising narratives surrounding "compliant finance," "on-chain USD," and "stablecoin regulation," causing funds to flow back from speculative sectors to projects with solid fundamentals. [11]
Regarding project progress, Telcoin announced that its digital banking business and compliant stablecoin eUSD have entered the formal deployment phase, positioned as a combination architecture of "bank-grade stablecoin + mobile-to-on-chain finance". eUSD will be issued and minted on-chain by a regulated banking entity, becoming one of the first on-chain stablecoins directly issued by traditional financial institutions. This development enables Telcoin to simultaneously possess a complete on-chain financial closed loop with digital banking capabilities, stablecoin issuance rights, and open DeFi access, changing the project's business model and long-term positioning, prompting a significant revaluation of its value by the market.
At the community and media level, following the announcement of key developments, Telcoin saw a significant surge in discussion on X, Telegram, and Reddit. Crypto media generally viewed it as a "model case of the integration of banking and on-chain finance," incorporating it into broader narratives such as "competition among new stablecoins," "traditional financial institutions going on-chain," and "mobile crypto banking." Community sentiment was consistently optimistic, creating a positive cycle of "enhanced narrative → increased attention → increased liquidity," further strengthening the upward trend with short-term capital inflows.
Overall, $TEL's rise this month is a typical example of a market structure driven by "fundamental breakthrough + strengthened compliance narrative + market sentiment resonance." The advancement of digital banking services and the eUSD stablecoin has been a decisive positive factor, elevating Telcoin from a cross-border payment project to a comprehensive infrastructure combining "bank-grade stablecoin + on-chain financial interface layer." If related products are successfully launched and the compliance financial narrative continues to generate momentum, $TEL still has the potential for a sustained medium-term upward trend after its rapid rise.
Summarize
In November 2025, Solana maintained its leading position in overall chain activity and transaction volume thanks to its high-frequency applications and strong user stickiness, demonstrating its resilience through market fluctuations. Ethereum continued to serve as the core main chain for value settlement, maintaining an absolute lead in transaction fee revenue, with on-chain economic activities still primarily focused on high-value interactions. Base and Polygon PoS steadily expanded in the mid-range segment, demonstrating continued growth momentum in social applications and consumer-level interactions, respectively. In contrast, while Arbitrum's transaction volume and active addresses remained low and volatile, its fund flows indicated advantages in asset tokenization, infrastructure development, and institutionalization, making it a key beneficiary of this round of capital preference. Meanwhile, emerging public chains such as Starknet rapidly accumulated momentum driven by the BTCFi narrative, exhibiting significant user growth and capital attraction.
Overall, the on-chain ecosystem is shifting from simple capital flows to a new phase driven by real-world usage demands, application growth paths, and narrative diffusion. High-performance public chains continue to dominate interaction traffic, value-based main chains are consolidating their foundational role, while medium-sized and emerging ecosystems with application growth potential and narrative space are becoming the focus of capital repricing. The on-chain growth structure is steadily progressing towards multipolarity and stratification.
Regarding Bitcoin, as the price fell below the cost basis of short-term holders and the average value of active investors, high-level holdings began a more pronounced redistribution phase, indicating that the short-term structure has shifted from strong to under pressure. The true price and market average below still provide medium- to long-term support, keeping the overall bullish framework intact; however, the short-term drop below the cost line means some funds are entering a loss-making phase, and this loss-driven turnover is accelerating, indicating the market is entering a weaker "repricing-rebalancing" transition phase. Currently, bullish and bearish forces are re-entering a key range, and the subsequent trend will depend on whether the upward selling pressure can be effectively absorbed and new incremental demand can be generated after sentiment subsides.
At the project level, the emerging high-performance public chain Monad demonstrated strong interactivity and rapid growth potential from the initial mainnet launch, although the airdrop redemption put short-term pressure on its price. Telcoin, on the other hand, has successfully transitioned from a cross-border payment project to a representative of on-chain financial infrastructure due to the advancement of digital banking and compliant stablecoins, with its narrative and fundamentals resonating to drive a significant revaluation. The overall trend shows that the market is shifting from pure speculation to focusing on real-world use and sustainable ecosystem growth.
References:
1. Artemis, https://app.artemisanalytics.com/chains
2. Artemis, https://app.artemisanalytics.com/chains
3. Artemis, https://app.artemisanalytics.com/chains
4. Artemis, https://app.artemisanalytics.com/flows
5. DefiLlama, https://defillama.com/chain/arbitrum
6. Glassnode, https://studio.glassnode.com/charts/da73676e-78a6-4880-5ca2-a227ee301230?s=1579395107&zoom=
7. Glassnode, https://studio.glassnode.com/charts/indicators.RealizedLossAccountBased?a=BTC&chartStyle=column&mAvg=30&s=1602806400&u=1764115200&zoom=
8. Glassnode, https://studio.glassnode.com/charts/btc-lth-realized-plratio?s=1577318400&u=1764115200&zoom=
9. Dune, https://dune.com/hashed_official/monad-overview
10. Dune, https://dune.com/counterparty_research/monad
11. CoinGecko, https://www.coingecko.com/coins/telcoin
Gate Research is a comprehensive blockchain and cryptocurrency research platform that provides readers with in-depth content, including technical analysis, insights into hot topics, market reviews, industry research, trend forecasts, and macroeconomic policy analysis.
Disclaimer
Investing in the cryptocurrency market involves high risks. Users are advised to conduct independent research and fully understand the nature of any assets and products they intend to purchase before making any investment decisions. Gate assumes no responsibility for any loss or damage arising from such investment decisions.


