
Learn about market indicators commonly used when investing in cryptocurrencies
This article comes fromnansen.aiThis article comes from

, the original author: Yuffie • ユフィ, compiled by Odaily translator Katie Ku.
Read this article as we explore commonly used indicators for cryptocurrencies and how they can be used to understand the current state of interest rates or sentiment in the broader cryptocurrency market.
secondary title
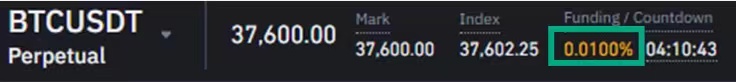
(1) Funding Rates
If you used leverage on an exchange through perpetual contracts before, you will usually see a word "funding rate" at the top of the exchange page.
The funding rate is paid periodically, displayed as a percentage, usually quoted at an 8-hour rate, and paid to long or short traders based on the difference between the spot price and the perpetual contract market.
(Translator's Note: Perpetual contracts are the most liquid derivatives of digital currency, and they are also a battleground for military strategists in the currency circle. This is a digital currency derivative that is similar to futures but never expires and has no delivery. )
Taking Binance Futures as an example, the funding rate is often displayed in an 8-hour rate.
Traders use these contracts to gain leveraged exposure (the position of a position affected by leverage) of a specific token because they only need to put up a small portion of the total contract value as collateral.
Different from traditional futures contracts, the futures price will eventually converge with the contract price at the time of settlement, and the perpetual contract uses the funding rate to ensure that the price of the perpetual contract and the spot price are on the same level.
Another easy way to think about funding rates is to think of them as payments to arbitrageurs to ensure that the perpetual price is about the same as the underlying spot price (essentially paying the difference between the two prices).
But when the volatility is high, the perpetual price may deviate from the underlying spot price. Funding rates can be either positive or negative depending on the impact of the deviation.
➕When the perpetual price is higher than the spot price (i.e. futures premium), there will be a positive funding rate, market participants are bullish, and long traders will have to pay for short positions.
➖When the perpetual price is lower than the spot price (i.e., backwardation), there will be a negative funding rate, market participants are bearish, and short traders will have to pay for long positions.
(Odaily Note: Contango is a situation in which the futures price of a commodity is higher than the spot price. In all futures trading markets, when the contract is close to expiration, the futures price will usually be close to the spot price. Advanced traders can use the futures contango strategy to carry out arbitrage.
Backedation is the opposite of backwardation, and backwardation is sometimes confused with an inverse futures market. Essentially, the futures market expects higher prices over longer periods of time, and lower prices when you "converge" on the current spot price. )
Funding rates usually consist of two parts: the interest rate and the premium. The interest rate is generally fixed at 0.01% of each financing interval (usually every 8 hours), and the premium depends on the difference between the spot price and the spot price.
How do they correlate with market sentiment? Funding rates tend to align with the general trend of the underlying asset, i.e., funding rates tend to be positive and rising as the price of the underlying asset increases.

BTC price and BTC pre-funding rate table
secondary title
(2) Open Interest (Open Interest)
Another way to measure the interest rate in the cryptocurrency market is to look at indicators based on trading volume; for example, we can look at data such as how many contracts are traded in the market.
One of the more popular volume-based indicators, open interest is the total amount of open interest (both long and short) held by market participants at any given point in time.
In other words, open interest is basically the sum of all longs and shorts minus closed trades.
Why is open interest so important?
Because it is an overall indicator of capital inflows into the market. As more capital flows, the number of open interest increases and vice versa. For this reason, it is also used as an indicator of market sentiment.
For example, if an asset's price rises in tandem with its open interest, it could indicate bullish sentiment. On the other hand, if prices are rising but open interest is falling, it could mean that market sentiment is bearish and price action is weakening.
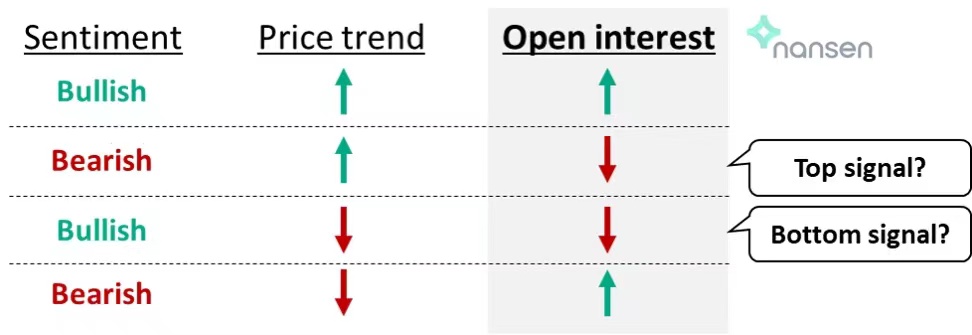
Potential implications for market sentiment using price and open interest trends
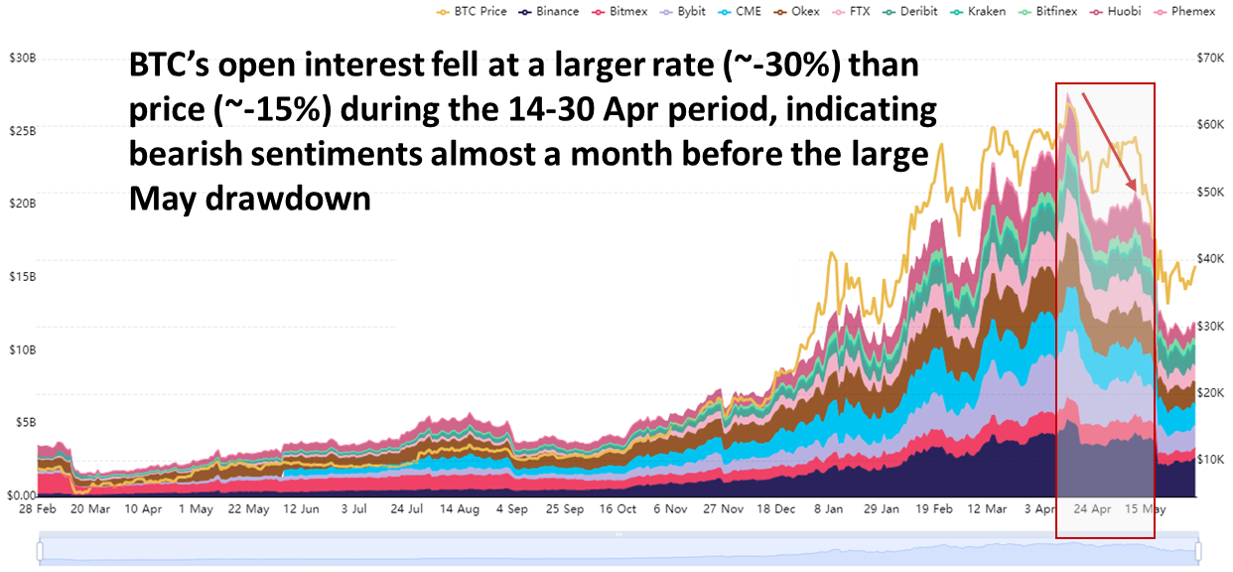
Exchange BTC holdings, chart from bybt.com
secondary title
(3) Stable currency circulation
In the event of a market sell-off, investors expecting their cryptocurrency investments to decline in value may turn to stablecoins as a safe haven while allowing them to quickly and flexibly deploy capital back into the cryptocurrency market with ease.
For example, daily on-chain transaction volumes for stablecoins were on an upward trend until May 19, when they then spiked.
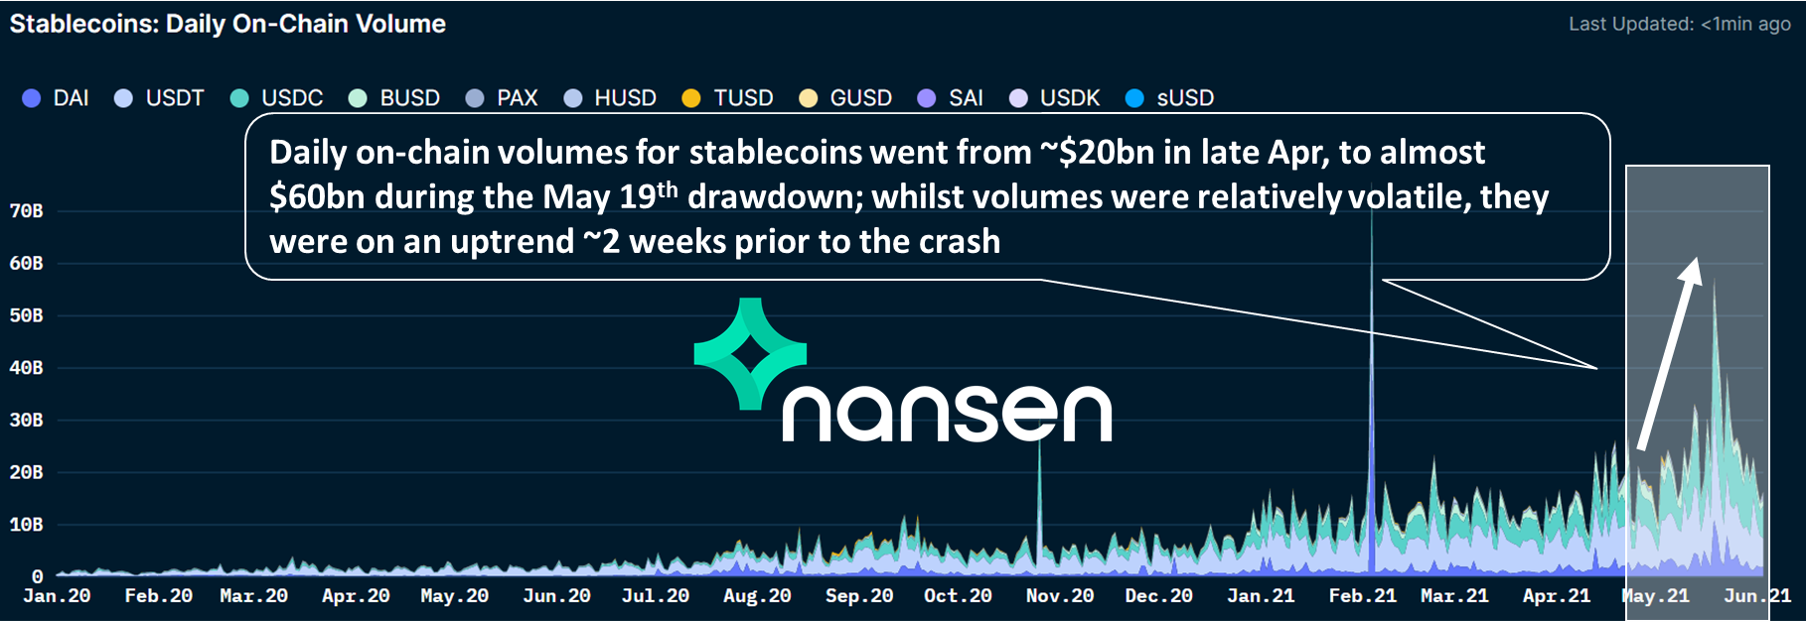
image description
On the other hand, a rapidly increasing stablecoin supply (measured by market capitalization) relative to total cryptocurrency market capitalization could be a signal of a bottom after a market decline, as it could mean an easy flow back into crypto assets.
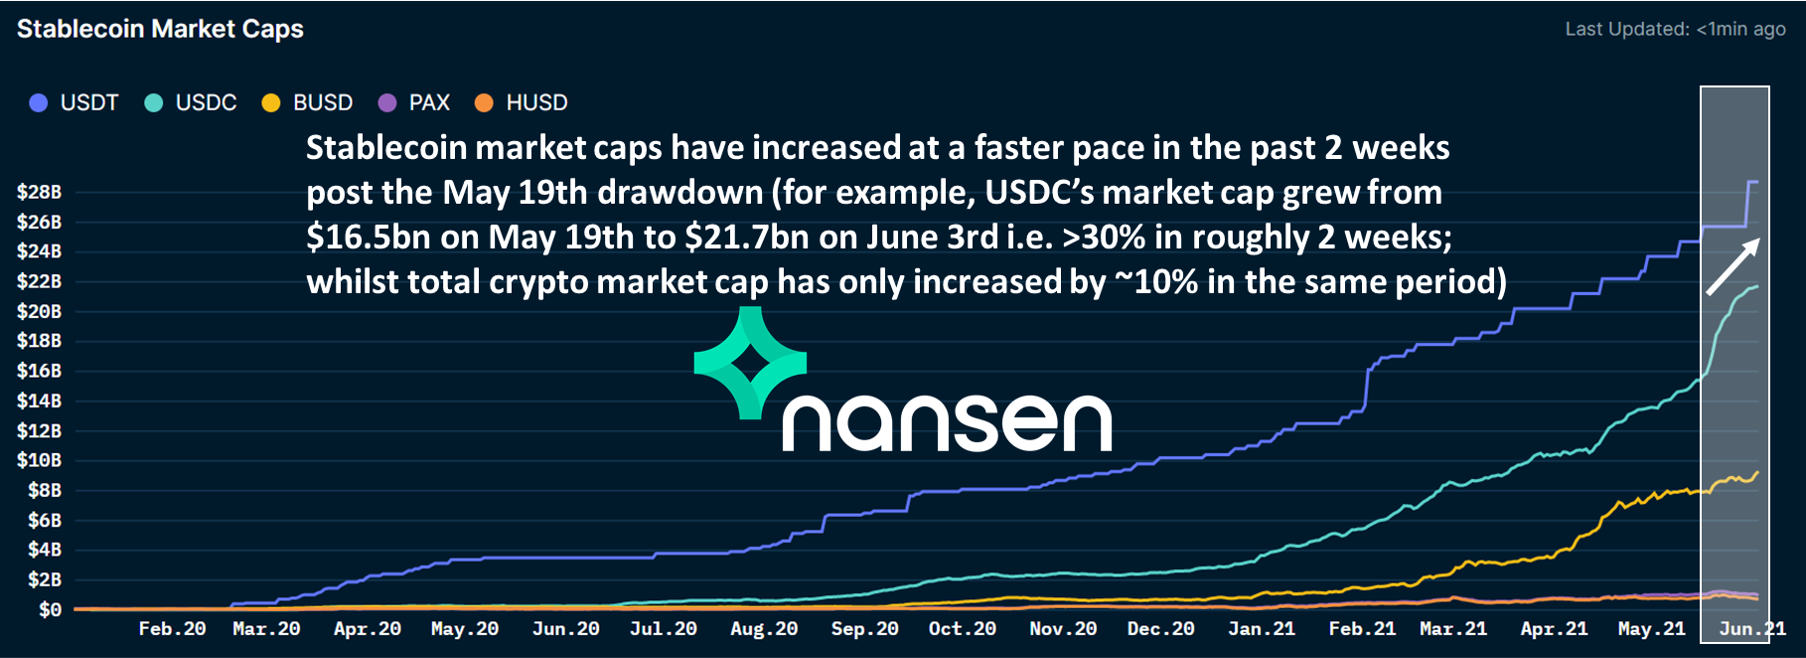
Stablecoin market cap, chart from Nansen
secondary title
(4) Exchange inflow/outflow volume
Net volume is a metric that shows this trend; it measures the net amount of tokens moving in and out of exchanges. If there is a sudden increase in the net flow of a particular token into an exchange, it could mean that participants are trying to exit that asset by selling them on the exchange, or vice versa.

image description
For the same reason, one can also view the balance change of a particular token held on an exchange through Nansen's Token God Mode to assess whether a participant is trying to exit (a positive balance change when selling tokens to an exchange) or enter (Negative balance changes as they buy tokens from exchanges).
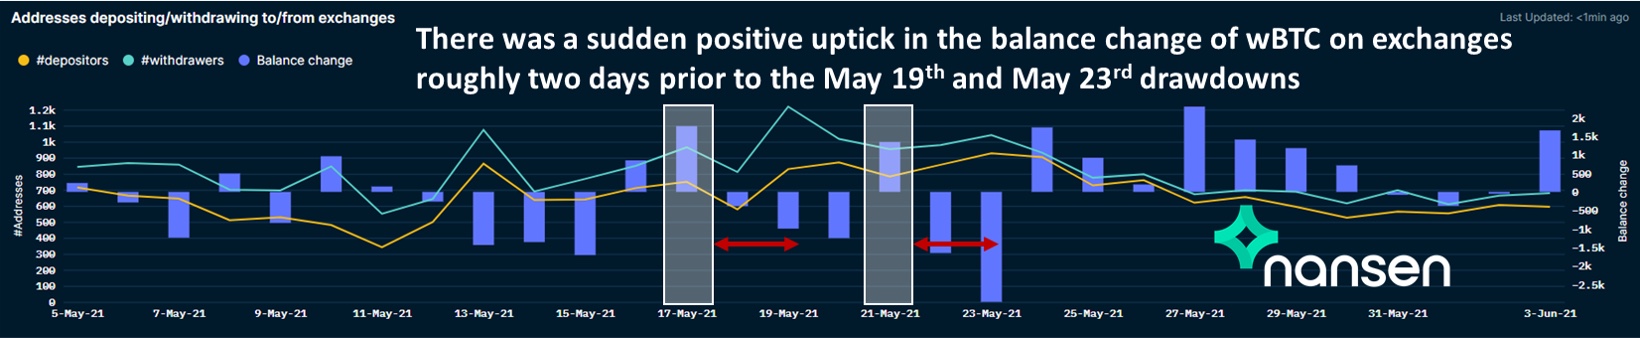
The balance change of WBTC on the exchange, taken from Nansen's Token God Mode (Nansen)
secondary title
(5) Fear and Greed Index
A popular indicator for gauging the level of sentiment in the cryptocurrency market is the Crypto Fear and Greed Index. In most markets, the actions of participants tend to be emotional. Market participants tend to become overly greedy when prices are rising, and they also tend to be overly fearful when prices are falling, and irrationally sell positions at losses.
The Fear and Greed Index is an index that tracks the current sentiment in the Bitcoin market across several dimensions, namely:
Volatility: Measures current volatility and maximum. The decline in BTC relative to the average over the past 30 and 90 days;
Market Momentum/Volume: Measures current volume and market momentum relative to the past 30-day and 90-day averages (a measure of market overreaction);
Social media: posts using the Bitcoin hashtag and their interaction rates;
Bitcoin dominance: rises in dominance are often driven by fear/dumping of high-risk altcoins;
Google Trends: Bitcoin Positive/Negative Search Volume.
Historically, the fear and greed index has been a good indicator of market bottoms; for example, during the bottom of the 18-19 bear market and the bottom of the COVID-19 crash, the index hovered in the 10-20 extreme fear range for about 3-4 weeks .
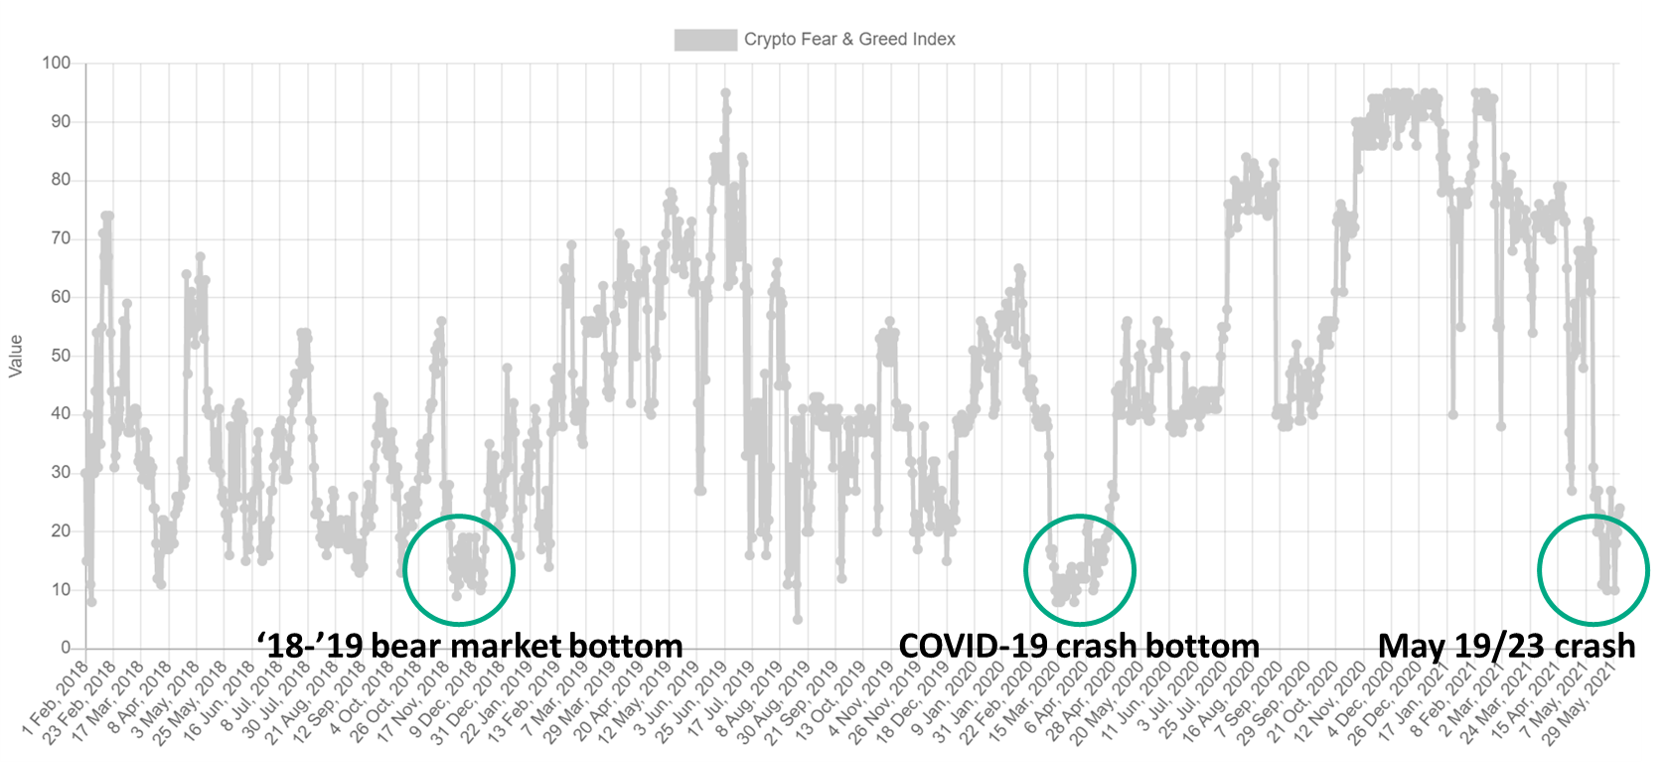
image description
Crypto Fear and Greed Index, via alternative.me
Keep these indicators in mind the next time you try to analyze the cryptocurrency market and gauge sentiment, as they may provide you with useful insights!


