
Bitcoin的五段式調整步入尾聲,HYPE支撐區現機會 | 特邀分析
- 核心觀點:本週BTC處於五段式調整尾段,端點44的位置決定短期方向;HYPE同步運行五段式調整,端點56若高於前低則反彈機率大。兩幣種均提供基於結構分析的A/B/C操作預案。
- 關鍵要素:
- BTC端點44若高於58,110美元則反彈機率大,低於且無底背離則需警惕破位;量化模型傾向於前兩種情景發生。
- BTC中線倉位維持20%空頭,短線保留30%倉位依據支撐/壓力位做價差,具體操作按A/B/C三套預案執行。
- HYPE端點56若高於端點54形成雙底,反彈機率顯著;支撐區域(58.8美元或52-54美元)企穩後可輕倉試多,倉位控制30%以下。
- 上週BTC短線交易執行兩次空單操作(1倍槓桿),依據自建量化模型訊號,成功獲利約6.21%。
- BTC核心壓力位60,900-62,300美元,第一支撐位58,100美元;HYPE第一壓力位65.5美元,第一支撐位58.5美元。
This week, BTC is in the final stage of a five-wave corrective structure. The formation position of "Endpoint 44" will determine the short-term direction—if it is above 58,110, the probability of a rebound is high; if it is below without a hidden bullish divergence, caution is needed for a potential breakdown. We have preset three sets of operational plans (A/B/C), maintaining a 20% mid-line short position and retaining a 30% short-term position to seek spread opportunities.
Meanwhile, HYPE has initiated a five-wave corrective structure from its high of 76.94, currently running through waves 55-56. If "Endpoint 56" forms a double bottom higher than the previous low, the probability of a rebound is significant. After stabilizing in the support area, a small long position can be cautiously entered, strictly controlling the position to below 30%.
For the complete structural analysis, quantitative model signal interpretation, and specific operational plans, please refer to the full weekly review.
Summary of Core Trading Views for This Week
- BTC hourly-level trend structure analysis (detailed in Part 1)
- BTC price forecast for this week and mid/short-term trading strategies (detailed in Part 2)
- HYPE hourly-level trend structure analysis (detailed in Part 3)
- HYPE price forecast for this week and short-term trading strategies (detailed in Part 4)
Market Validation of Last Week's Trading Strategies and Core Views
- BTC short-term trading effectiveness: Bitcoin completed two short-term short trades last week (1x leverage), successfully achieving a profit of approximately 6.21%. (Detailed in Part 5)
- Market validation of BTC price forecast: In our last weekly review, we predicted (as shown in Figure 1) that if "Endpoint 41" could not hold above the lower rail of the channel, the market would likely retest the previous support level of $59,100. The current market trend has validated this view.
1. In-depth Analysis of the Bitcoin Hourly-Level Trend Structure
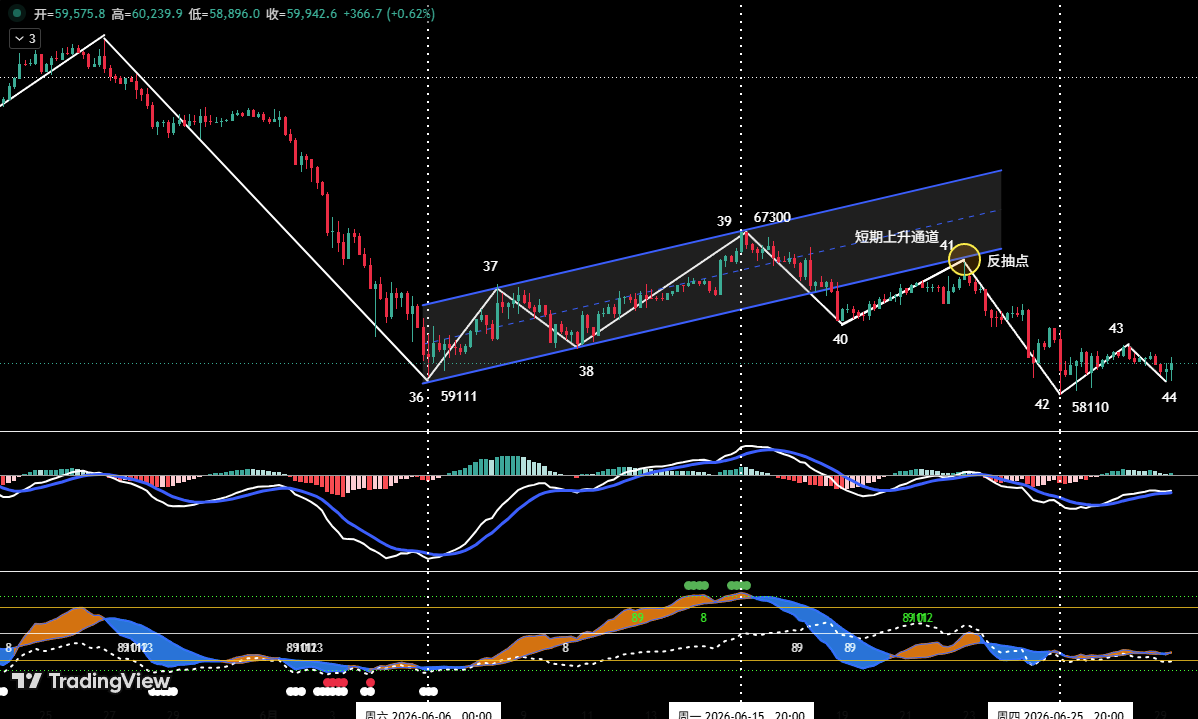 Figure 1: Bitcoin _4-hour K-line Chart
① As shown in (Figure 1): The previous weekly review clearly stated that the (40-41) segment was a pullback confirmation breaking below the lower rail of the short-term ascending channel (blue channel). If "Endpoint 41" failed to stabilize back above the lower rail of the channel, the trend would weaken, and the probability of a retest of the previous support level of $59,100 would increase. The chart shows that the adjustment last week found short-term support only after hitting a low of $58,110.
② From a 4-hour cycle perspective, the oversold rebound starting from the June 6 low of $59,100 has been confirmed to have ended at "Endpoint 39" ($67,300).
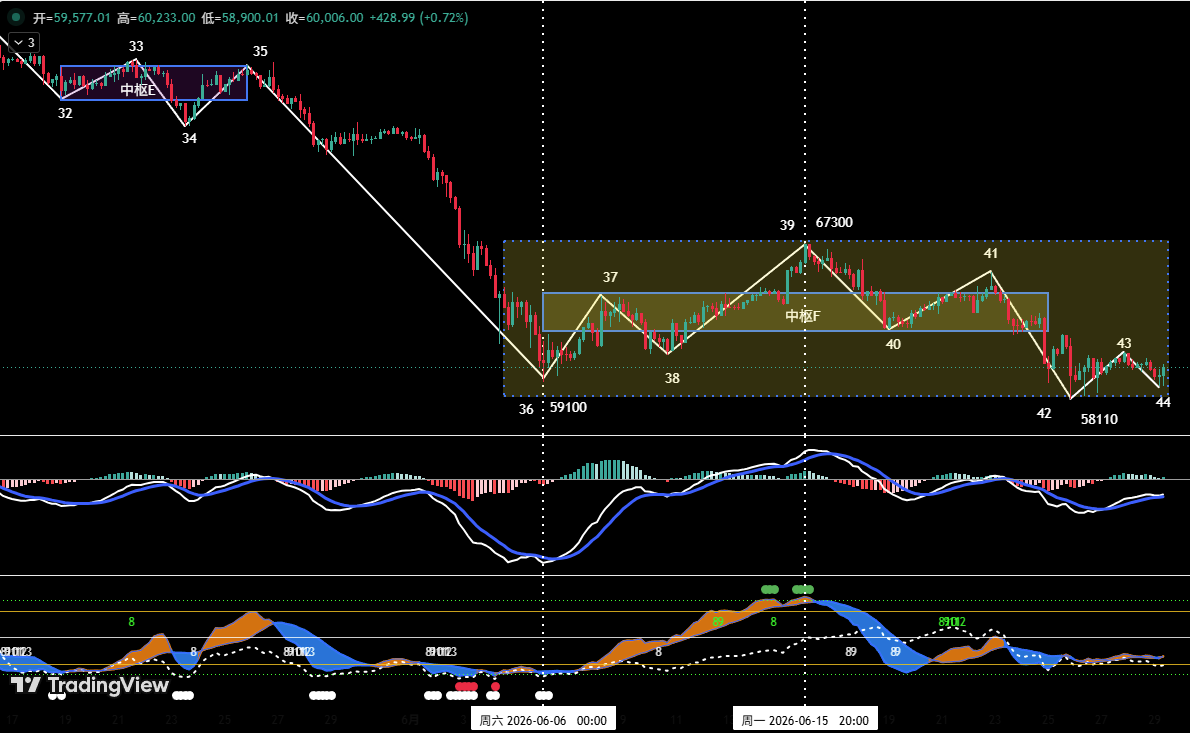 Figure 2: Bitcoin _4-hour Chart
③ As shown in (Figure 2): Starting from "Endpoint 39", the market has entered a clear 5-wave corrective structure (i.e., from Endpoint 39 to Endpoint 44), and is currently running the (43-44) corrective segment.
The final position of "Endpoint 44" will be key for the short-term direction:
- If "Endpoint 44" is above $58,110: A relatively strong technical rebound is expected to be triggered, likely leading to a wide-ranging consolidation.
- If "Endpoint 44" is below $58,110 with a bullish divergence in momentum: A rebound is also possible, but its strength remains to be seen.
- If "Endpoint 44" is below $58,110 without a bullish divergence in momentum: After a short-term adjustment, the price may break down further.
④ Summary: Based on our proprietary quantitative model analysis, the probability of the first two scenarios occurring is relatively higher.
2. Bitcoin Forecast and Trading Strategy for This Week
1. BTC Price Forecast for This Week
Core View: Focus on the formation of "Endpoint 44". If the first scenario mentioned above occurs, consider a small long position for short-term trading.
2. Key Resistance Levels
- First Resistance Zone: $60,900 ~ $62,300 region (previous significant high/low level)
- Second Resistance Zone: Around $65,500 (previous significant resistance area)
- Third Resistance Zone: $67,300 ~ $69,500 region (previous significant resistance area)
3. Key Support Levels
- First Support Level: Around $58,100 (previous significant support level)
- Second Support Level: Around $55,000 (previous significant support level)
4. Trading Strategy for This Week (excluding sudden news impact)
① Mid-line Strategy
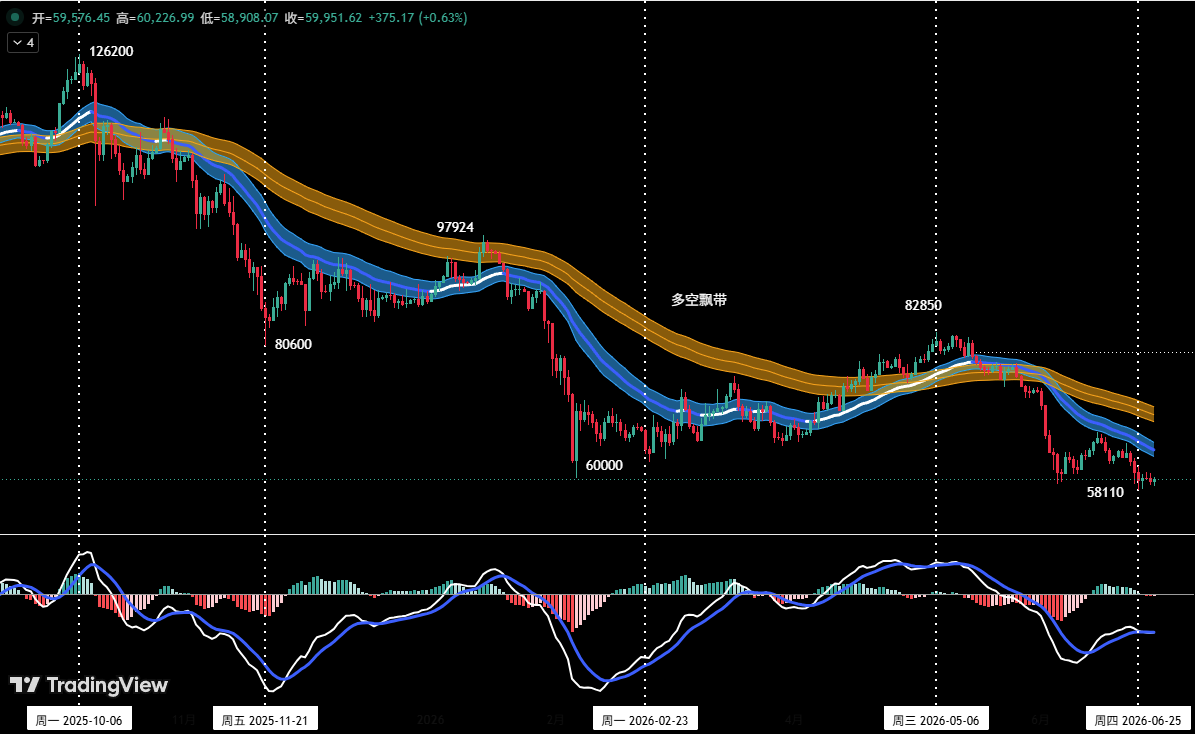 Figure 3: Bitcoin _ Daily K-line Chart (Position Monitoring Model)
Position Monitoring Model: As shown in (Figure 3), the current price has effectively broken below the "Long-Short Channel", confirming a shift in market structure to a bearish-dominant pattern. Mid-line short positions should be temporarily maintained at around 20%.
② Short-term Strategy
Utilize 30% of the position, set a stop-loss, and look for "spread" opportunities based on support and resistance levels (using the 30-minute / 60-minute chart as the operating cycle).
③ A/B/C Three Sets of Operational Plans
In short-term operations, to dynamically respond to complex market developments, we have pre-drafted three specific operational plans (A/B/C).
Plan A: Tentative Long Position in Strong Support Zone (Endpoint 44 above $58,110)
- Entry: If the price shows the above scenario, combined with signals from the quantitative model, establish a long position of around 15%.
- Risk Control: Set an initial stop-loss level.
- Exit: When the price rebounds to a significant resistance area, combined with quantitative model signals, gradually close the position to take profits.
Plan B: Light Short Position in Resistance Zone
- Entry: If the price rebounds to the $60,900~$62,300 area and shows signs of resistance, combined with top signals from the quantitative model, establish an initial short position of around 15%.
- Risk Control: Set an initial stop-loss level.
- Exit: When the price corrects to a significant support area, combined with model signals, gradually close the position to take profits.
Plan C: Add to Short Position in Strong Resistance Zone
- Add Position: If the price continues to rally to resistance near $65,000 or even $67,300 and shows signs of stalling, combined with top signals from the quantitative model, consider adding to the short position up to 30%.
- Risk Control: Set an initial stop-loss level.
- Exit: When the price falls to a significant support level, combined with model signals, gradually close the position to take profits.
3. Analysis of the HYPE Hourly-Level Trend Structure
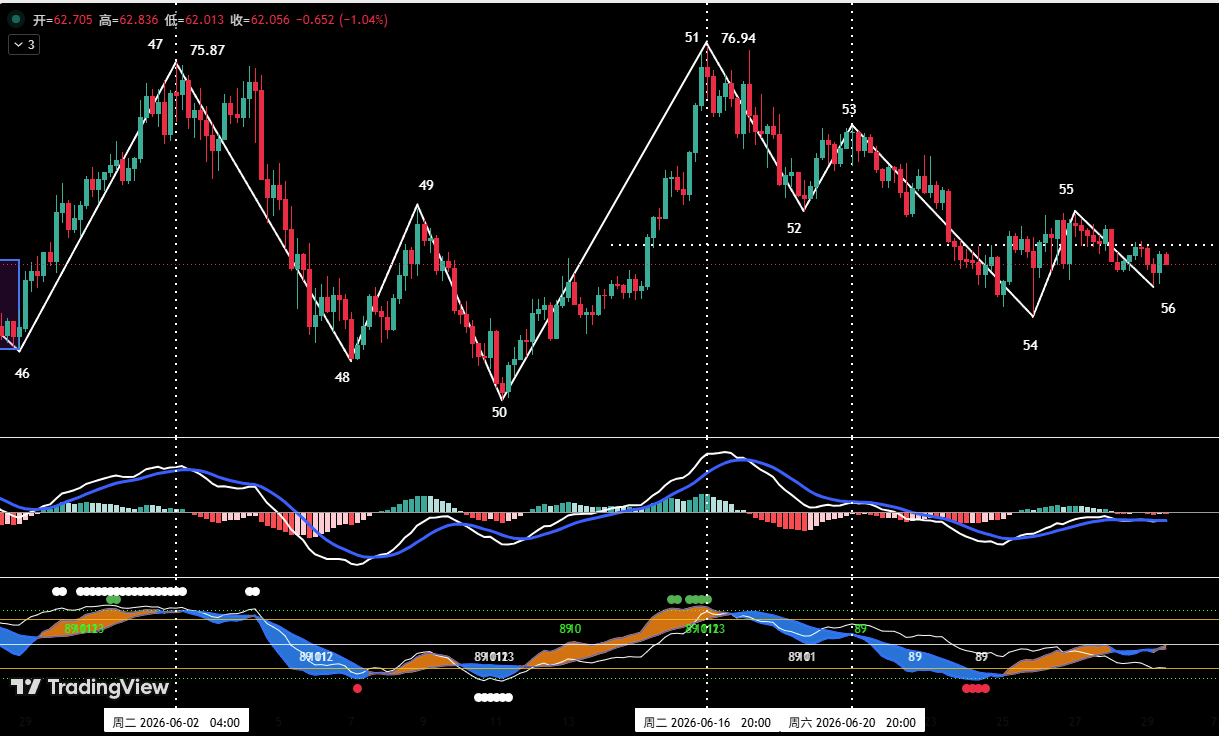 Figure 4 HYPE_4-hour K-line Chart
① As shown in (Figure 4), HYPE started a correction from its June 16 high of $76.94 (Endpoint 51). On the 4-hour chart, it can be subdivided into a five-wave corrective structure, i.e., waves 51-52, 52-53, 53-54, 54-55, 55-56. The price is currently running in the 55-56 corrective segment, and the position of "Endpoint 56" is key to the near-term price trend.
② Scenarios for the end of the short-term correction:
- If "Endpoint 56" is higher than "Endpoint 54", it forms a "double bottom" pattern. This correction may end, and the probability of a rebound from "Endpoint 56" is high.
- If "Endpoint 56" is lower than "Endpoint 54" but forms a bullish momentum divergence, the probability of this correction ending is also relatively high, potentially leading to a rebound.
③ Scenarios for the continuation of the short-term correction:
- If "Endpoint 56" is lower than "Endpoint 54" without a bullish momentum divergence, this correction may extend into a seven-wave corrective structure.
④ Based on our proprietary quantitative model analysis, the probability of the first scenario occurring is significantly higher.
4. HYPE Forecast and Short-term Trading Strategy for This Week
1. HYPE Price Forecast for This Week
Key Resistance Levels:
- First Resistance Level: Around $65.5
- Second Resistance Level: Around $71.5
Key Support Levels:
- First Support Level: Around $58.5
- Second Support Level: $52 ~ $54 zone
Core View on HYPE this week: Observe the final position and technical pattern of "Endpoint 56".
2. HYPE Short-term Trading Strategy for This Week (Long on support)
This week, HYPE short-term trading should follow the strategy of "buy on dips, avoid chasing rallies."
Short-term Strategy: Cautiously long after stabilization in the support area. When the HYPE price corrects to levels above $58.8, or deeper into the $52~$54 support zone, and shows signs of stabilizing and bottoming, combined with bottom signals triggered by the two models, consider a small long position. The position must be strictly controlled below 30%, and stop-loss discipline must be adhered to.
5. Bitcoin Short-term Trade Review
Strictly following our operational plans and the trade signals generated by our proprietary "Spread Trading Model" and "Momentum Quantitative Model", we completed two short-term short trades last week, achieving a total trading profit of approximately 6.21%.
1. Short-term Trade 1
Bitcoin Short-term Trade Details (Leverage 1x):
 Entry Strategy:
- When the price rebounded to near $65,500 and encountered resistance with signs of pressure, the K-line formed a bearish "Top Divergence" signal.
- The "Spread Trading Model" triggered a top warning signal (white dot), and the "Momentum Quantitative Model" formed a bearish momentum divergence signal.
Therefore, we established a 15% short position at $64,530.
Exit Strategy:
- When the price fell to near $62,000 and stabilized, the K-line formed a "Bottom Divergence" signal.
- The "Spread Trading Model" triggered a strong bottom warning signal (red dot + white dot), forming a bottom resonance signal with the "Momentum Quantitative Model".
Therefore, we fully closed the position near $62,474.
Summary: This trade was successfully completed with a profit of approximately 3.18%.
2. Short-term Trade 2
Bitcoin Short-term Trade Details (Leverage 1x):
 Entry Strategy:
- When the price moved to around $63,000, the two momentum lines in the "Momentum Quantitative Model" ran near the "zero line" and showed a state of momentum exhaustion, subsequently forming the first "Death Cross" pattern below the "zero line".
- Simultaneously, the "Spread Trading Model" also issued a top warning signal.
Therefore, we established a 15% short position at $62,679.
Exit Strategy:
- When the price fell to near $59,000 and stabilized, the K-line formed a "Bottom Divergence" signal.
- The "Spread Trading Model" triggered a strong bottom warning signal (red dot + white dot), forming a bottom resonance signal with the "Momentum Quantitative Model".
Therefore, we fully closed the position near $60,775.
Summary: This trade was successfully completed with a profit of approximately 3.03%.
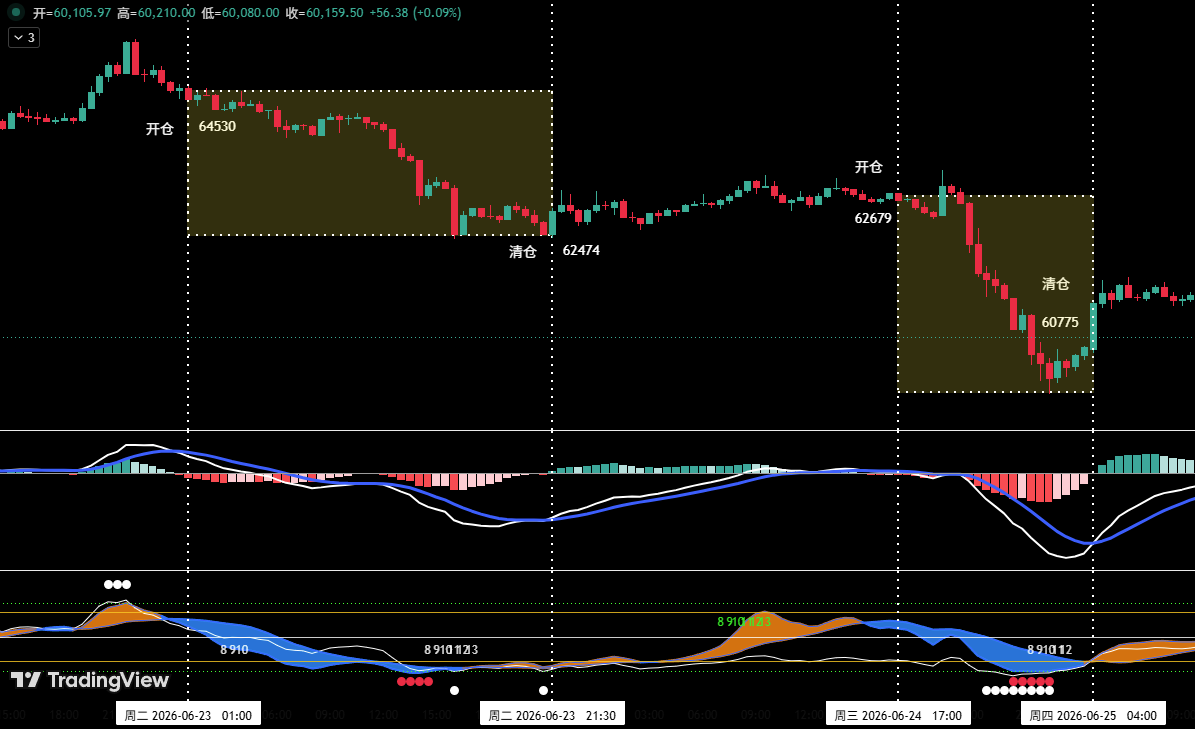 Figure 5: Short-term Trade Illustration
6. Special Reminder
- When opening a position: Immediately set an initial stop-loss level.
- When profit reaches 1%: Move the stop-loss to the entry cost price (breakeven point) to ensure capital safety.
- When profit reaches 2%: Move the stop-loss to the 1% profit level.
- Continuous Tracking: Thereafter, for every additional 1% profit in price, move the stop-loss by 1% synchronously to dynamically protect and lock in profits.
Risk Warning:
Financial markets are highly volatile, and all market analysis and trading strategies require dynamic adjustment. All views, analytical models, and operational strategies mentioned in this article are derived from personal technical analysis, serve only as personal trading logs, and do not constitute any investment advice or operational basis. The market involves risk, and investment should be made cautiously. Please do not make decisions based on this.


