Data Interpretation of Six Major Crypto Protocols: Revenue Continues to Grow, Why Aren't Token Prices Rising?


- Core Viewpoint: In the first half of 2026, the six major crypto protocols generated a total revenue of $7.42 billion. However, high revenue does not equate to token price increases. This is because token value is influenced by a combination of factors including revenue distribution mechanisms, token emission pressure, and external market conditions. Investors need to assess the true value of tokens from the three dimensions of revenue, distribution, and emissions.
- Key Elements:
- In Q2 2026, protocol revenue decreased by 15.7% quarter-over-quarter (from $394 million to $332 million), with only Uniswap achieving positive growth, reflecting the significant impact of the market environment on protocol profitability.
- Hyperliquid distributes 100% of its revenue to holders and executes buyback-and-burn mechanisms, resulting in positive net cash flow for the token. Conversely, Aerodrome, Sky, and Uniswap experience negative net value flow as their token emissions exceed the income distributed to holders.
- Token emissions include inflation, unlocks, and incentives. If the amount of emissions surpasses the income distributed to holders, it dilutes token value, even if the protocol is profitable.
- Since its token launch, PumpFun has generated approximately $450 million in revenue. However, due to factors such as rapid unlock schedules and unmet airdrop expectations, the token price has continuously dropped by 60%.
- While buyback mechanisms can create buying pressure, Aave's case shows that buybacks at high prices (average price of $182) can lead to capital losses due to market downturns (current price around $90).
- The equity-token separation structure (e.g., Ripple) prevents token holders from sharing in the company's growth dividends, causing token performance to be severely disjointed from equity.
- A combination of high FDV and low circulating supply suggests future supply shocks. Even if a protocol's P/S ratio appears cheap, the potential overhang from actual selling pressure may suppress prices.
Author: Castle Labs
Compiled by: TechFlow
TechFlow’s Take: In the first half of this year, crypto protocols generated a total revenue of $7.42 billion. Yet, most tokens have failed to keep pace with their underlying fundamentals. Investors are shifting away from gambling and starting to seriously examine product revenue distribution and token value-capture mechanisms, rather than blindly chasing rallies. This article breaks down the revenue sources, allocation methods, and token release pressures of six major protocols, revealing why high revenue doesn't necessarily mean a token will rise – a crucial question every holder should understand today.
Since the start of the year, crypto protocols have generated a cumulative $7.42 billion in revenue.
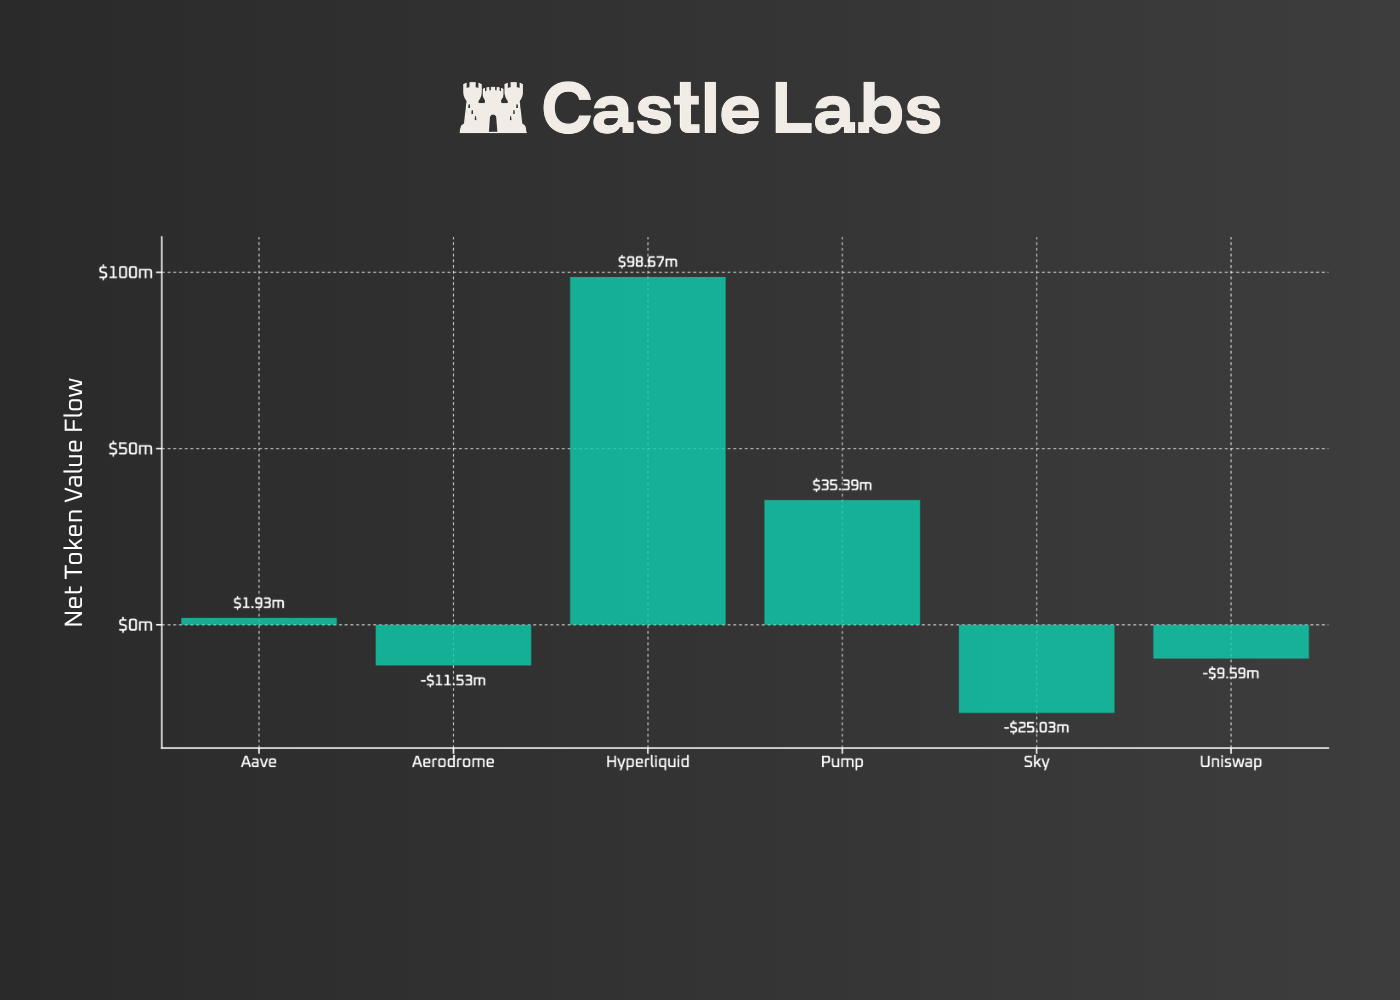
Figure: Net token value flows for six major protocols in H1 2026 (holder revenue minus token emissions). Hyperliquid saw a net inflow of $98.67 million, while Sky had a net outflow of $25.03 million. Source: Castle Labs.
Despite these staggering numbers, most tokens in the crypto space still fail to reflect the success of their underlying protocols.
Not all revenue is created equal.
This has been a problem ingrained in the industry from the start, but the situation is changing. The questions investors ask when evaluating tokens are evolving. They are now focusing on product revenue generation, spending, and value capture for holders, marking a shift from speculative gambling to genuine investing.
Most of the time, holders seek answers to these questions:
How does the protocol generate revenue, and is it sustainable?
How do they distribute it? Can holders derive value from it?
How much token value is used for emissions, including inflation, unlocks, and incentives?
Is there an equity allocation that grants greater rights than existing holders?
Answering these four questions determines a project's weight in the eyes of investors, yet most projects fail to provide clear answers. Each token has different value-capture mechanisms, and some have none at all. Even with direct value sharing, token performance can still fall short of expectations.
Take PumpFun as an example: since its token launch, the protocol has generated approximately $450 million in revenue (over a one-year timeframe), yet the token has been in an endless decline due to multiple factors, including token unlock speed and unmet airdrop expectations.
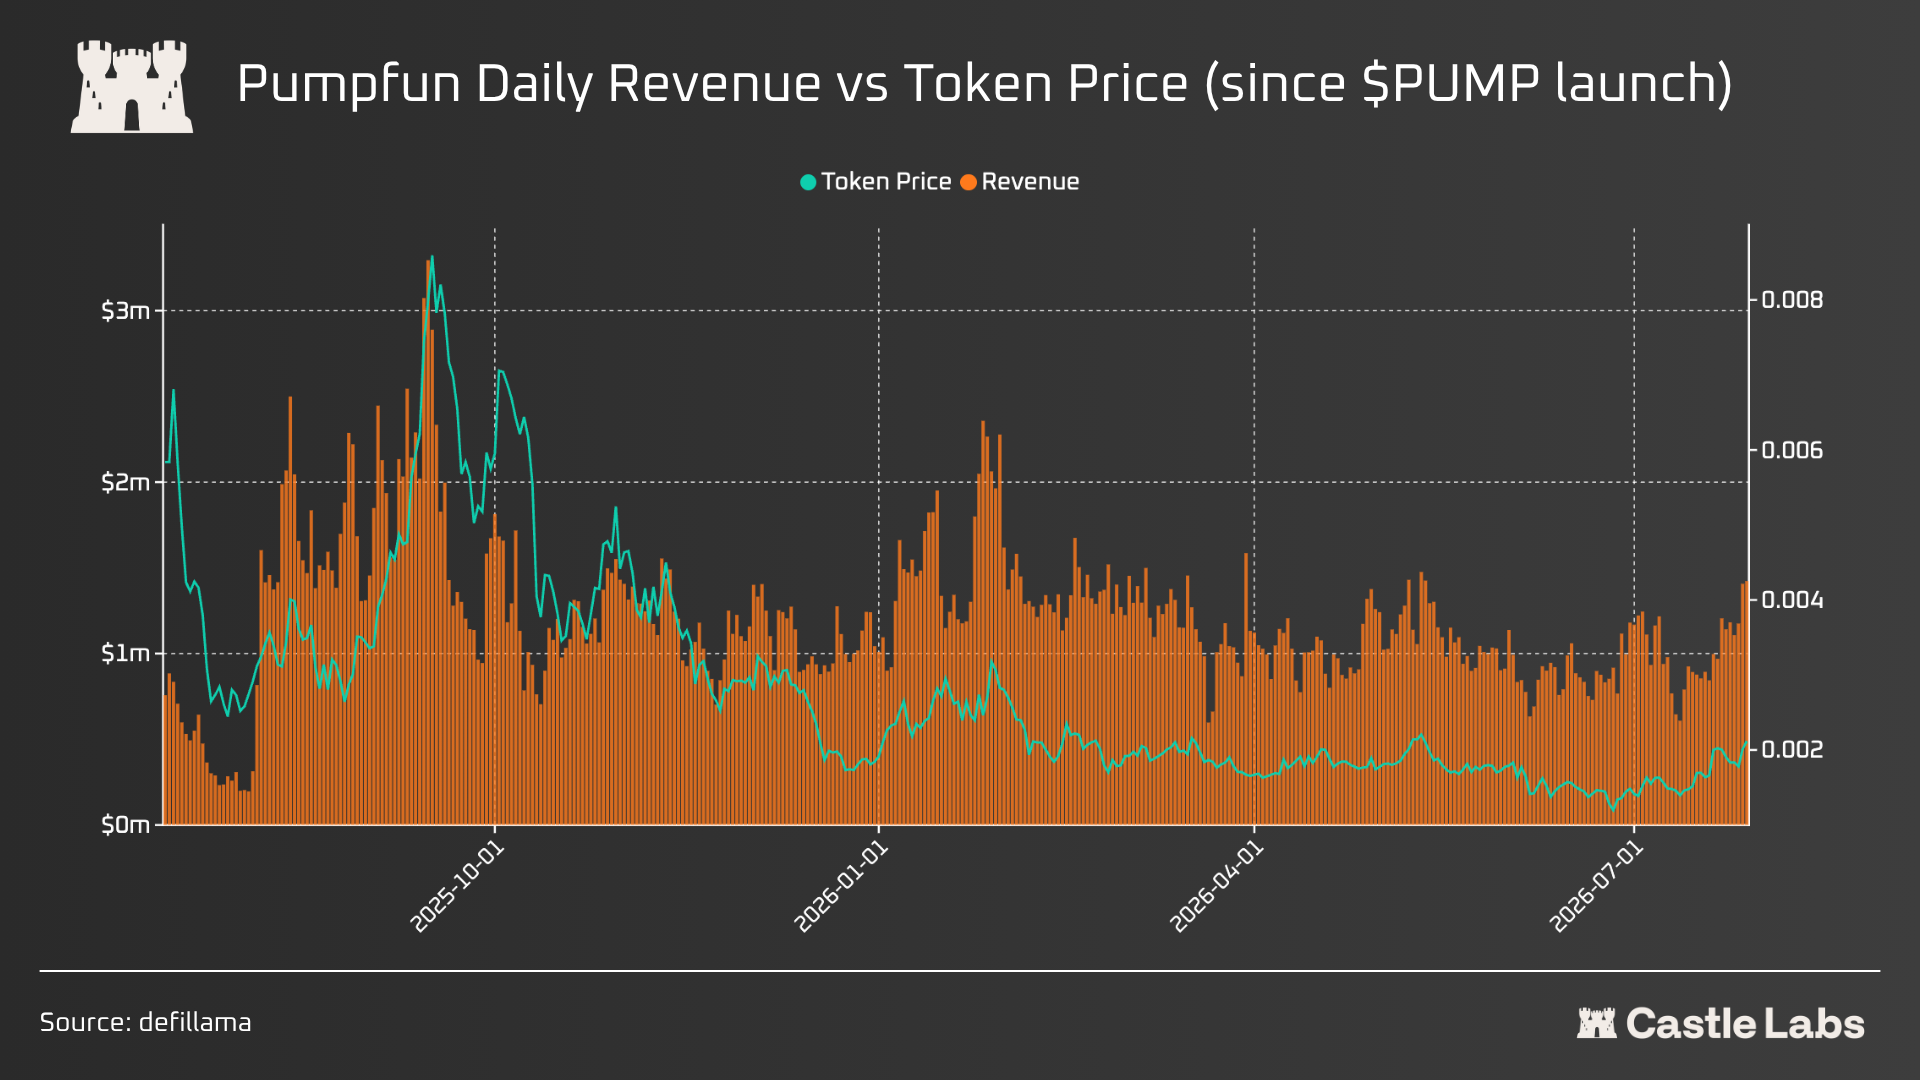
Figure: Daily revenue (orange) vs. token price (cyan) for PumpFun since the PUMP token launch, showing a persistent divergence between revenue and token price. Source: Castle Labs.
This article focuses on analyzing how top protocols generate and distribute revenue differently, considering emission and incentive factors, to illustrate the details investors should pay attention to when evaluating a protocol or token.
Crypto Revenue Sources and Distribution
Before discussing value capture for holders, the fundamental question is to quantify the revenue generated by major products and how it's distributed. This analysis examines six protocols (Aave, Aerodrome, Hyperliquid, Pump, Sky, Uniswap), which collectively generated $726 million in revenue in H1 2026.
While higher revenue can indicate a sustainable business, looking at this figure in isolation isn't enough. First, to account for short-term volatility, it's best to measure revenue over different timeframes to assess its sustainability. Therefore, we also compare revenue between Q1 and Q2 of 2026 and measure the change. For most protocols, the change is negative, reflecting a weaker Q2 due to overall market conditions.
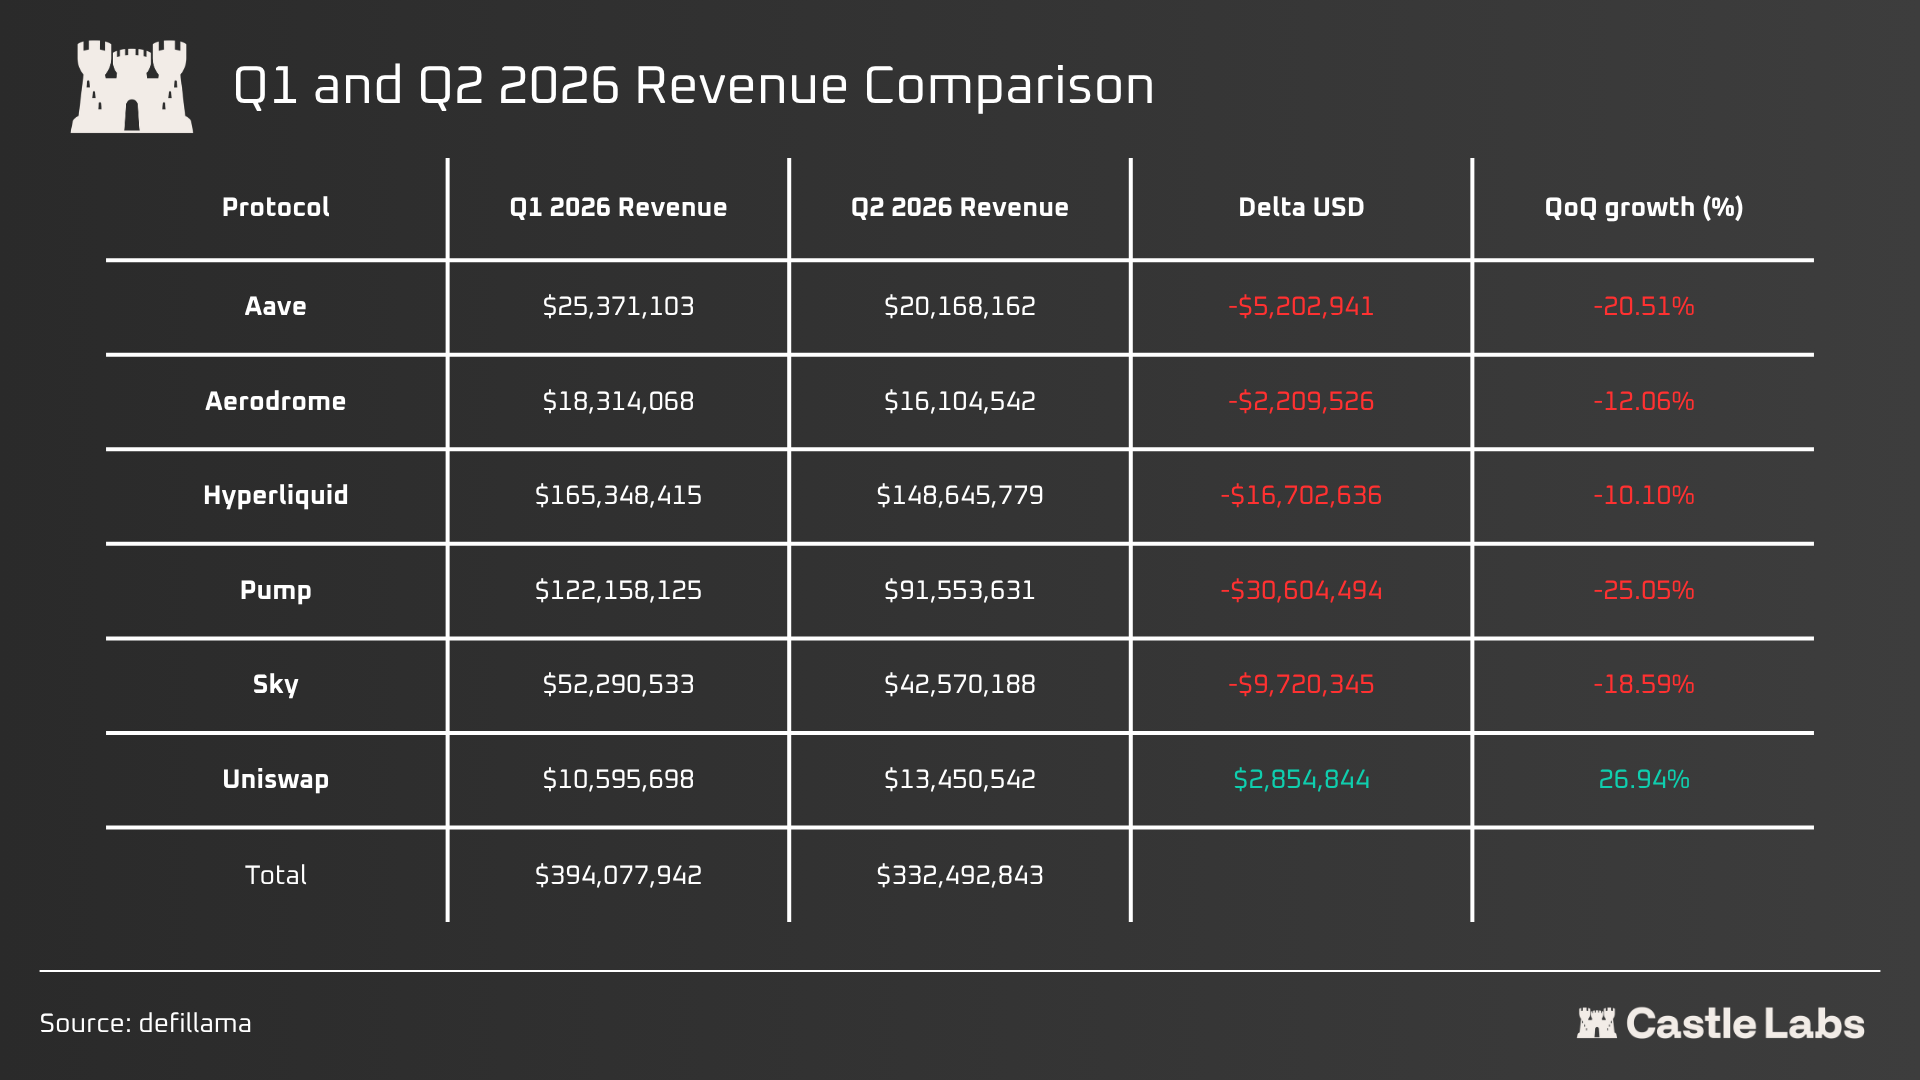
Figure: Q1 vs. Q2 2026 revenue comparison for six major protocols. Only Uniswap achieved positive sequential growth (+26.94%). Total revenue fell from $394 million to $332 million. Source: Castle Labs.
Turning to revenue sources, Hyperliquid generates revenue from its perpetual exchange trading fees (native + HIP-3), spot market fees, code auctions, priority fees, and HyperEVM gas fees.
Aerodrome, a decentralized exchange (DEX), generates revenue through trading fees and external voting incentives (bribes). Similarly, Uniswap charges fees on trades as its revenue source.
Sky generates revenue from various products: stability fees on DAI/USDS collateralized loans, liquidation penalties, Peg Stability Module (PSM) trading fees, and interest from Direct Deposit Modules (D3Ms) and Real-World Assets (RWAs).
Continuing, Aave generates revenue from interest rate spreads (borrower payments), flash loans, liquidation penalties, and stability fees on its native stablecoin, GHO. PumpFun generates revenue from trading fees and graduation fees when newly created tokens reach a target market cap.
Having clarified the revenue sources of these protocols, we now compare them with token emissions to explore whether and how they balance. While holder revenue might be high, if token emissions are even higher, the significance of the value capture process diminishes. A protocol might have $100 million in revenue, but if it achieves this by minting $200 million in tokens annually, the implication is entirely different. Furthermore, token emissions are important because they show how much value flows to inflation, team or investor unlocks, and, most importantly, incentives.
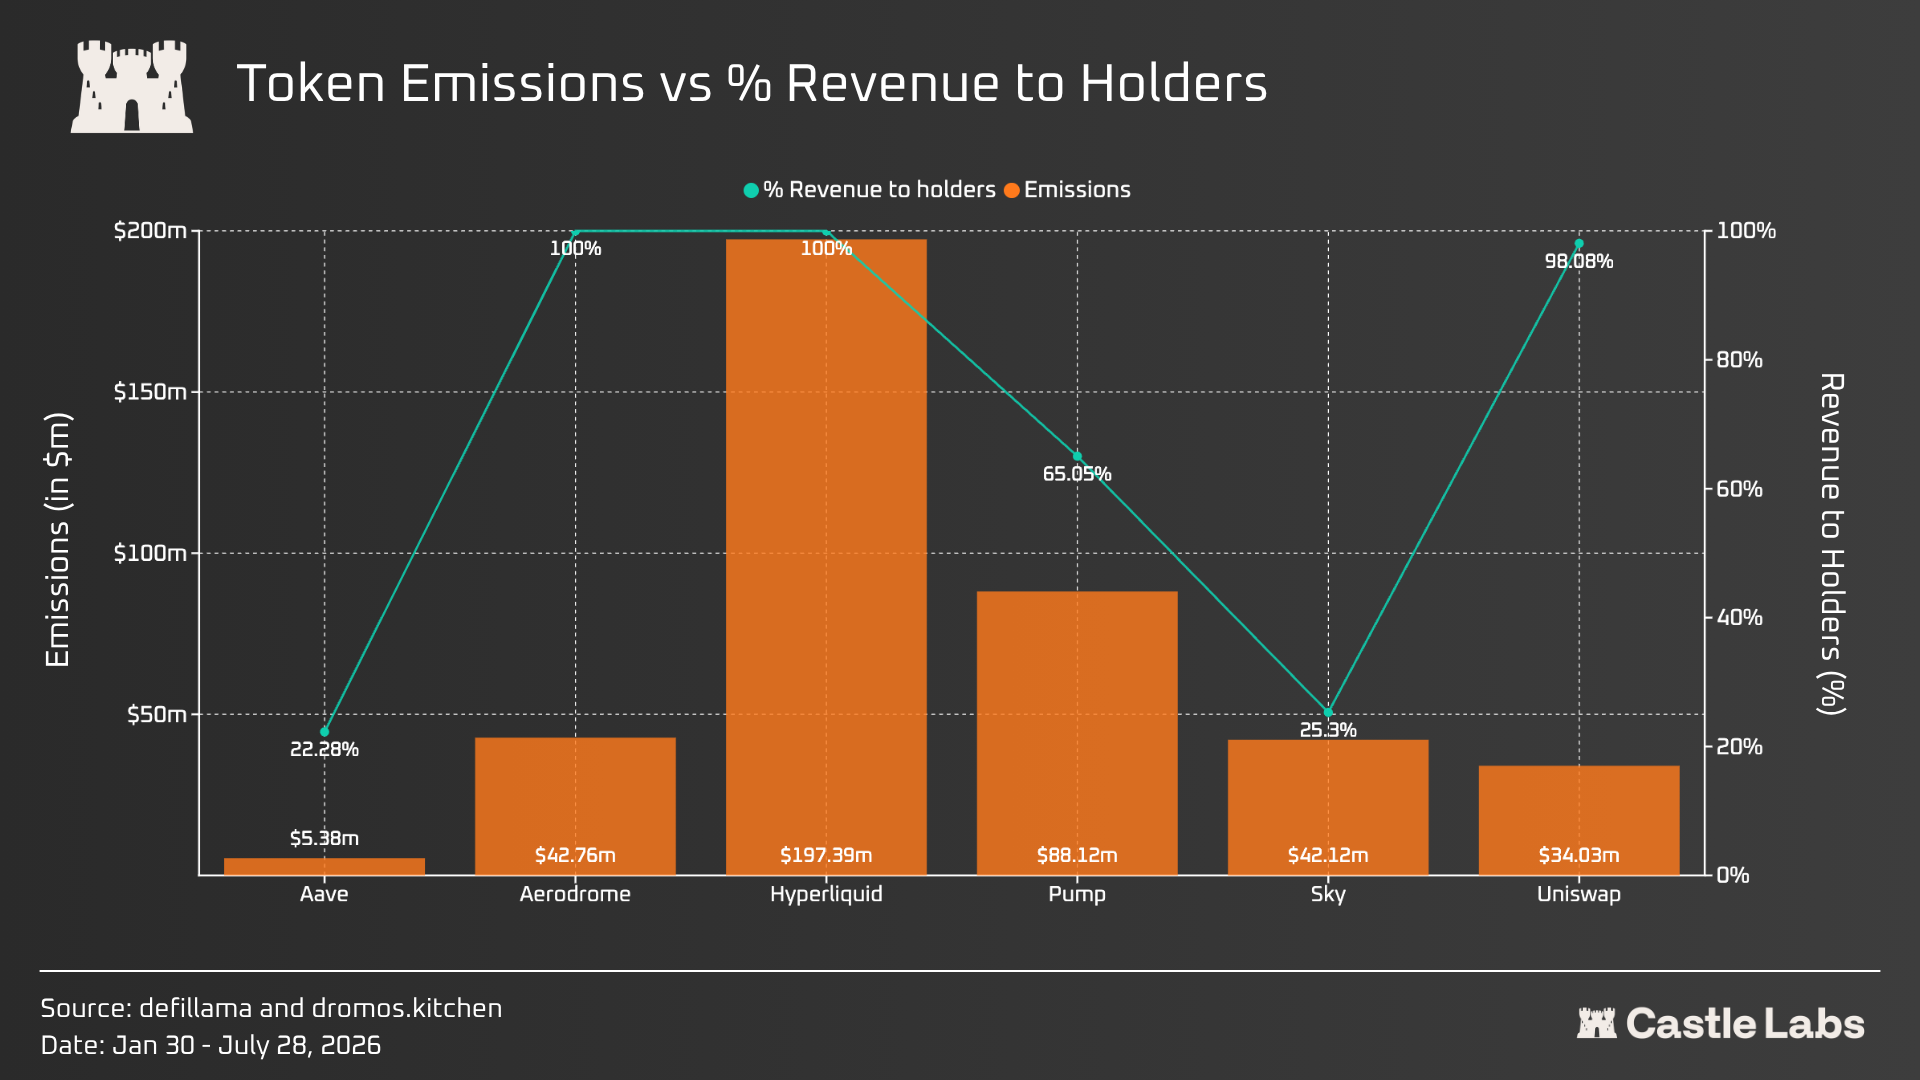
Figure: Comparison of token emissions (orange bars) vs. the proportion of revenue distributed to holders (cyan line) for six major protocols. Hyperliquid allocates 100% of revenue to holders. Source: Castle Labs.
Most protocols' revenue distribution is typically split between holders and the treasury. The specifics depend on the particular protocol mechanism and governance handling this distribution.
To illustrate how emissions affect the token, we subtract emissions from holder revenue. For Aerodrome, Sky, and Uniswap, the net token flow becomes negative after this calculation, even with revenue distributed to holders. This indicates that these protocols emit more tokens to sustain current revenue levels, reducing the net value flowing to holders.
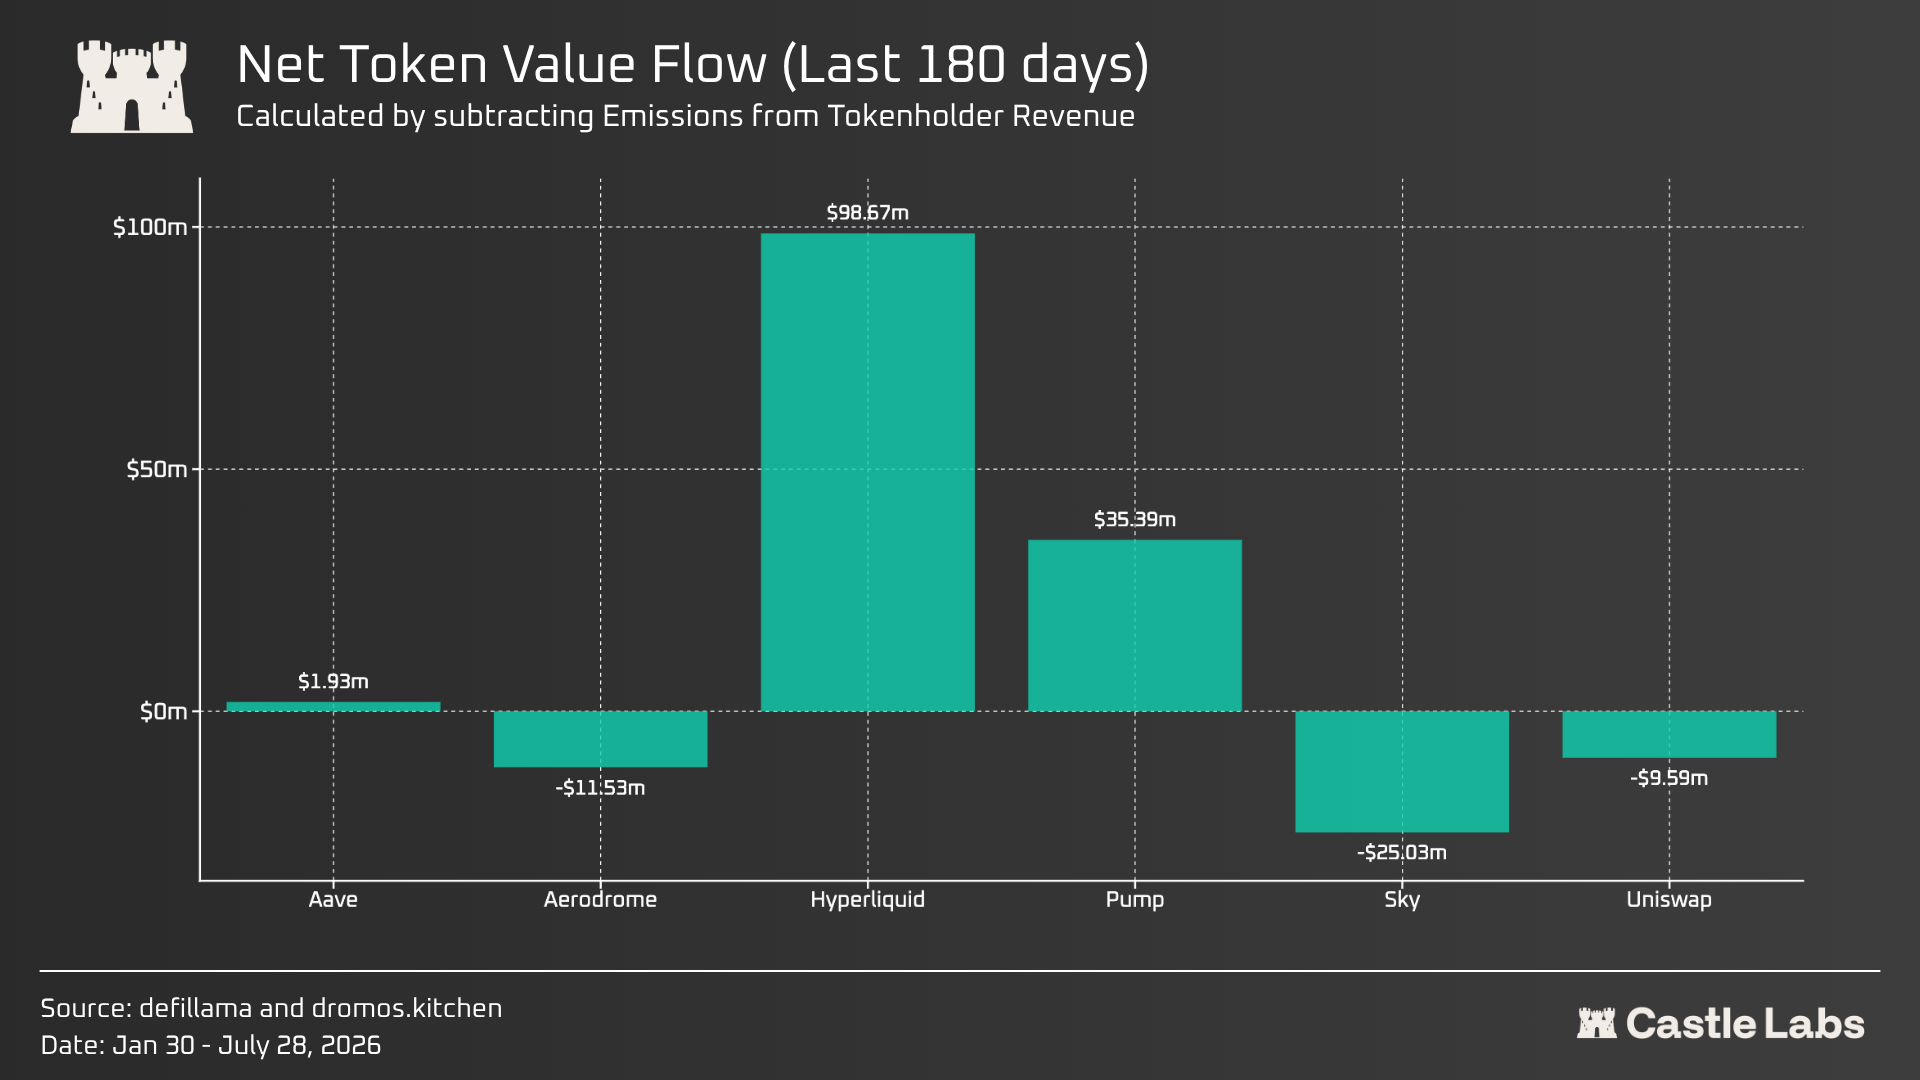
Figure: Net token value flows over the past 180 days for six major protocols, calculated as holder revenue minus token emissions. Source: Castle Labs.
Currently, holders capture value in two primary ways: buybacks and fee distribution.
Buybacks are one of the simplest, albeit indirect, ways for projects to distribute value to holders, by using revenue to purchase and burn tokens.
Buybacks often return tokens to the protocol treasury for future incentives or staking rewards; for example, Aave transfers bought-back tokens to the treasury.
For greater consistency, most protocols destroy these assets, reducing supply. For instance, Lighter destroyed approximately 15.6 million LIT tokens (6.6% of supply) acquired through revenue, valued at $36 million.

Figure: On-chain record of Lighter transferring 15,638,700 LIT (approx. $36.125 million) from the treasury to a burn address. Source: Castle Labs.
Hyperliquid executes buybacks and burns programmatically, having burned over 47 million HYPE tokens, approximately 4.72% of its supply. Uniswap executed a burn of 100 million UNI tokens in December 2025, totaling 107 million UNI burned to date (approximately 11% of total supply), sourced from its enabled fees.
Burns are not universal, and the method of execution is nuanced. For example, BNB used to conduct quarterly burns. However, these were often less effective than users expected, as they burned non-circulating tokens and thus had no real impact on market dynamics. Users must scrutinize the details of a burn: from where are the tokens burned? Circulating supply or non-circulating supply?
Each project executes buybacks differently. Holders of Maple Finance recently voted to approve a buyback program that scales with revenue, allocating an increasing share to holders as revenue grows. This updates its MIP-019, which previously allocated 25% of revenue to buybacks. Based on average revenue of $1.15 million in H1 2026, buybacks would be scaled down to 10%, which might not be great news for holders, but the proposal passed with 99.97% approval.
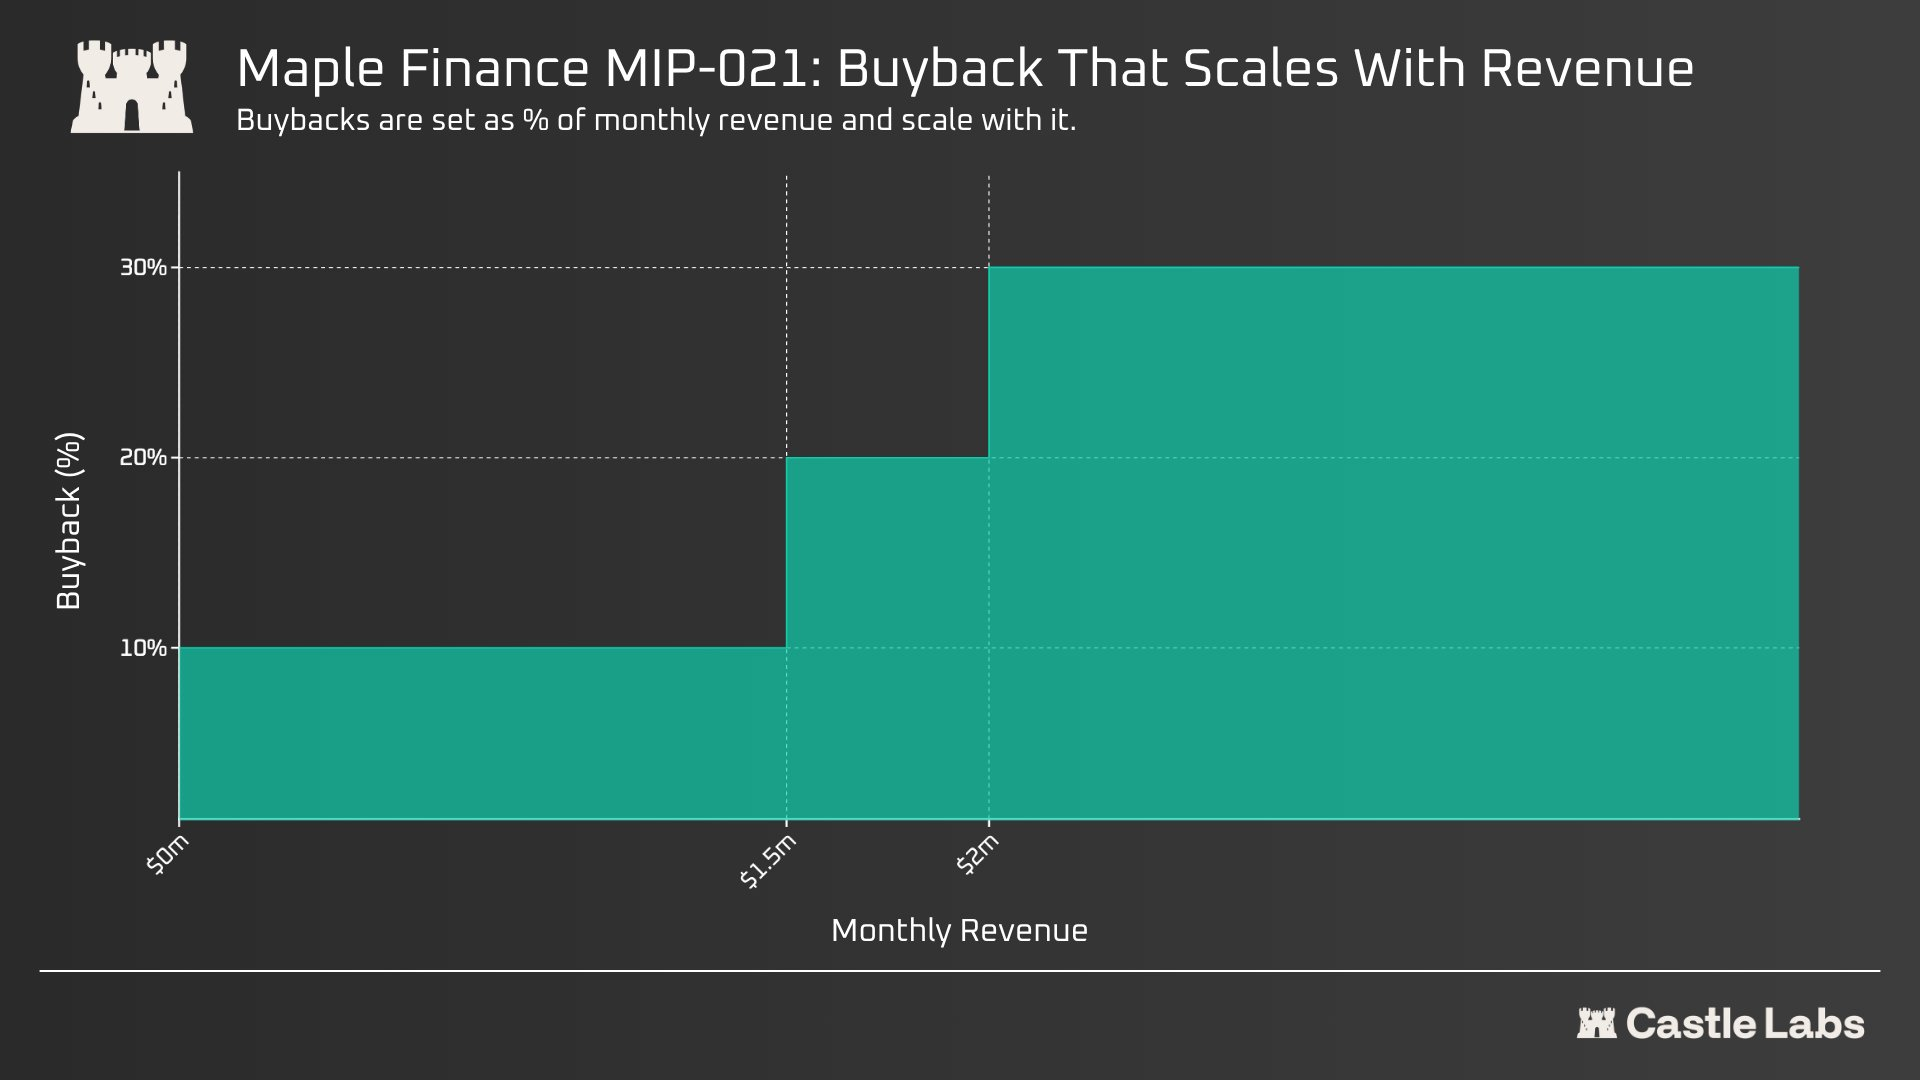
Figure: Maple Finance's MIP-021 proposal for a tiered buyback ratio scale based on monthly revenue, with the ratio rising to 30% when monthly revenue exceeds $2 million. Source: Castle Labs.
Additionally, holders can choose to stake their tokens with the protocol and earn staking yields from the treasury. Following a recent tokenomics update, Lighter targets a staking yield of 6%, which would distribute 7.5 million LIT tokens annually based on the current staking level of 125 million tokens.
Similarly, over 430 million HYPE are staked, earning yields from the future emission reserve, estimated at 2.1%.
Buybacks and burns alone cannot save a project from poor tokenomics or declining revenue and should be considered within the broader framework of each protocol's buyers and sellers. However, they can be used to drive ecosystem growth and bootstrap liquidity while slowly decreasing over time, allowing for organic growth. Burns have a similar mechanism, using platform activity to counter inflationary tokenomics.
Fee Distribution
Other protocols, like Aerodrome and Curve Finance, use the ve tokenomics (Ve) model for direct fee distribution. In this model, holders stake tokens and convert them to vote-escrowed tokens (e.g., veAERO or veCRV).
It creates economic value for holders through different mechanisms:
Protocol Trading Fees: These protocols allocate 50-100% of fees to ve token holders.
Yield Enhancement: Holding these tokens also increases yields for liquidity providers (LPs) in these exchange pools.
Bribes: Protocols pay cash incentives to ve holders in exchange for their governance votes, directing future rewards to specific liquidity pools.
Ve protocols are practically characterized by an inherent design that drives strong emissions, partly explaining their high fee distribution growth achieved through inflation.
Using these methods, these protocols have generated cumulative holder revenue exceeding $2.75 billion, primarily driven by Hyperliquid and Uniswap (due to the 100 million UNI burn in December 2025).
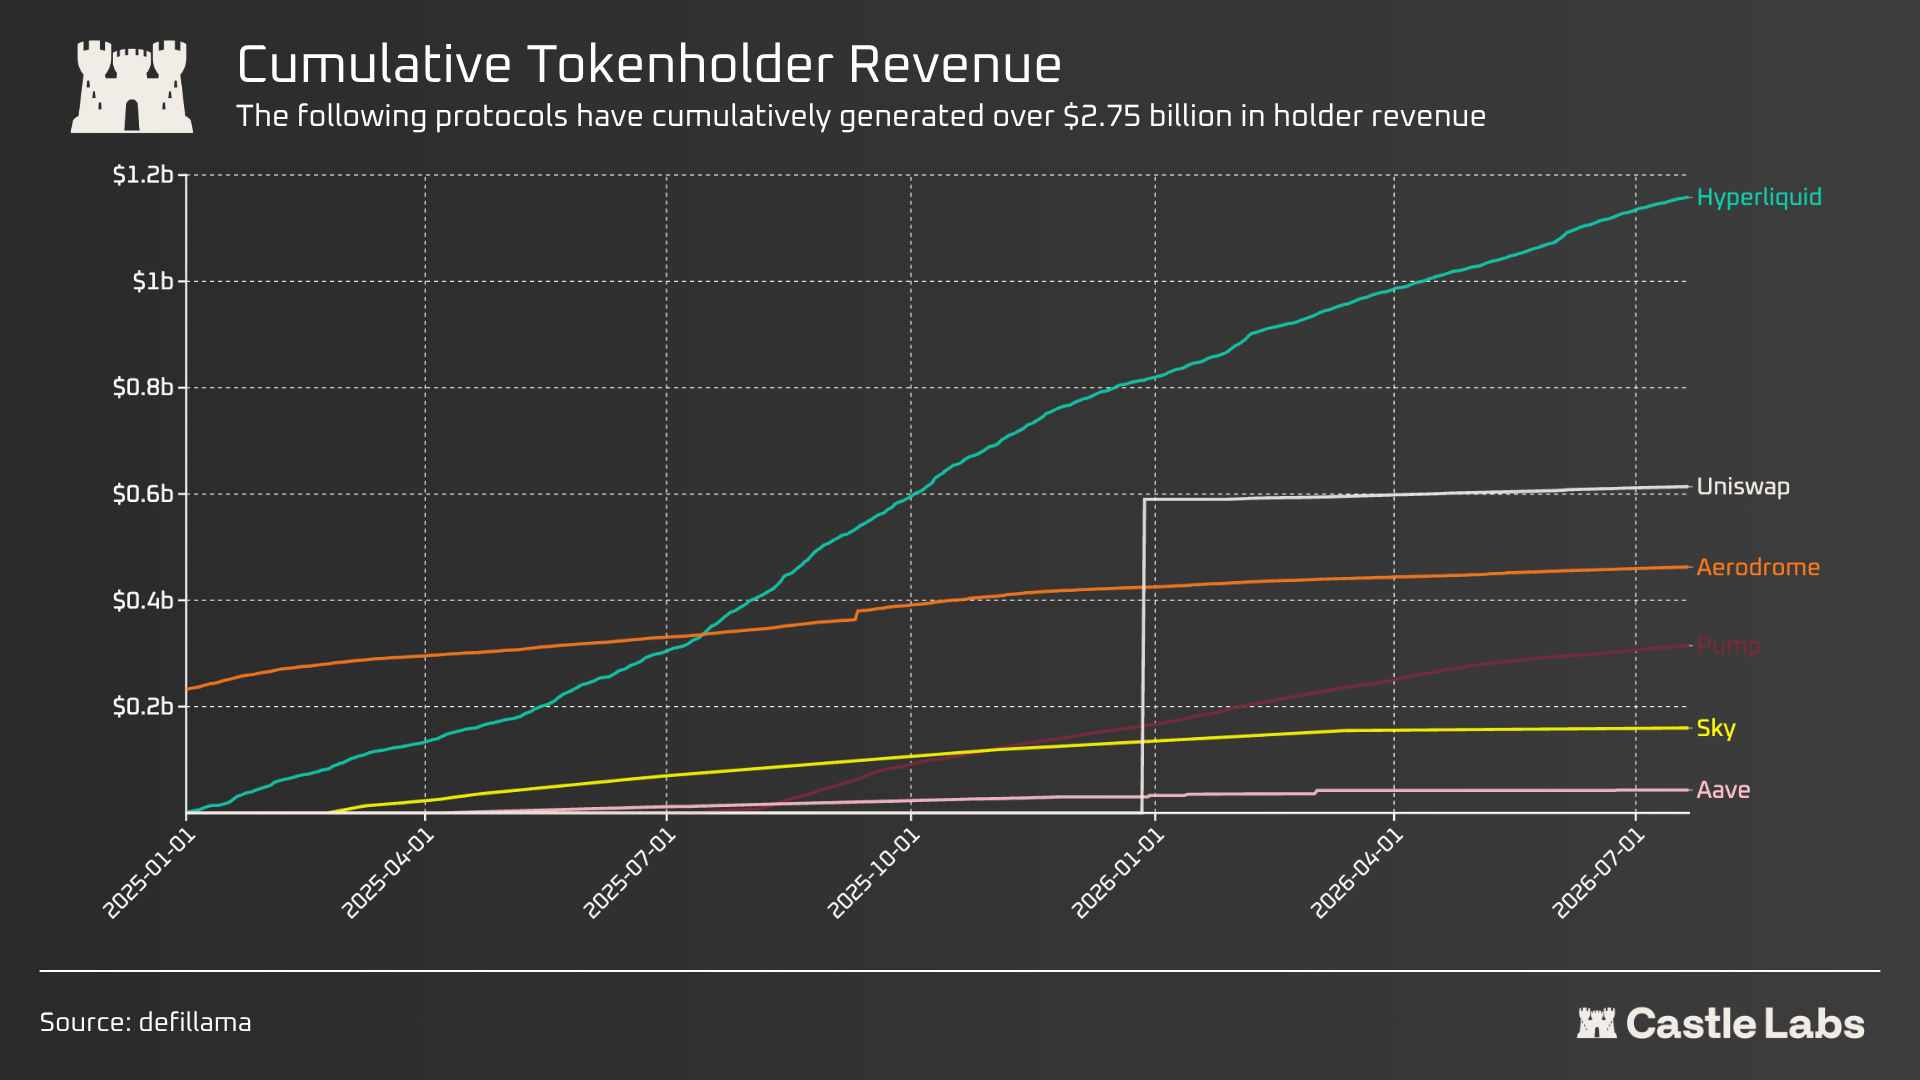
Figure: Cumulative revenue distributed to holders by six major protocols has exceeded $2.75 billion, with Hyperliquid and Uniswap contributing the largest shares. Source: Castle Labs.
But as we mentioned, value capture alone is not enough; emissions also need to be balanced.
In the next section, we explore other reasons besides holder revenue and emissions that might hinder token growth.
The Beautiful Trap of Tokens
Over time, crypto products have matured and generated substantial revenue, but revenue doesn't necessarily mean the token will perform better.
Most revenue-generating product tokens underperform due to the following reasons:
Revenue doesn't flow to the token: Even if the protocol generates meaningful revenue, this value often stays in the treasury instead of flowing to holders. The way buybacks are used matters. Treasury retention is discretionary and depends on the protocol. Since there is no contractual obligation, protocols can pause, adjust, or cancel buybacks at any time. While governance is behind these decisions, most voting power is controlled by the project team.
Equity-token separation makes holders second-class citizens: More companies are now adopting dual equity and token structures. A classic example of such a token is XRP. Ripple Labs stock has performed well since 2025, rising 105%, while the XRP token has fallen 45% in the same period. They issue tokens and equity, but since holders have no specific rights to company revenue, there is no value capture. In contrast, equity holders receive this value and perform well.
Higher unlock speeds increase expected selling pressure: Even with revenue sharing, higher-rate supply unlock schedules depress the token, as explained earlier in the discussion of token emissions. Another aspect is the low circulating supply and high FDV nature of tokens, as a large portion of supply still needs to be unlocked and absorbed by the market, effectively lowering the protocol's P/S ratio, making it appear 'cheap', but the actual circulating supply shock is expected as part of future emissions.
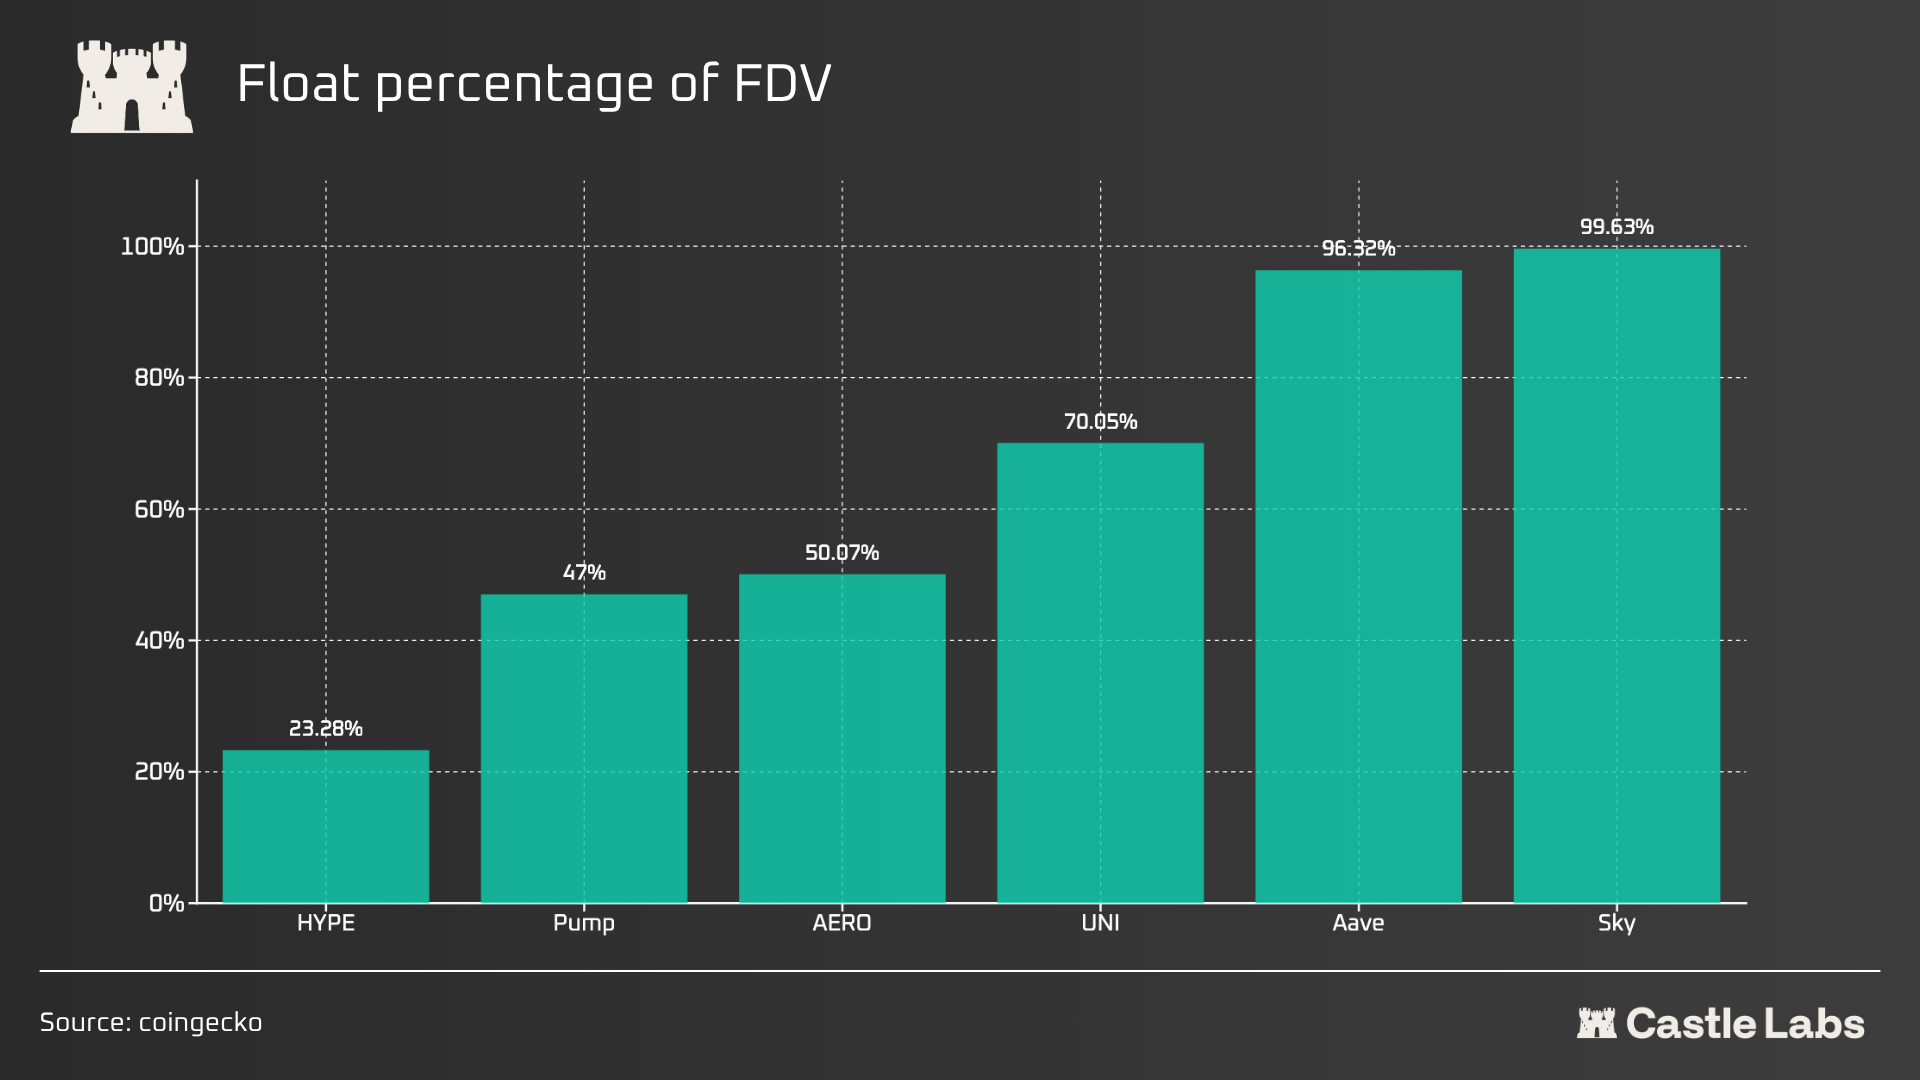
Figure: Proportion of circulating supply to fully diluted valuation (FDV) for six major tokens. HYPE is only 23.28%, while Sky is at 99.63%. Source: Castle Labs.
Taken together, these factors reflect the true nature of tokens and, in most cases, explain price action, although other factors may also influence their performance.
The PUMP token has fallen 60% since its launch, despite the project having completed over $315 million in buybacks. On the other hand, HYPE has risen 1400% since its launch and returned $1.2 billion to shareholders through buybacks. Both have ongoing buyback programs, but PUMP's price has been disappointing due to a lack of team communication, no airdrop, rapid unlocks, and market selling of the token.
The AAVE token has struggled since the beginning of the year, completing $45 million in buybacks since the program launched in April 2025 (currently paused due to the Kelp DAO incident). This is caused by multiple factors, including the departure of DAO service providers like BGD Labs and ACI, the impact of the Kelp DAO incident on Aave, and increased institutional competition from Morpho.
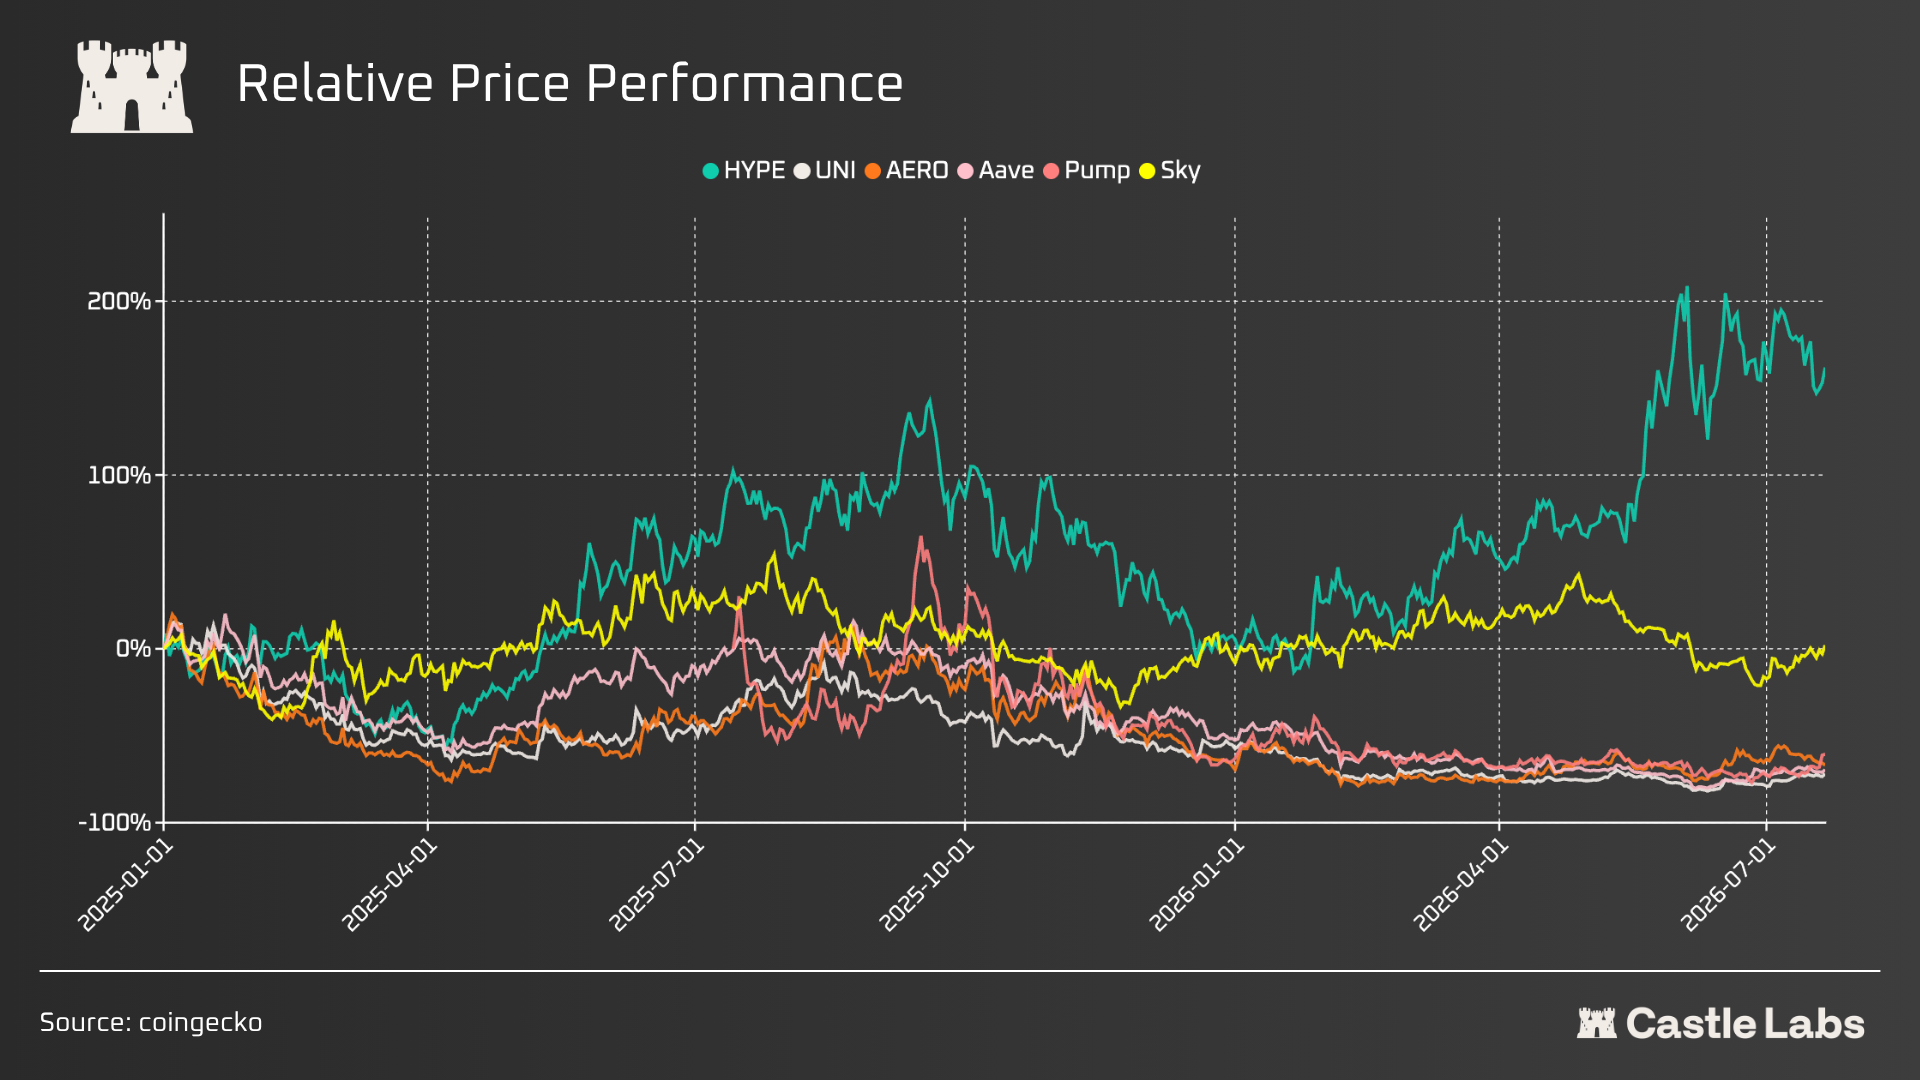
Figure: Relative price performance of HYPE, UNI, AERO, Aave, Pump, and Sky. HYPE significantly outperforms, while most others are near or below their launch levels. Source: Castle Labs.
In Aave's case, they also lost over $23 million executing these buybacks due to falling asset prices. Their average purchase price for AAVE was $182, while it currently trades around $90, suggesting buybacks might not be the optimal path.
Nevertheless, buybacks remain one of the most consistent solutions for accumulating value for a token, as