






Bitcoin Bounce Hits Resistance: 69K USD Short-Term Holder Cost Basis Becomes Key Decision Point


- Core Thesis: Bitcoin has shown resilience amid improvements in macro and on-chain metrics, outperforming US equities for the second consecutive week. It is now approaching the critical decision zone of the $69,000 short-term holder cost basis. A breakout or rejection here will determine the subsequent trend.
- Key Factors:
- Macro-wise, core inflation declined for the first time in five months, providing policy room ahead of the FOMC meeting. However, the persistently high 10-year US Treasury yield (above 4.45%) remains an upside ceiling for risk assets.
- Bitcoin’s price is in a decision zone: the $69,000 level acts as resistance (short-term holder cost basis), while the area around $63,000 serves as the most significant demand support cluster on the chain.
- The supply structure near the current price is tilting towards support, and the profit-taking pressure needed for a sustained rally (proportion of short-term holder supply in profit) has not yet been met, indicating selling pressure is waning.
- Accumulation behavior has narrowed to a high-conviction cohort holding 1,000-10,000 BTC, lacking breadth. However, US spot Bitcoin ETF flows have shifted from net outflows to net inflows, providing spot buying support.
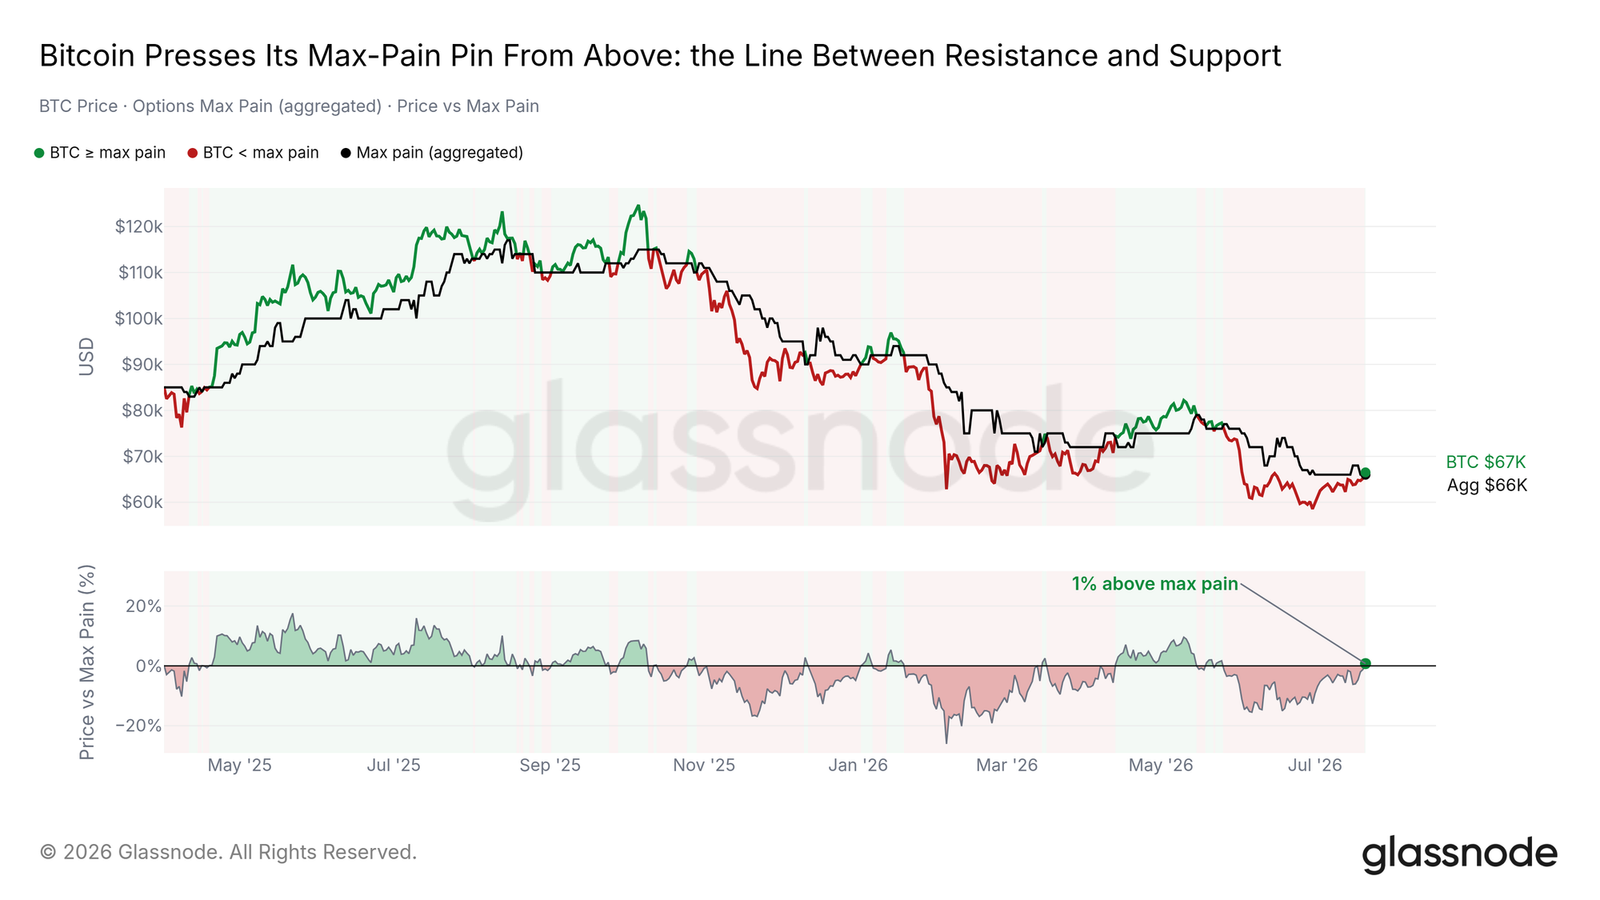
- Market sentiment has shown a positive shift: the price has moved above the option max pain point, short hedging positions have significantly decreased, and the put/call ratio has fallen to its year-to-date low.
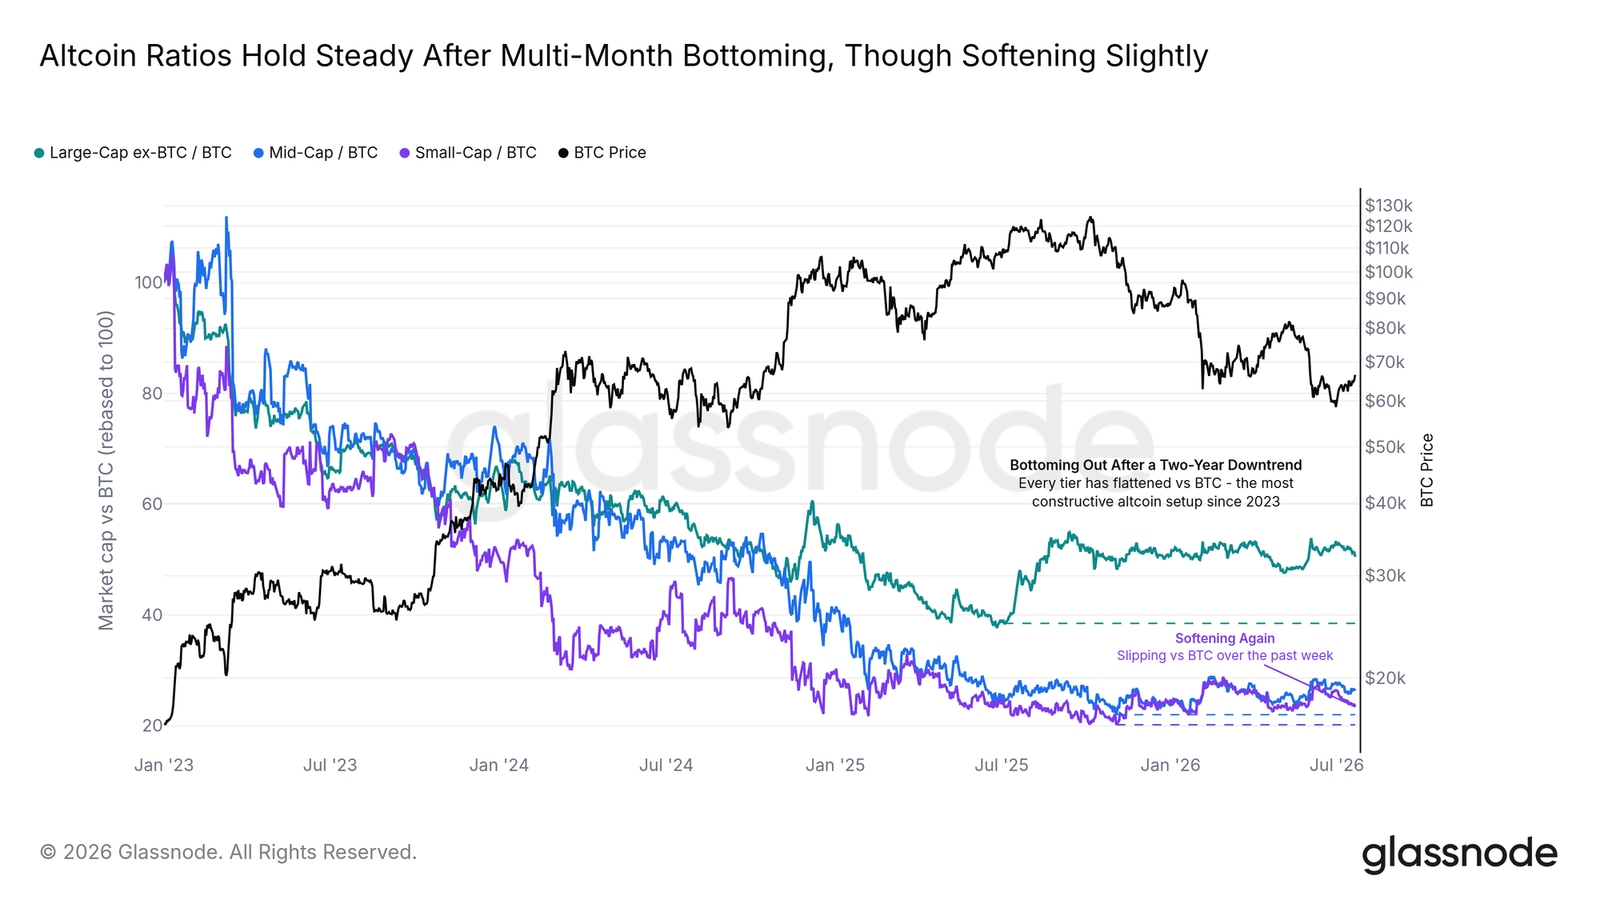
- Altcoins are weakening against Bitcoin again, with capital concentrating towards the leading asset, indicating a healthy rotation and a repair phase characterized by lower risk appetite.
Original Author: Glassnode
Original Translation: AididiaoJP, Foresight News
Summary
- Escalation of the situation in Iran triggered a surge in oil prices, with stock markets showing flat or declining performance; Bitcoin, however, absorbed the shock and outperformed both major stock indices for the second consecutive week.
- Core inflation data finally recorded a decline for the first time in five months, arriving just a week before the FOMC meeting, while the policy rate remains above inflation, maintaining a restrictive stance.
- The 10-year US Treasury yield has returned to elevated levels, while the US dollar remains relatively stable; the 'ceiling' jointly constructed by yields and the dollar has not yet been lifted.
- Price has entered a decision zone: above lies the short-term holder cost basis around $69,000, while below is the market's heaviest demand support cluster.
- Supply near the current price is tilting towards the support side. Net exchange inflows continue to weaken, and the profit-taking pressure needed to halt the rebound has not yet accumulated.
- Accumulation behavior has narrowed to a high-conviction cohort holding 1,000-10,000 BTC; breadth remains the missing link on-chain.
- On the off-chain front, signals consistently tracked in this report have finally materialized: ETF flows have turned positive, the price has surpassed the max pain level, and hedging positions have fallen to multi-month lows.
- Altcoins are weakening against Bitcoin once again, with capital concentrating towards the leading asset; the market compass readings also indicate: in recovery, yet still within a low risk-appetite range.
Macro Insights
Weathering the Oil Price Shock
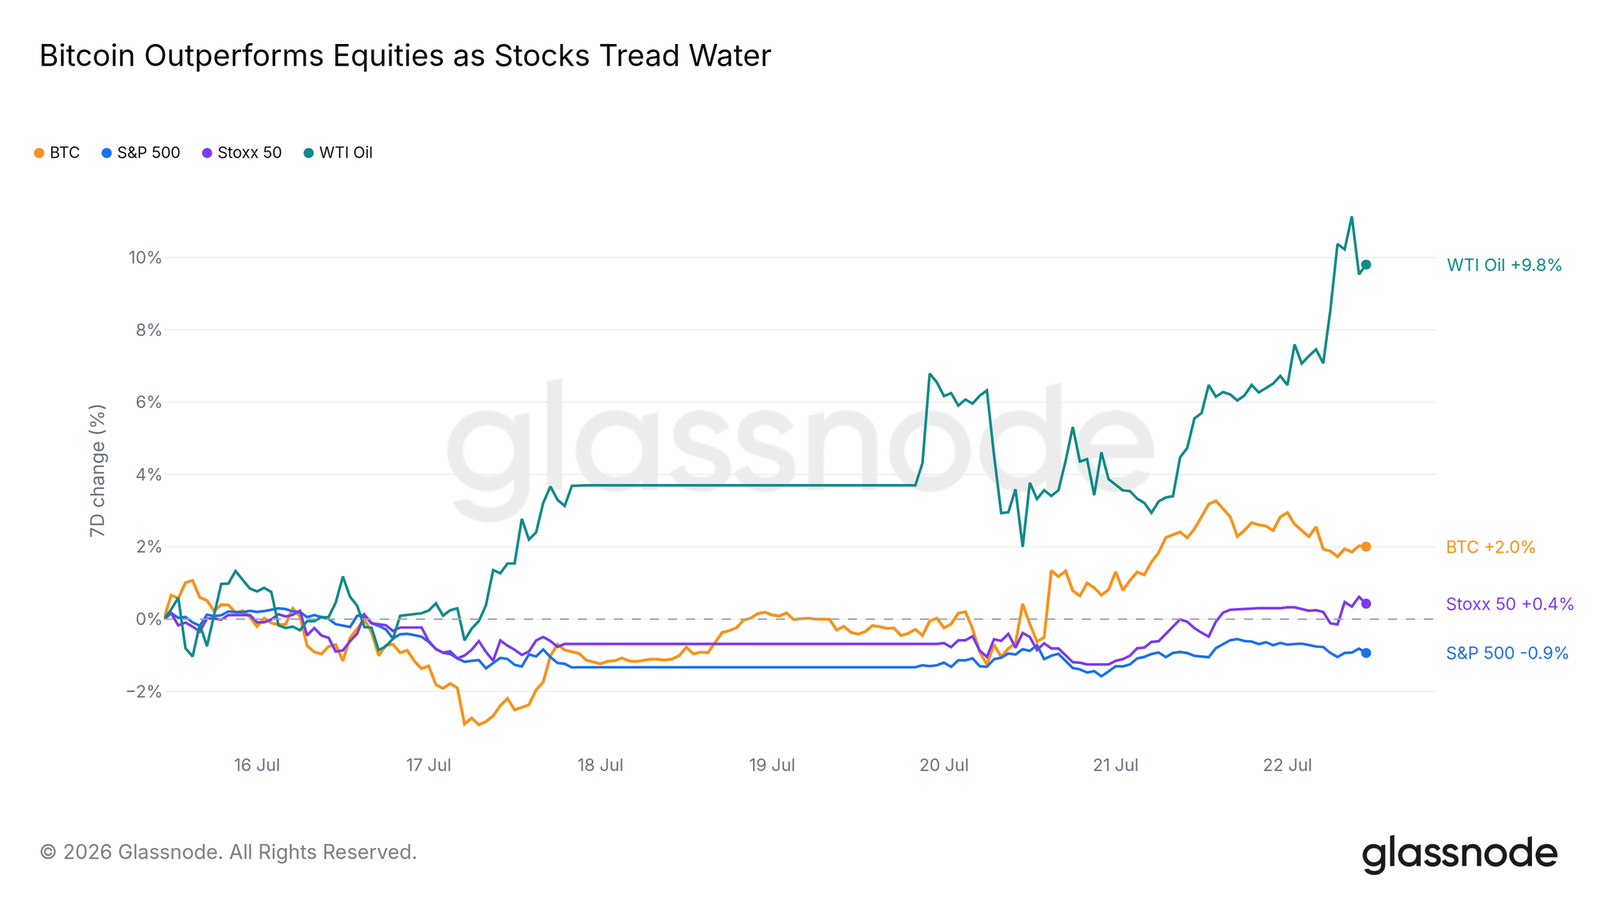
This week's macro test came from the oil market. WTI crude surged due to the escalation of the situation in Iran. Such external shocks typically drag down all risk assets. However, the stock market reacted mildly: the S&P 500 closed the week lower, while European stocks were flat. Bitcoin continued its upward trajectory amid the same shock, outperforming both major indices for the second straight week. A market that can still rise on bad news suggests marginal selling pressure is largely exhausted—this resilience itself is a signal.
Inflation Finally Bends
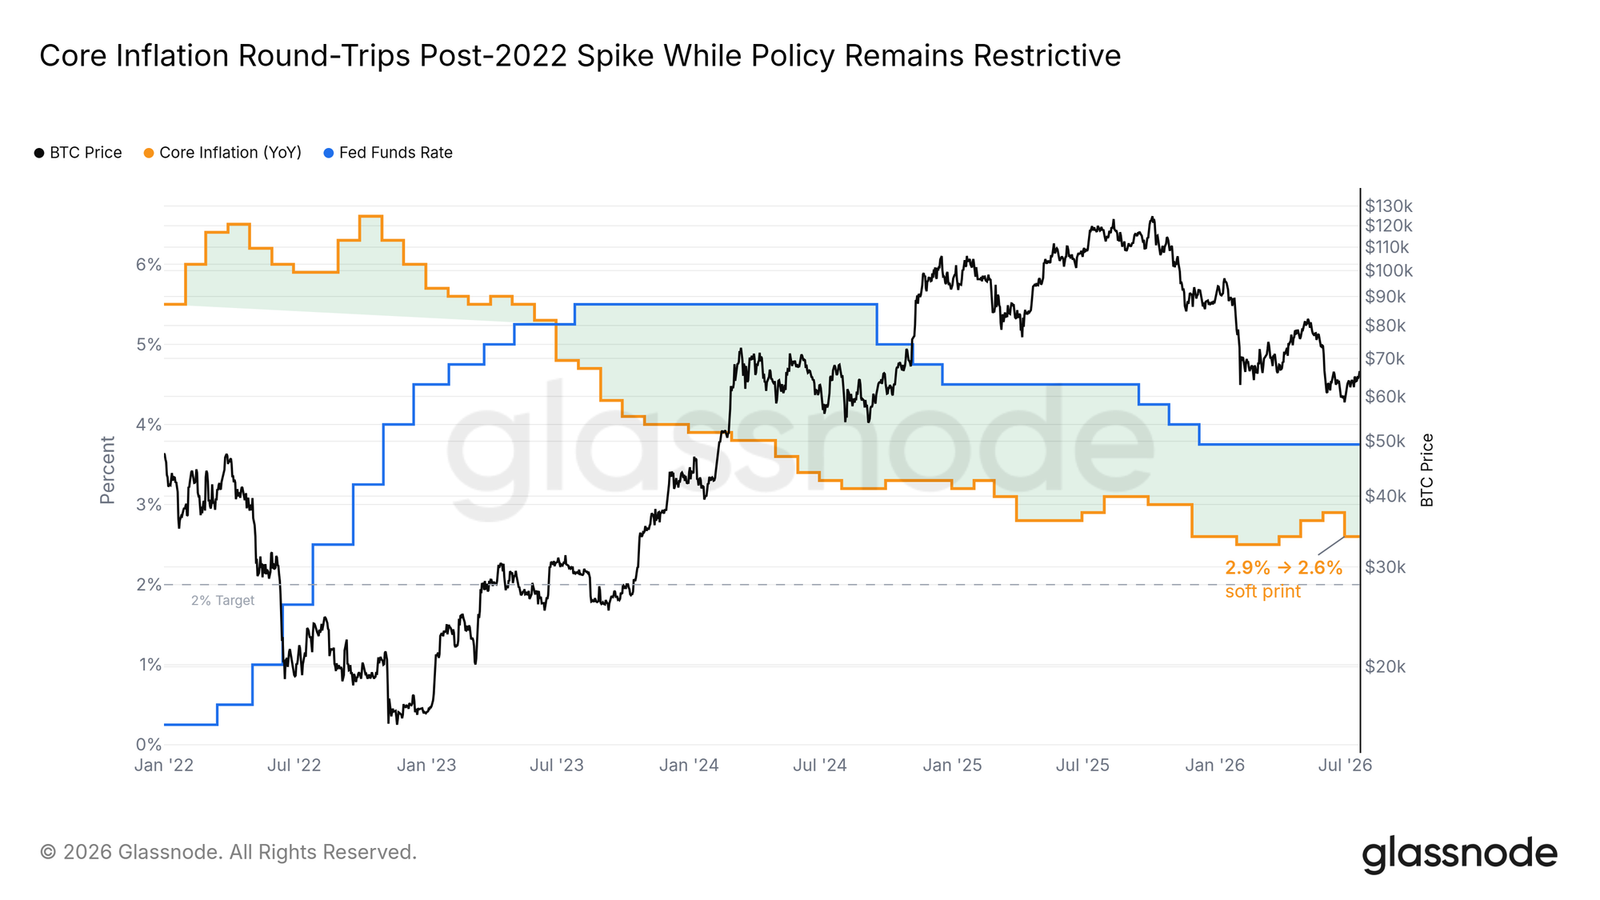
Core inflation recorded a decline for the first time in five months, reaching its closest reading to the target level since the 2022 peak. Although a single data point does not establish a trend, its timing is impeccable: when the FOMC meets next week, the federal funds rate will still be over 100 basis points higher than core inflation.
This gap is the defining feature of restrictive policy and provides the Fed with room to maneuver. A signal of rate cuts would remove one of the macro brakes tracked by this report throughout the year; continued silence would leave the market to rely solely on crypto-native momentum.
Yields Push Higher, Dollar Takes a Break
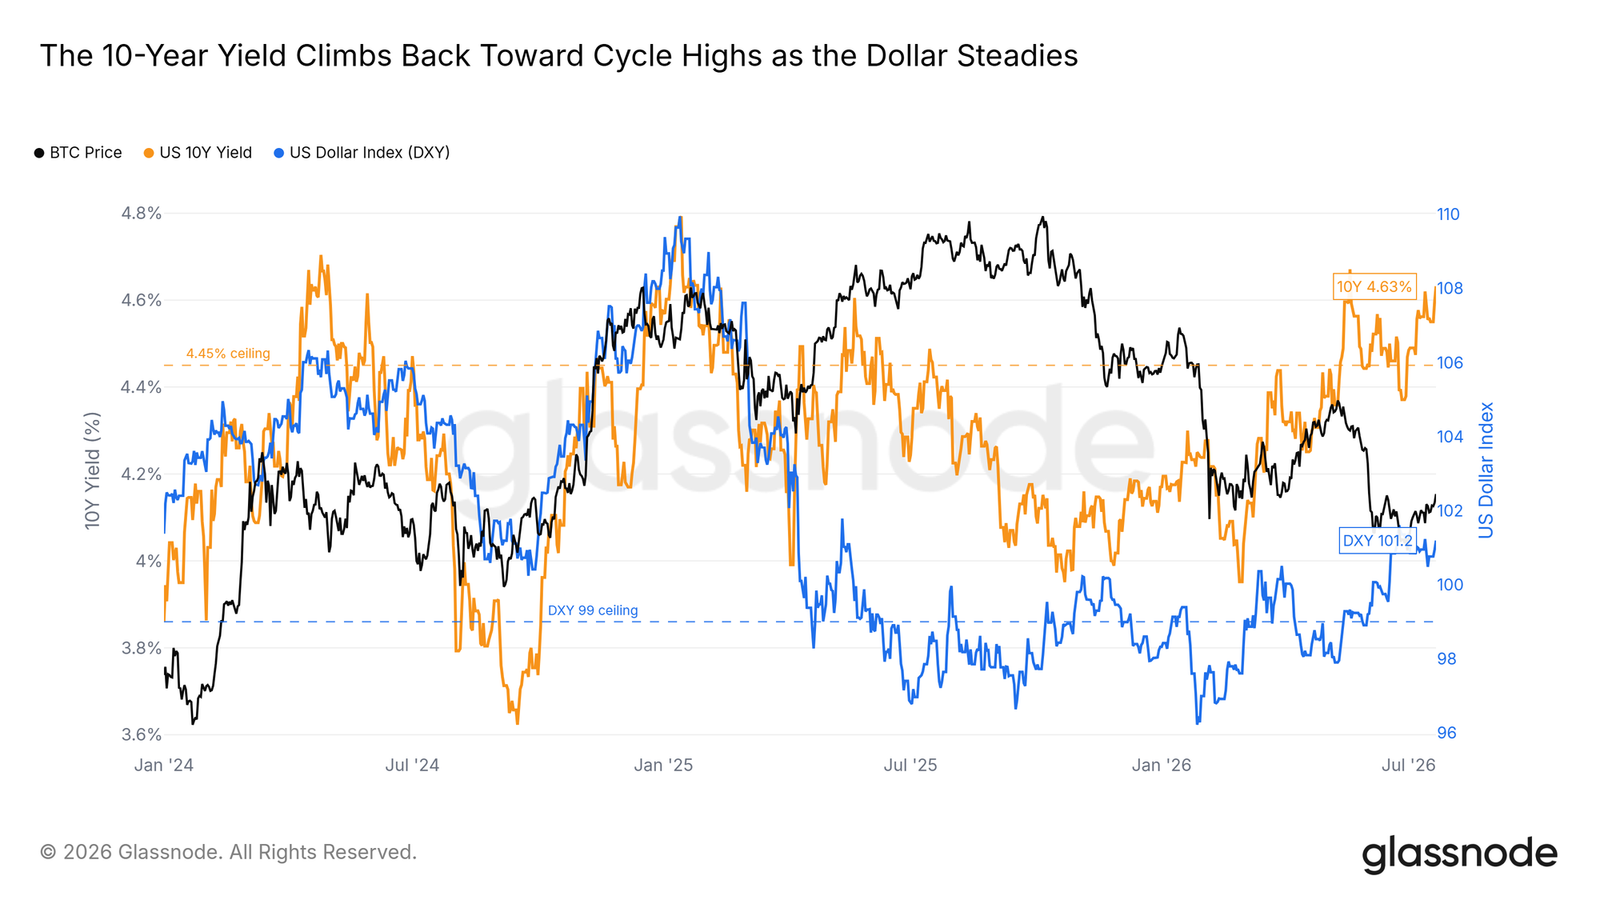
The bond market did not cooperate. The 10-year US Treasury yield has returned near its recent highs, continuing to pressure all risk assets; the US dollar, however, remains relatively subdued, far below its winter highs.
The upper ceiling for this cycle is clearly visible: the 10-year yield above 4.45% and the Dollar Index above 99. The dollar side is close to a breakout, but the yield side is not. A simultaneous break lower in both remains the key valve for a macro release.
On-Chain Insights
Entering the Decision Zone
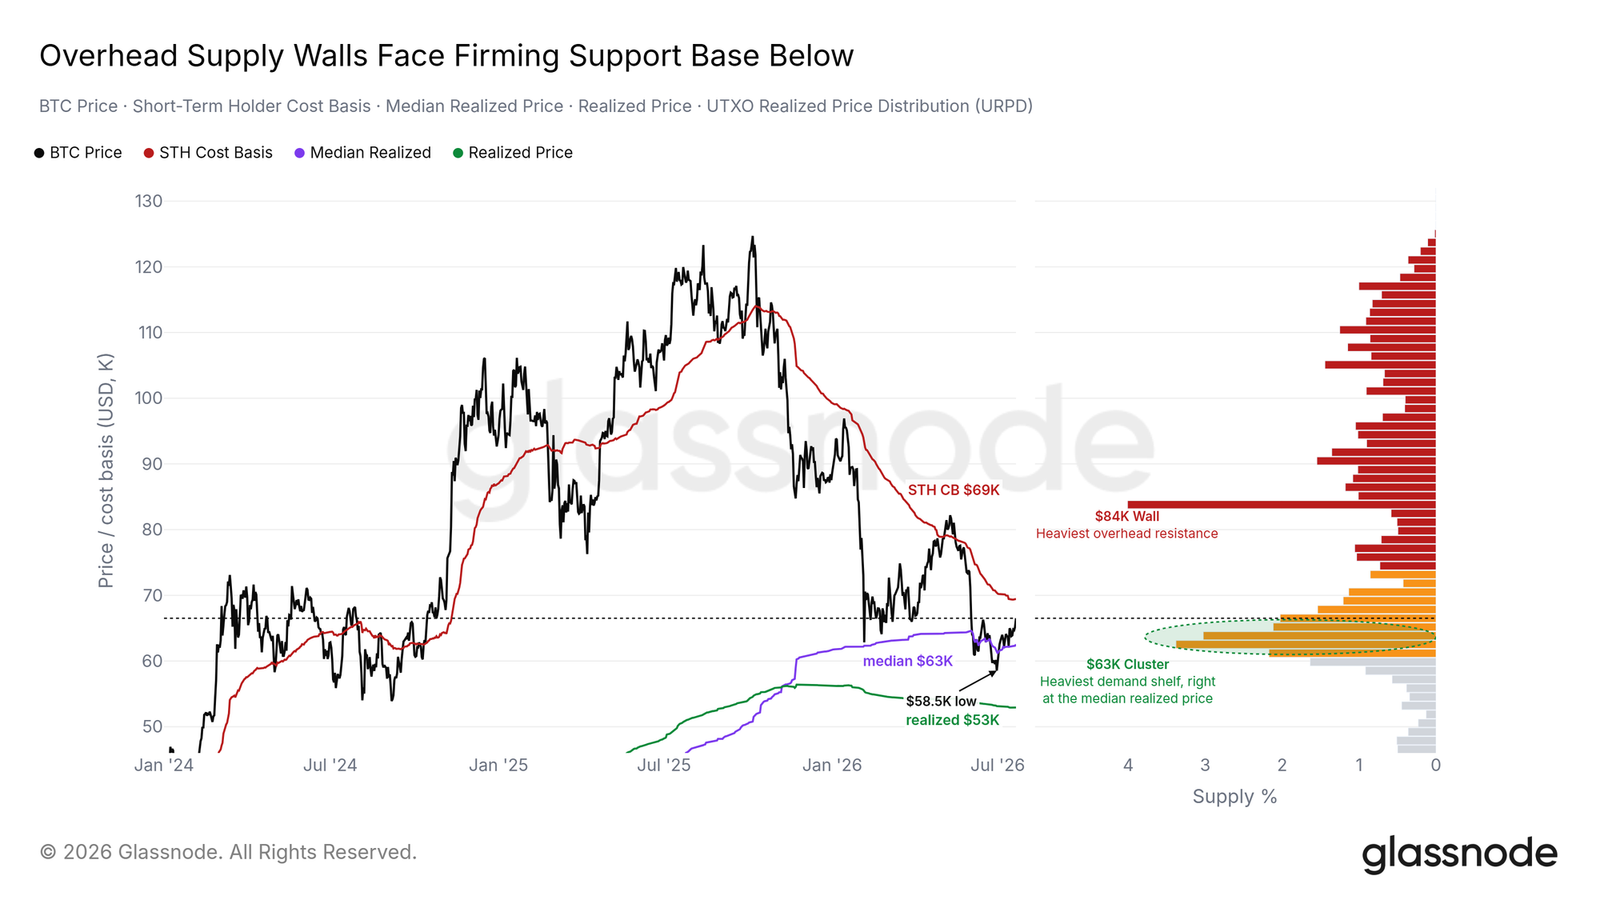
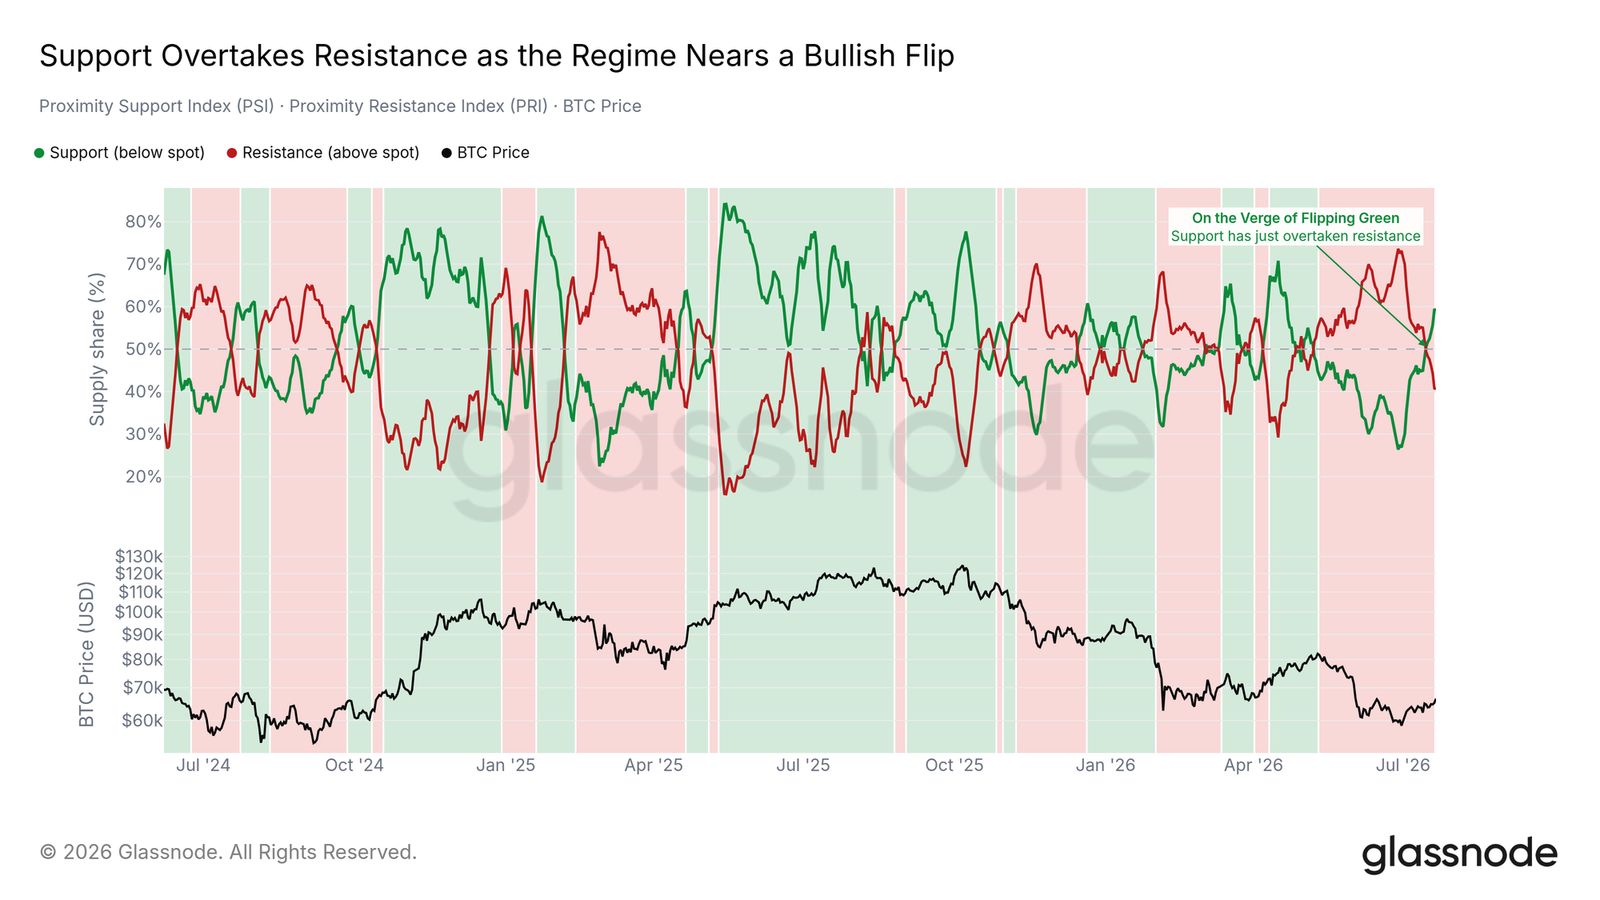
Following Bitcoin's rebound from the late June lows, the distribution of supply around the current price has become the core narrative. Above lies the short-term holder cost basis around $69,000—the breakeven line for buyers over the past five months. Below is the heaviest demand support cluster on the chart, representing roughly one-tenth of the total supply, concentrated near $63,000 (the median price of the last coin movement). The realized price floor sits much lower.
The asymmetry of this first wall is well known to the market: when approaching from below during a downtrend, the breakeven point of recent buyers often becomes a zone of selling pressure, as holders most eager to sell are about to break even. Once surpassed, an 'air pocket' forms above until roughly the $84,000 level. Successfully reclaiming this level suggests thin resistance in the zone above, allowing for rapid revaluation; failure would make the support cluster below the next target for testing.
Support Consolidates Towards the Test Zone
Supply near the price is taking sides. Distance-weighted cost basis data shows that near-price chips are divided into support below the current price and resistance above. The share of support has just surpassed that of resistance, marking a potential flip in the pattern dominated by resistance since spring.
Stalling the rebound requires selling pressure, and the fuel tank is not yet full. The classic trigger signal is the proportion of supply held in profit by short-term holders breaking above 54%—enough recent buyers to break even, enabling a significant sell-off. Currently, this metric is far from its threshold, and the short-term holder SOPR remains stable near the breakeven line rather than flipping downwards. Recent buyers are neither frantic nor exiting.
Selling Pressure Gradually Receding
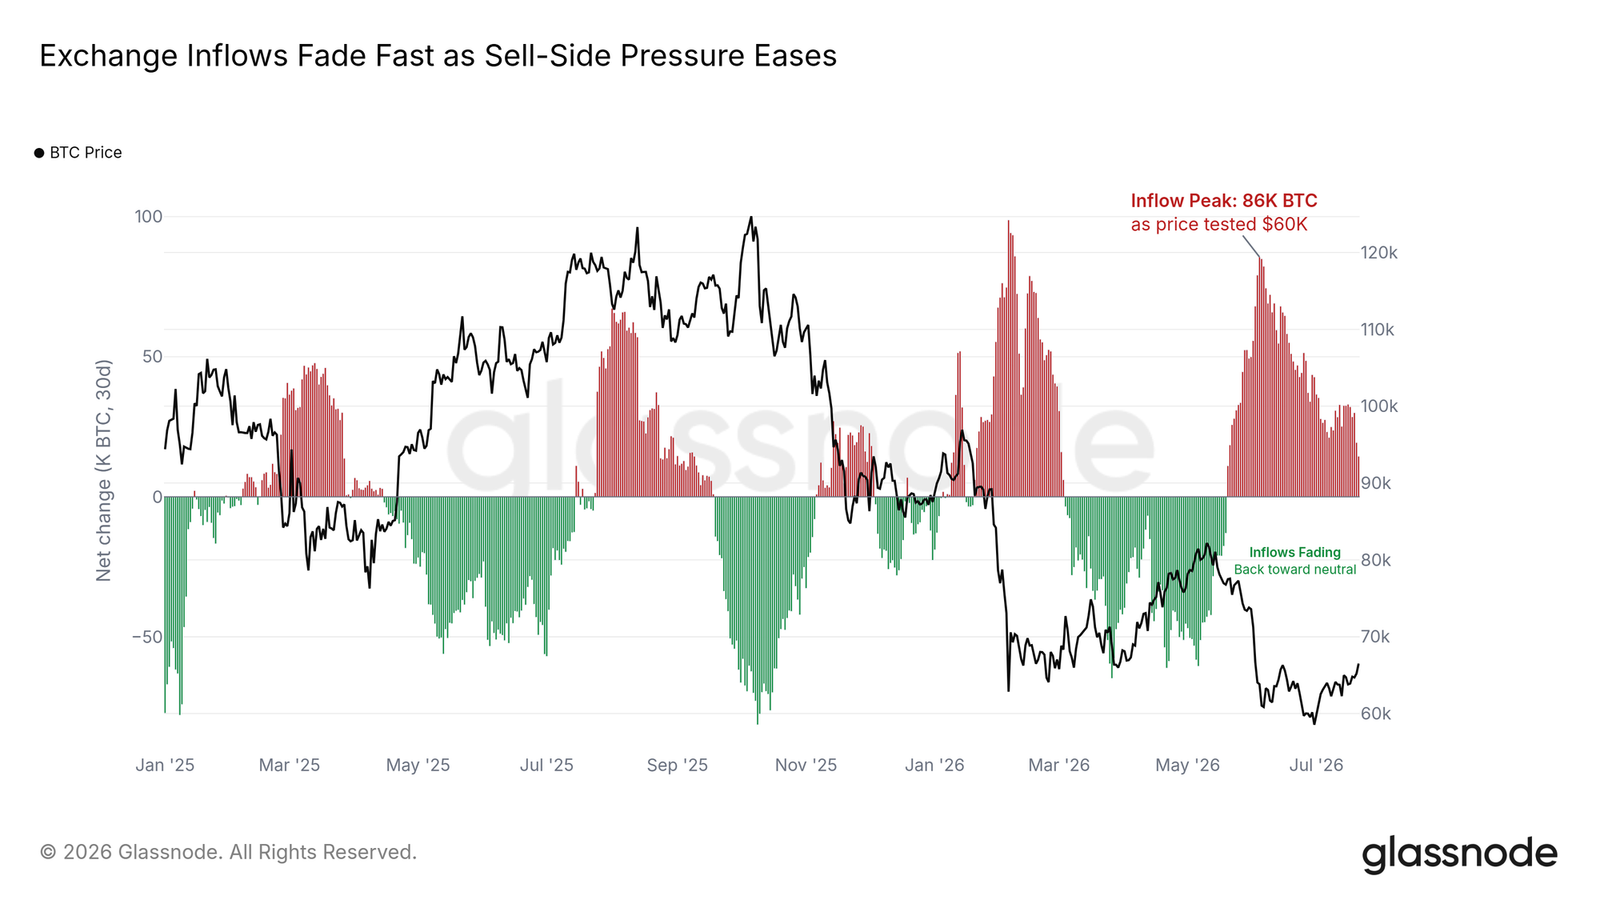
The exchange 'revolving door' has slowed. When the market broke down in early June, the net change in exchange positions saw significant net inflows—potential selling pressure arriving at trading venues. This wave of inflows has been weakening for several consecutive weeks and is now a mere fraction of its peak.
Weakening inflows without dominant outflows constitute a neutral pattern: demand is absorbing the incoming supply, but the structural withdrawal trend characteristic of a healthy market has not yet returned. A confirming signal to watch for is sustained net outflows—exactly the on-chain follow-through that the ETF channel has just begun to provide.
Conviction Concentrated, but Lacks Breadth
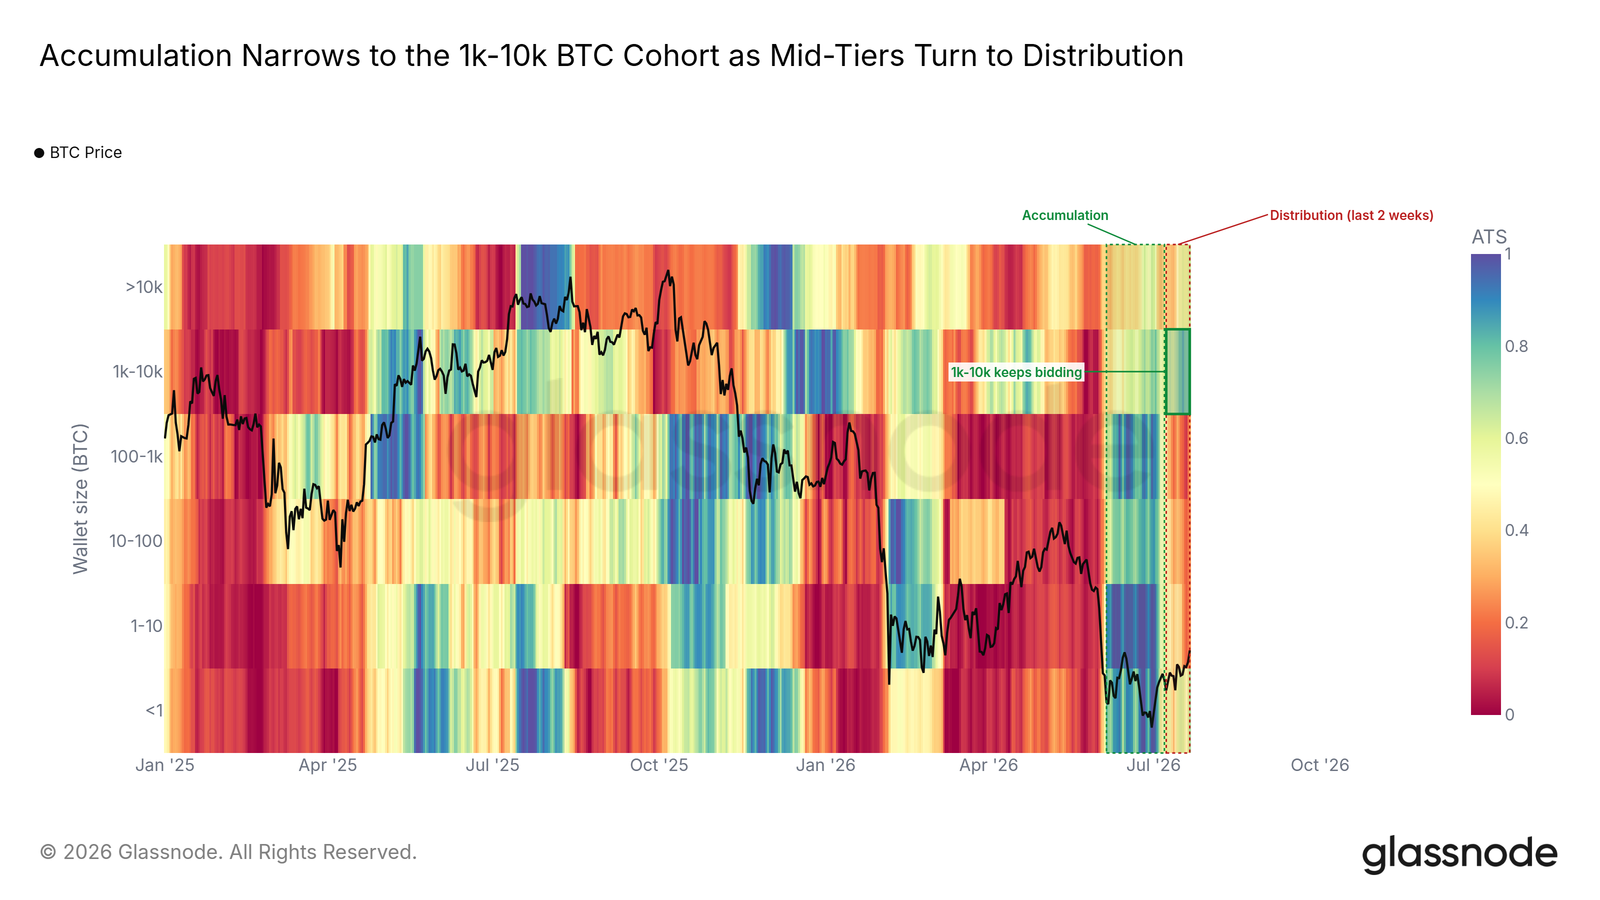
The June rebound was driven by broad accumulation: the accumulation trend score covered all wallet cohorts at the lows. The past two weeks have been different, with buying narrowing to the 1,000-10,000 BTC range—historically, these wallets often lead lasting turning points—while the middle-tier cohort has shifted back to distribution.
Concentrated accumulation has both pros and cons. The strong conviction of large, patient wallets has led recoveries many times before; however, a market structure underpinned by a single cohort is also thinner than one with participation across the board. When breadth returns during the next upward move, it will be the key to distinguishing between a squeeze and a genuine trend.
Off-Chain Insights
Redemption Streak Ends
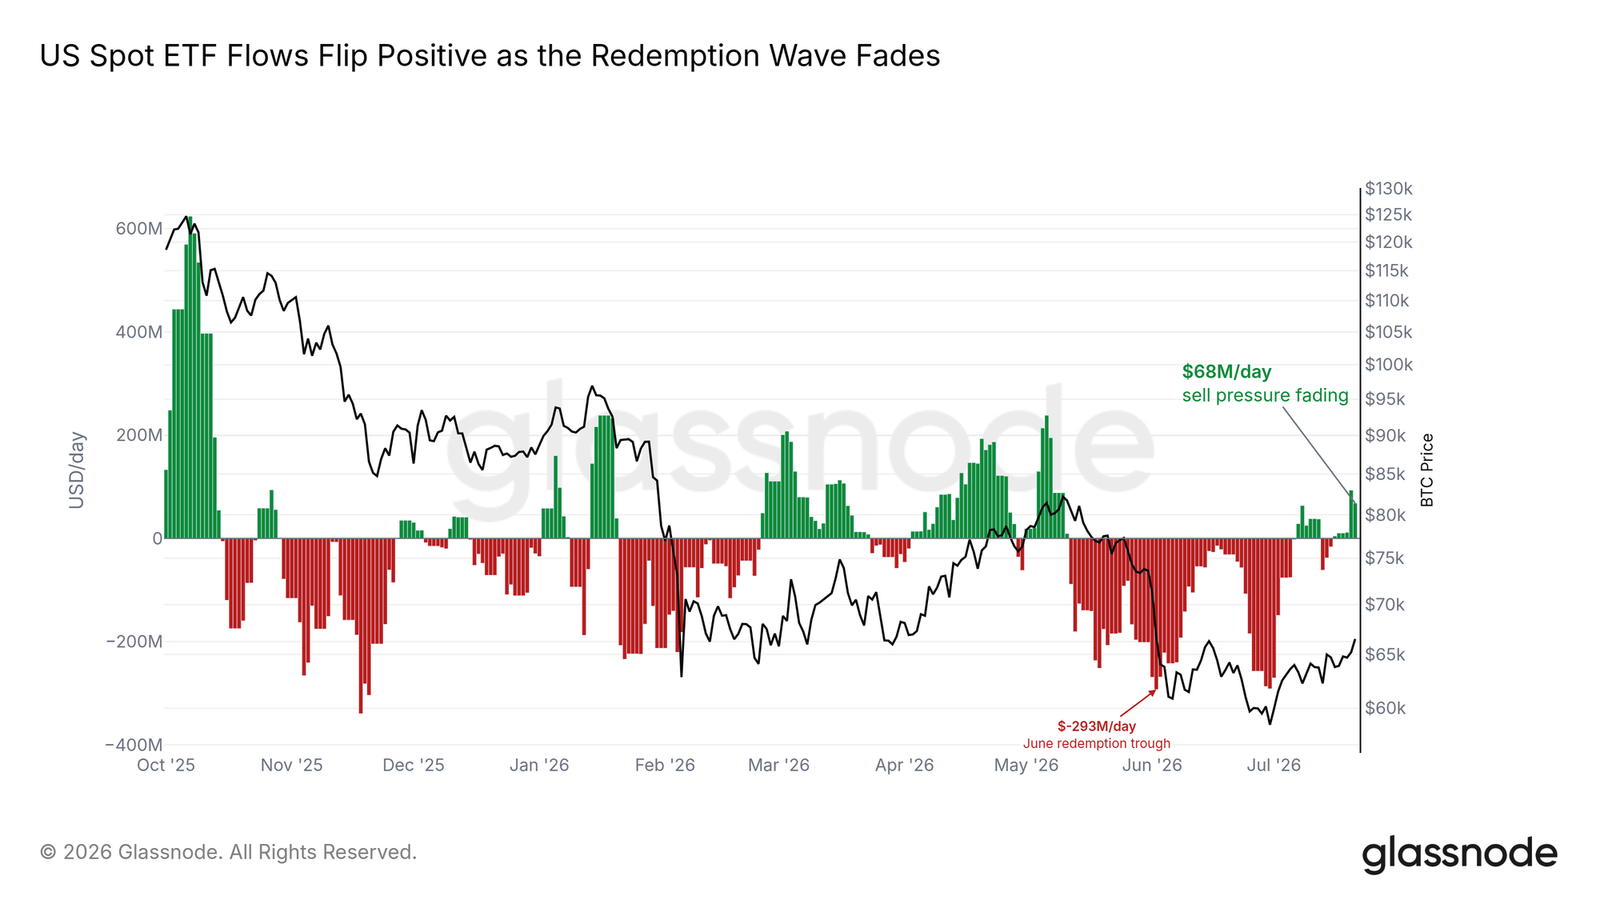
For weeks, every improvement came with the same caveat: optimism in derivatives, but persistent outflows from the ETF channel. Flows into US spot Bitcoin ETFs have turned positive, marking the first sustained net buying since the June redemption wave ended.
Last week's report noted that institutions had stopped fleeing but had not yet started buying. The flip is still in its early stages and moderate in size, but it transforms a purely derivatives-driven rebound into one backed by spot buying. Persistence, rather than scale, is the key metric to watch.
Above Max Pain
The max pain level—the price at which the most options positions expire worthless—served as overhead resistance throughout spring. Bitcoin approached from below last week and has now crossed this aggregate level, sitting well above its position during the February lows.
Historically, reclaiming max pain often coincides with the options market turning friendly, although the shift is usually gradual. If it holds above this level during the upcoming options expiry cycle, dealer hedging flows will act to dampen volatility rather than chase it, turning the 'pain point' from a ceiling into an anchor.
Hedge Unwinding, Shorts Squeezed
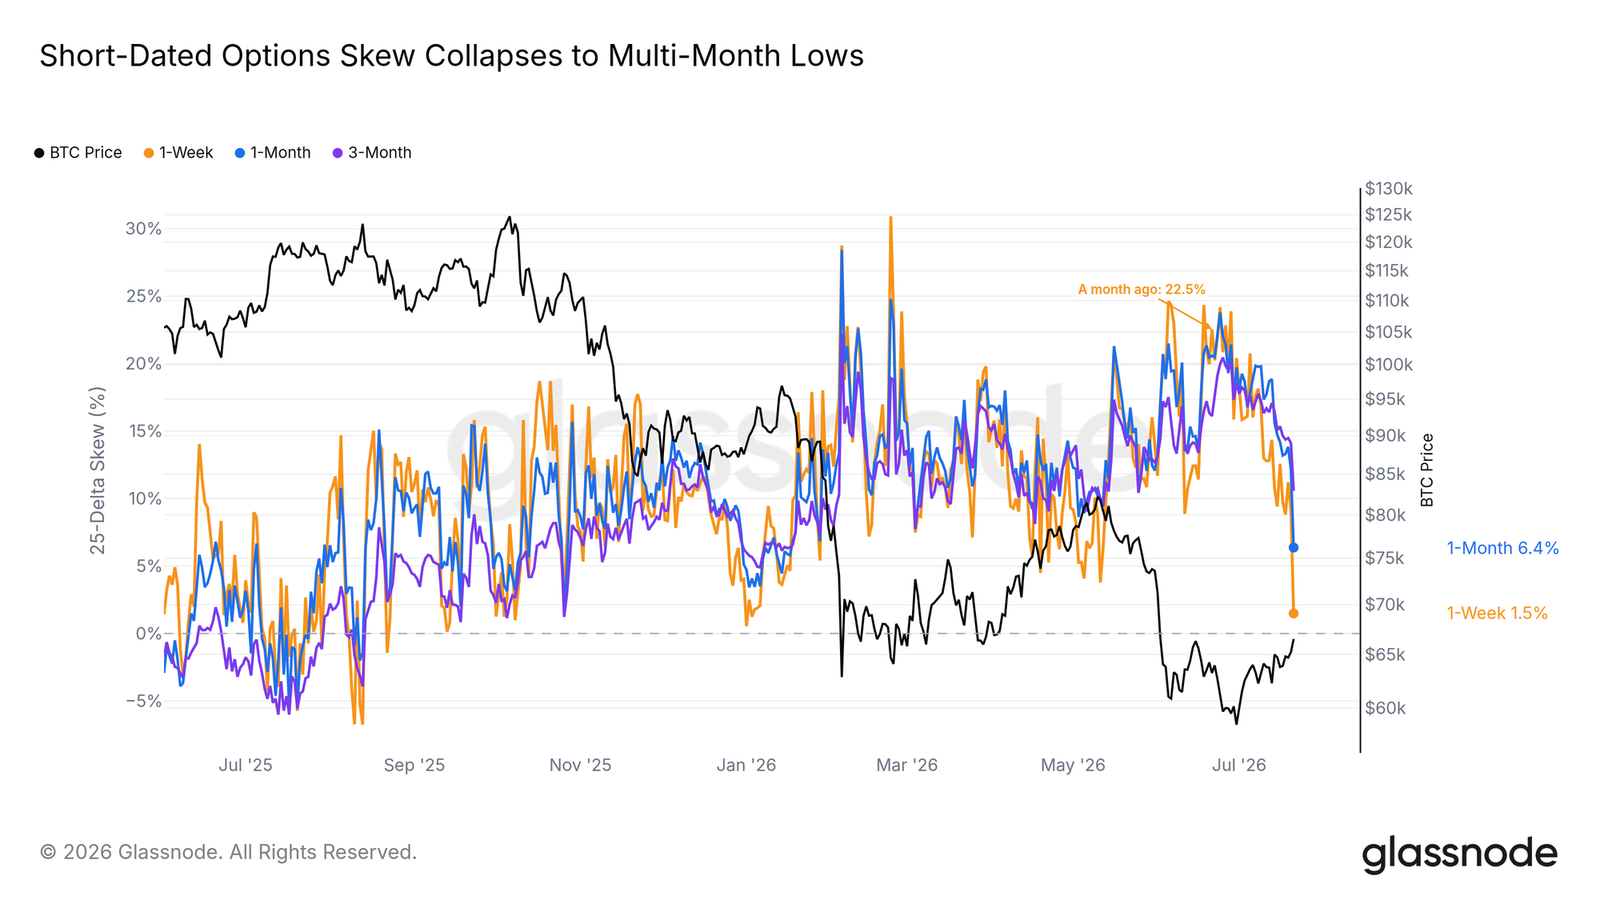
Since the June lows, each weekly report has tracked the same quiet process: traders closing shorts and letting downside protection expire. Now, the price action has loudly confirmed this. The one-week 25-Delta skew has plunged to multi-month lows, with front-end curves shedding downside protection the fastest, followed by the one-month tenor.
The put-call composite metric confirms the trend: the put-call ratio for options open interest has fallen to yearly lows, and the volume ratio has halved compared to the June hedging peak; perpetual swap funding rates have been below the neutral line daily for the past month.
This optimism stems from the unwinding of hedges, not the piling on of new leverage. Squeezes built on this combination tend to be milder during pullbacks than those driven by high funding rates.
Altcoins Bleeding, Bitcoin Leading
Beneath the surface, capital continues to favor the leading asset. Altcoins across all tiers have been weakening against BTC for years. This long-term decline flattened this spring, forming what appears to be the most constructive altcoin bottom during the bear market. Last week, this slow decline quietly resumed: as Bitcoin moved higher, smaller-cap coins conceded further ground against BTC.
This is a healthy version of rotation. Bitcoin leading first concentrates capital into the most liquid asset before spilling over; premature altcoin leadership is often a bubble sign. The sequence of a solid bottom holding and Bitcoin taking the lead is the correct order for a sustainable recovery.
Conclusion
Until proven otherwise, this remains a bear market rally, and the proving ground is clear. The squeeze has done everything a squeeze can do: hedges unwound, shorts covered, funding rates calm, and the ETF turned from a drag into support. But it has not yet cleared the overhead resistance. Bitcoin remains below the $69,000 short-term holder cost basis this week, with an air pocket above leading to the $84,000 level. Below sits the $63,000 demand support zone and the nascent support structure.
A decisive reclaim of the 69K level with sustained spot inflows would open the pocket above. A rejection accompanied by renewed exchange inflows would see the market fall back to test the support zone.


