
以太坊2026一季度回顾:链上活跃度创新高,代币化资产领跑全行业
- 核心观点:2026年一季度,以太坊链上使用规模(月活用户、交易量、吞吐量)创历史新高,但美元计价资产规模与手续费同步收缩,呈现“量升价跌”的两极分化态势。这源于主动扩容(如Fusaka升级与Blob参数优化)带来的交易成本下降,同时机构对代币化资产的布局加速,巩固了以太坊作为全球金融底层结算层的核心地位。
- 关键要素:
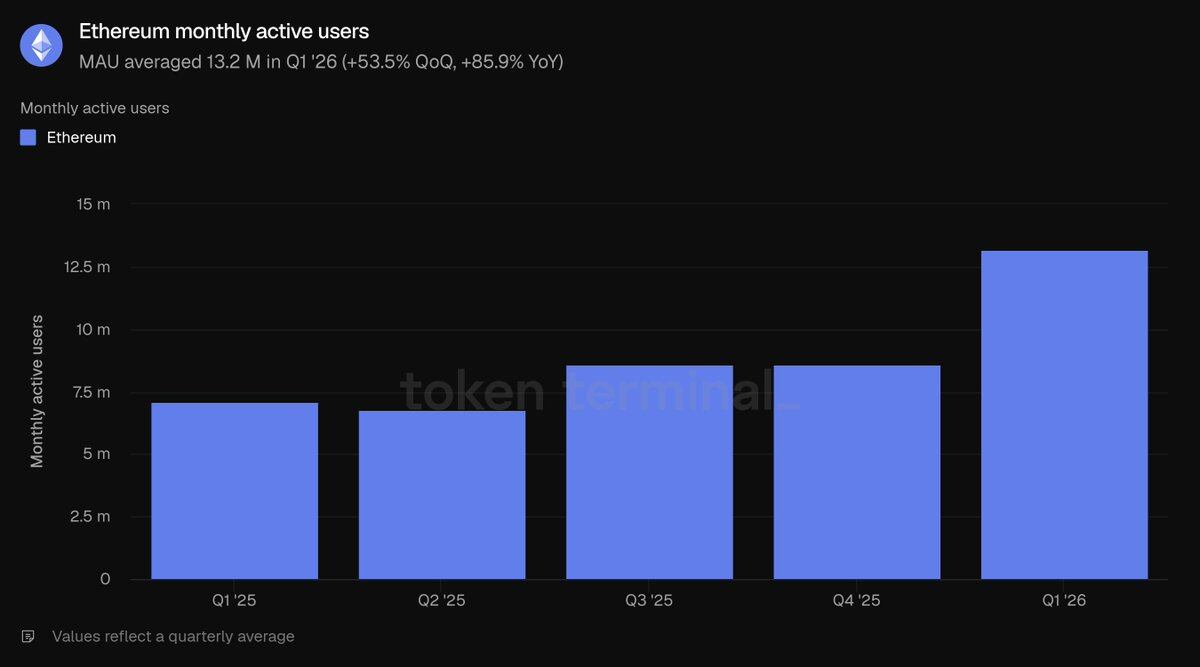
- 链上使用规模创新高:月活用户1320万(环比+53.5%),交易量2.004亿笔(环比+38%),TPS达25.78(环比+41.2%),均刷新纪录。
- 资产规模与收入下滑:总锁仓资产3162亿美元(环比-11%),ETH完全稀释市值2900亿美元(环比-30.3%),全生态手续费20亿美元(环比-16.9%),主网手续费3990万美元(环比-47.9%)。
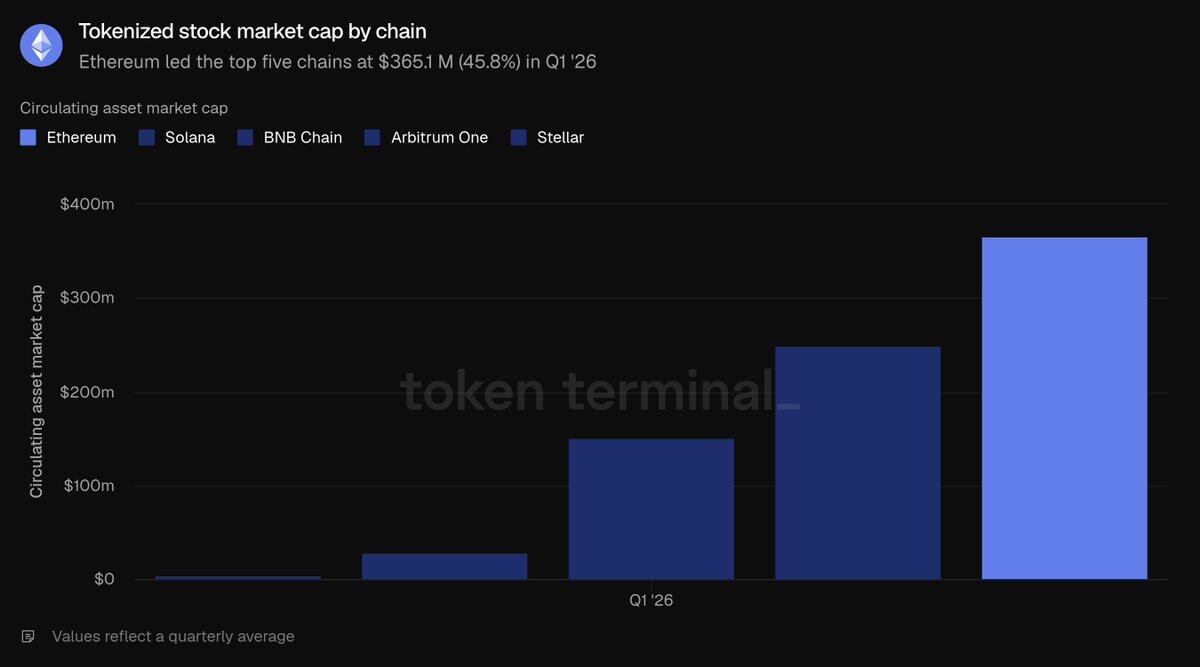
- 代币化资产类别分化:稳定币1789亿美元(环比-2.3%)、代币基金194亿美元(环比+4.9%)、大宗商品47亿美元(环比+60%)、股票3.651亿美元(环比+16.5%),以太坊在五大公链中主导所有细分赛道。
- 扩容策略驱动成本下行:Blob扩容提升区块容量,导致交易总量增38%而手续费缩水近五成,体现杰文斯悖论;团队预判长期需求增长将覆盖短期收入损失。
- 机构布局加速:贝莱德、摩根大通、富达等发行链上基金;欧洲12家银行联盟筹备合规欧元稳定币,推动以太坊成为机构首选结算网络。
- 质押与持有者指标稳健:ETH质押比率升至0.31,持有地址达2.928亿个(环比+8.1%),表明市场下跌时用户长期信心未动摇。
- 生态结构与优势:以太坊占五大公链总锁仓71%、借贷79.2%、稳定币61.8%、代币基金73%、大宗商品84%,流动性、可组合性与机构案例形成壁垒。
Original Author: Token Terminal
Original Translation: Saoirse, Foresight News
Ethereum is the core underlying settlement network for on-chain assets, relying on ETH for gas fees and staking to maintain network security. Traditional finance suffers from slow settlement, numerous intermediaries, and high counterparty risk, while tokenized assets and stablecoins offer on-chain solutions. As relevant regulations mature between 2025 and 2026, institutional布局 for on-chain business has officially reached a viable stage.
Various stablecoins, tokenized funds, commodities, and on-chain stocks are issued and settled on Ethereum. Layer-2 networks分流 transactions returning to Layer 1 for final settlement, allowing ETH to continuously accrue value. By market capitalization, Ethereum remains the world's primary platform for tokenized assets, operated jointly by the Ethereum Foundation and the developer community. Teams like Etherealize specifically bridge traditional financial institutions, driving institutional capital inflow. In Q1 2026, the Ethereum ecosystem exhibited a bifurcated trend, detailed below with comprehensive data from Token Terminal.
The market in Q1 2026 presented a starkly contrasting picture: on-chain usage reached all-time highs – monthly active users, total transactions, and throughput all set new records; however, USD-denominated asset sizes and fee metrics contracted simultaneously, with fully diluted market cap, total value locked, trading volume, and both fee categories declining quarter-over-quarter. Key events this quarter profoundly shaped this unique market dynamic:
In January, the second round of the Fusaka upgrade cycle, solely the Blob Parameter Change (BPO#2), was implemented, significantly enhancing data storage capacity.
In February, the ERC-8004 standard went live on mainnet, becoming the general standard for AI agent identity and credit rating.
The Ethereum Foundation defined three core goals for the 2026 protocol: scaling, optimizing user experience, and reinforcing Layer 1 underlying security.
In March, the Institutional Ethereum Forum was held, with significantly increased participation from traditional financial institutions.
Q1 2026 Core Metrics Overview
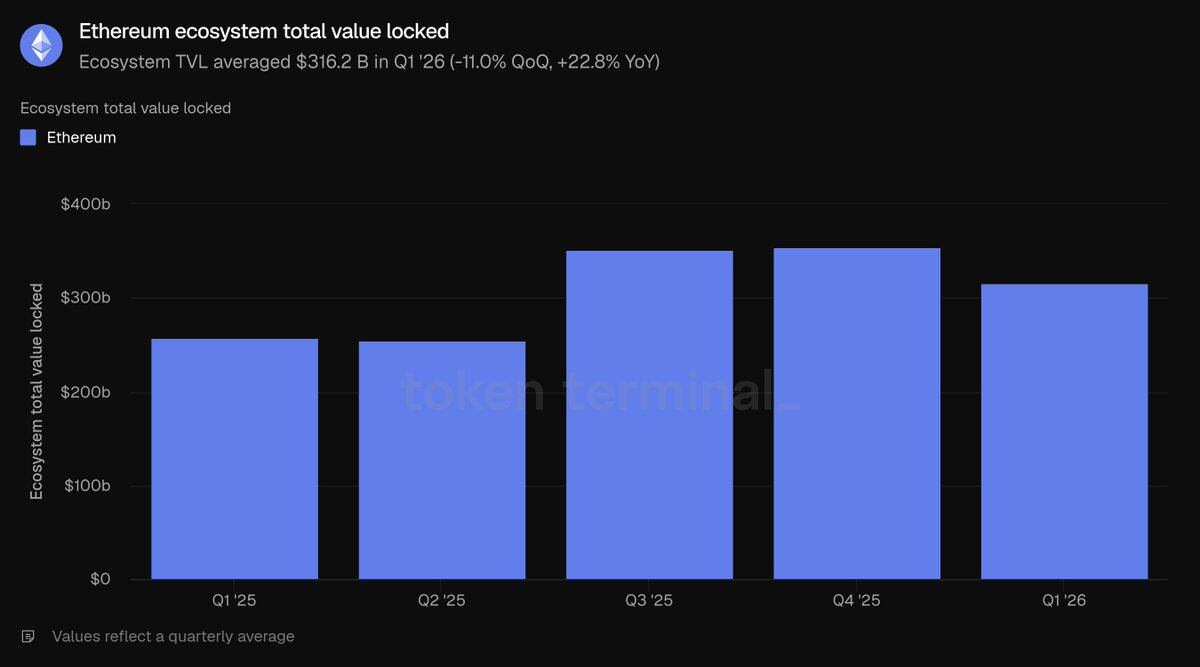
Ecosystem Total Value Locked (TVL): $316.2 billion (QoQ: -11.0%, YoY: +22.8%)
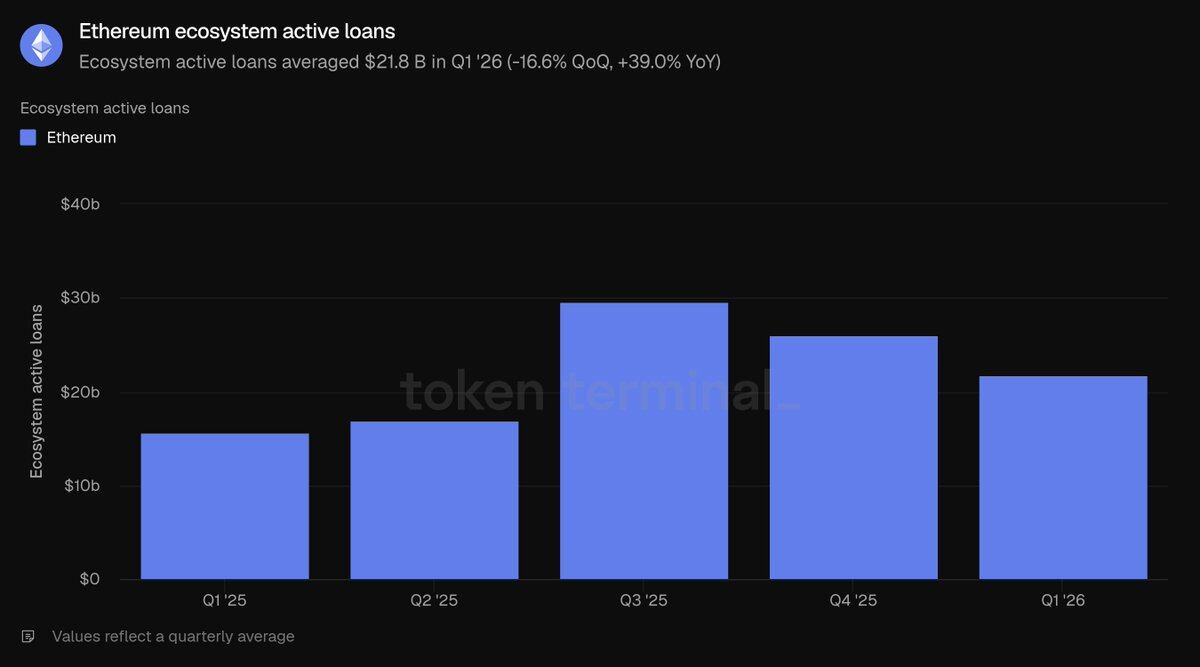
Active Outstanding Ecosystem Loans: $21.8 billion (QoQ: -16.6%, YoY: +39.0%)
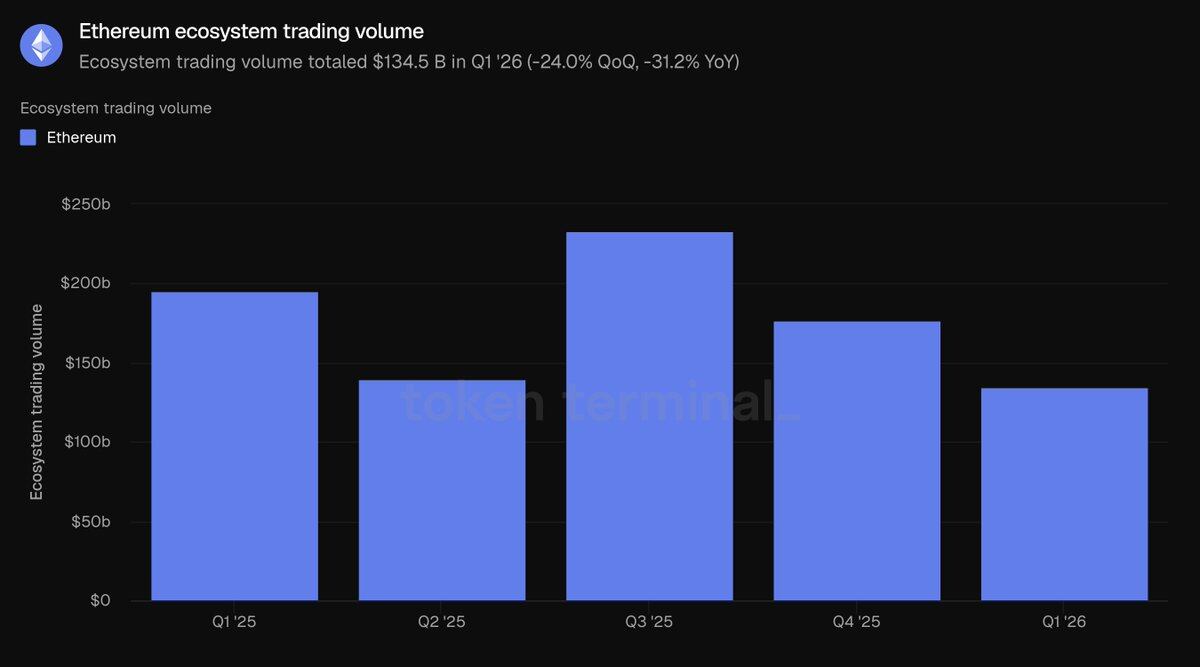
Total Ecosystem DEX Trading Volume: $134.5 billion (QoQ: -24.0%, YoY: -31.2%)
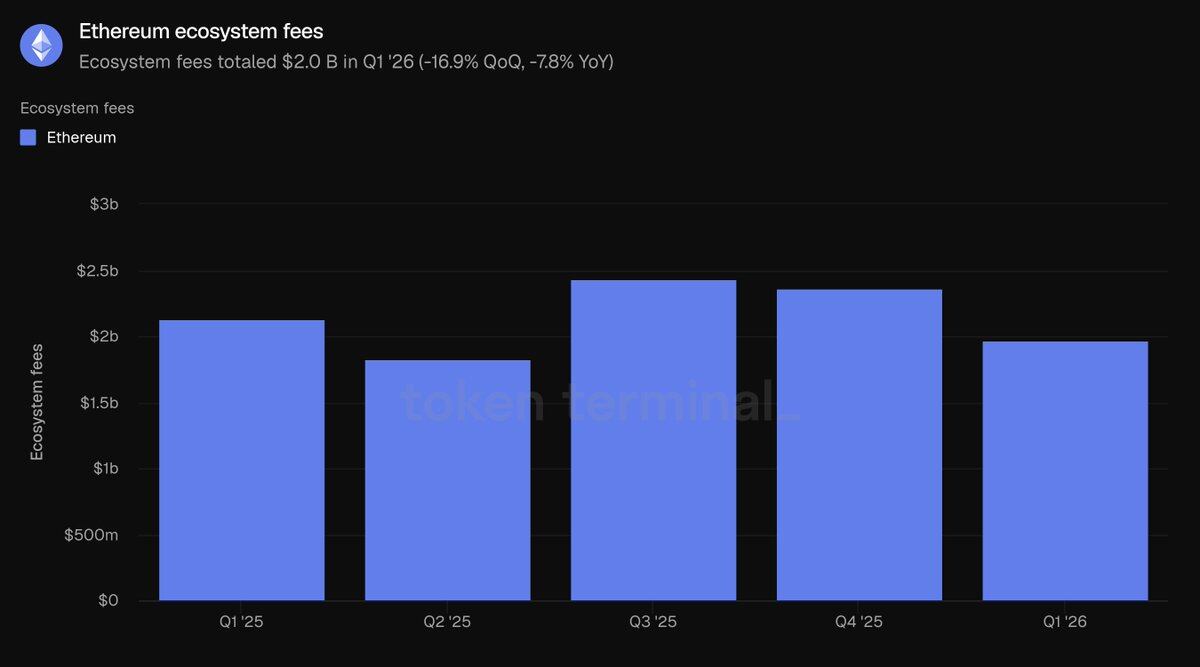
Total Ecosystem Application Fee Revenue: $2.0 billion (QoQ: -16.9%, YoY: -7.8%)
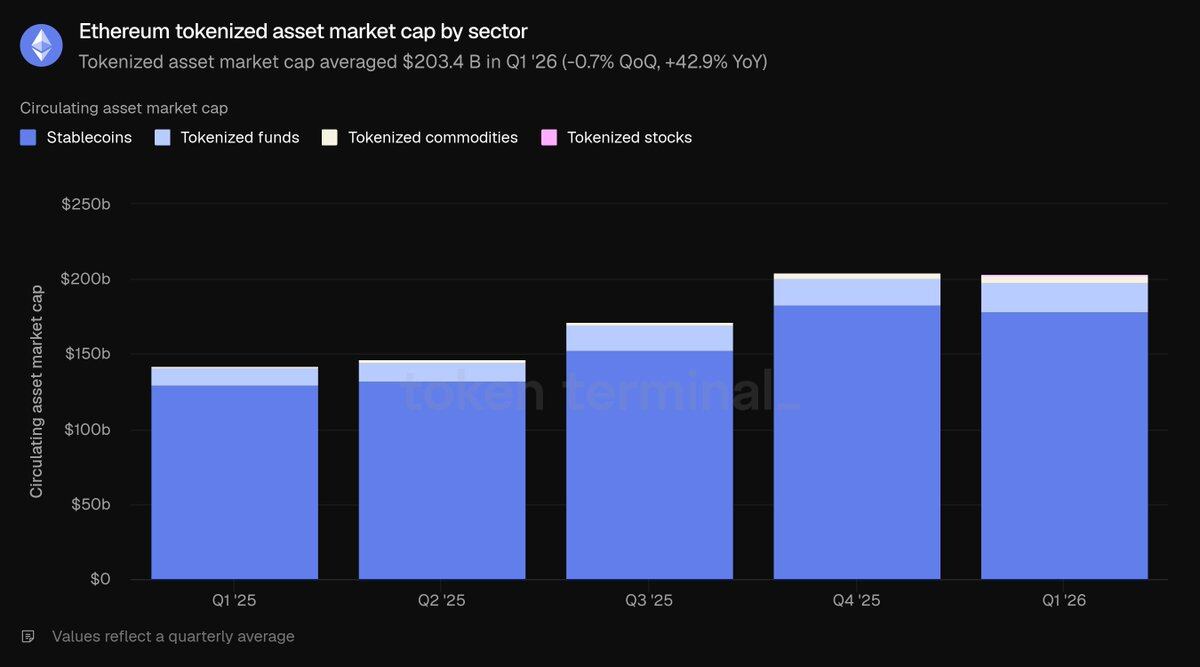
Total Market Cap of On-Chain Tokenized Assets: $203.4 billion (QoQ: -0.7%, YoY: +42.9%)
Stablecoins: $178.9 billion (QoQ: -2.3%, YoY: +37.6%)
Tokenized Funds: $19.4 billion (QoQ: +4.9%, YoY: +73.1%)
Tokenized Commodities: $4.7 billion (QoQ: +60.0%, YoY: +325.9%)
Tokenized Stocks: $365.1 million (QoQ: +16.5%)
Monthly Active User Addresses: 13.2 million (QoQ: +53.5%, YoY: +85.9%)
Total Layer 1 Transaction Count: 200.4 million (QoQ: +38.0%, YoY: +81.5%)
Average Transactions Per Second (TPS): 25.78 (QoQ: +41.2%, YoY: +81.7%)
Total Layer 1 Mainnet Transaction Fee Revenue: $39.9 million (QoQ: -47.9%, YoY: -81.9%)
ETH Fully Diluted Market Cap: $290 billion (QoQ: -30.3%, YoY: -9.9%)
ETH Staking Ratio: 0.31 (QoQ and YoY increase of 0.03)
Total ETH Holding Addresses: 292.8 million (QoQ: +8.1%, YoY: +24.9%)
Note: The statistics in this report cover only the Ethereum Layer 1 mainnet. Layer-2 networks are treated as independent blockchains, and their related data is not included in the Ethereum statistical scope.
Overall Ecosystem Development
Total Value Locked (TVL) refers to the total USD value of assets deposited into various on-chain applications. It is a leading indicator for revenue-generating activities like lending, trading, and staking. This metric tracks the total on-chain capital within the Ethereum ecosystem that users can withdraw at any time. In Q1 2026, the average TVL of the Ethereum ecosystem reached $316.2 billion, down 11.0% QoQ but up 22.8% YoY. The QoQ decline is attributed to the overall price correction in crypto assets, while the significant YoY growth demonstrates substantial ecosystem expansion compared to the same period last year.
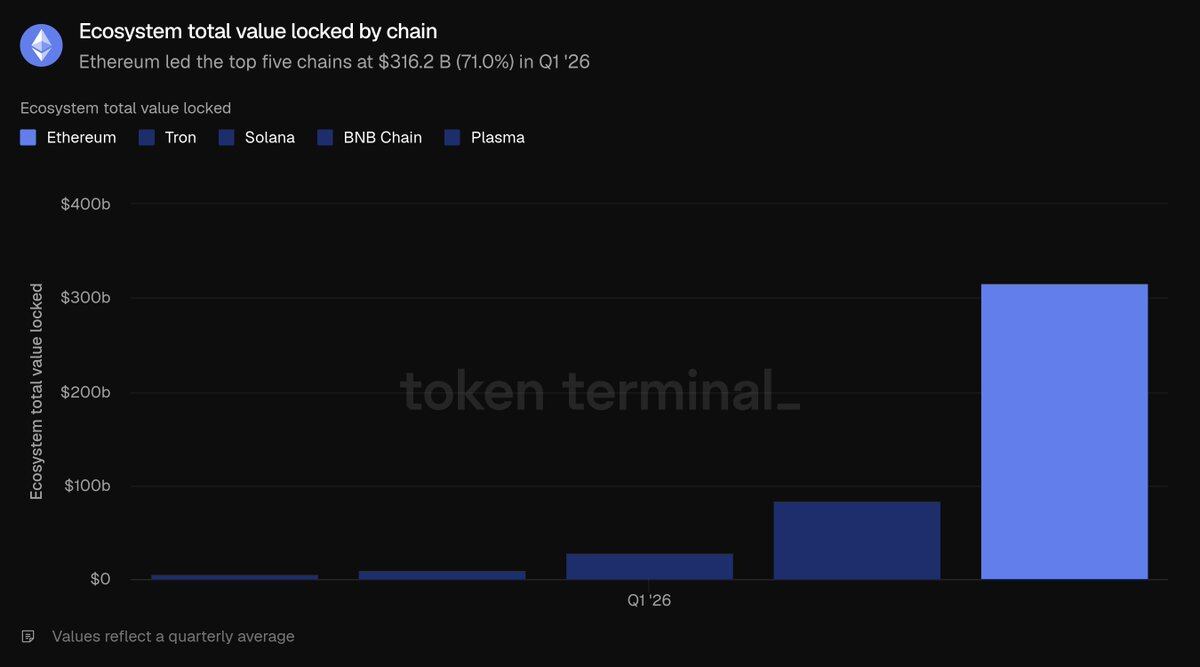
Among the top five major public chains, Ethereum's TVL holds a dominant lead: $316.2 billion far exceeds the combined total of TRON ($84.5B), Solana ($28.8B), BNB Chain ($10.3B), and Plasma ($5.7B), accounting for 71% of the total TVL across these five chains. Capital is concentrated in two primary sectors: liquid staking, led by Lido, and lending, centered around Aave; restaking protocols like EigenLayer and ether.fi, as well as synthetic dollar stablecoin platforms like Ethena and Sky, also hold significant capital. This high capital concentration is Ethereum's most prominent structural advantage.
The Active Outstanding Loans metric represents the value of deposits that users have lent out to earn interest income, directly reflecting lending business revenue. This metric tracks the total outstanding loans across all Ethereum lending applications. In Q1, the average active loan balance was $21.8 billion, down 16.6% QoQ but up 39.0% YoY. The contraction in loan balances alongside TVL indicates a cooling of overall market risk appetite, though the scale remains significantly higher than the same period last year.
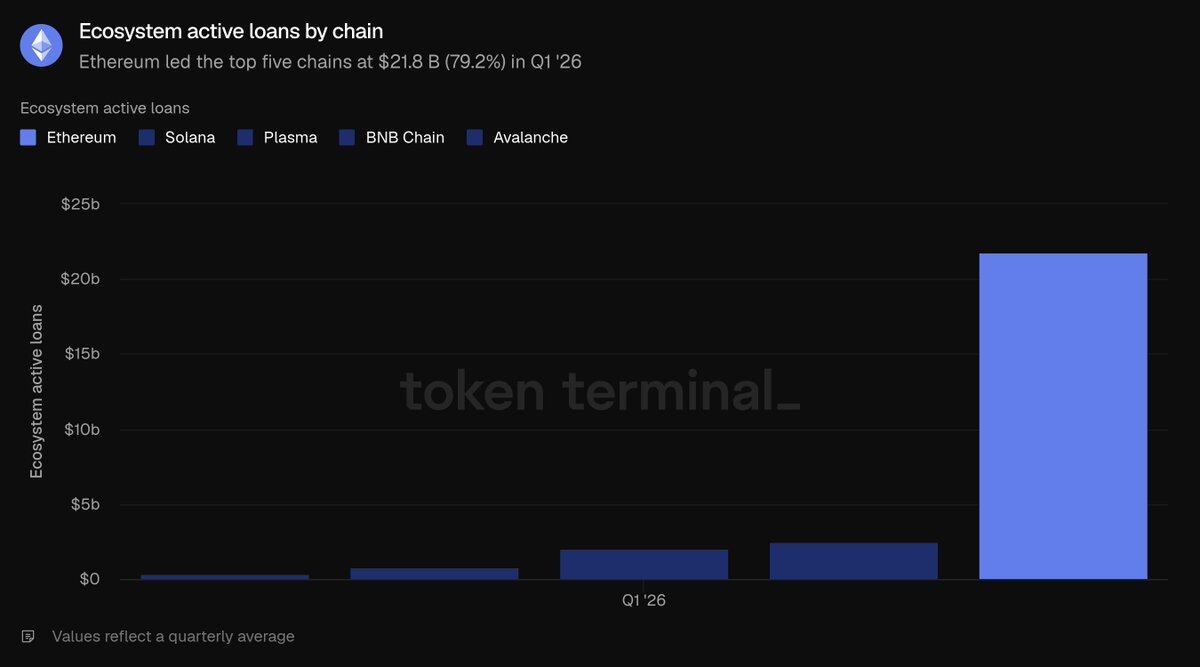
The Ethereum lending market is concentrated within a few major pools, with Aave dominating: at the end of Q1, its active loan balance was approximately $13.5 billion, holding the vast majority of the ecosystem's share. It was followed by Morpho (~$1.9B), Spark under Sky (~$1.0B), and Maple (~$0.84B). The QoQ contraction in lending was primarily driven by Aave, as the decline in crypto asset prices led to reduced lending demand, with its total lending volume contracting by about 24%. Comparing horizontally across the top five public chains, Ethereum's $21.8 billion in active loans vastly outpaces Solana ($2.5B), Plasma ($2.1B), BNB Chain ($0.7608B), and Avalanche ($0.3924B), capturing 79.2% of the total lending across these five chains – the highest sector share for Ethereum.
Decentralized Exchange (DEX) trading volume refers to the total value of transactions completed on on-chain spot exchanges. Traders pay fees when transacting, and volume is highly correlated with platform revenue. This data aggregates all DEX trading activity within the Ethereum ecosystem. In Q1, total ecosystem trading volume was $134.5 billion, down 24% QoQ and 31.2% YoY. The steeper decline in volume compared to the contraction in TVL confirms a significant reduction in market risk appetite during this quarter's asset downturn.
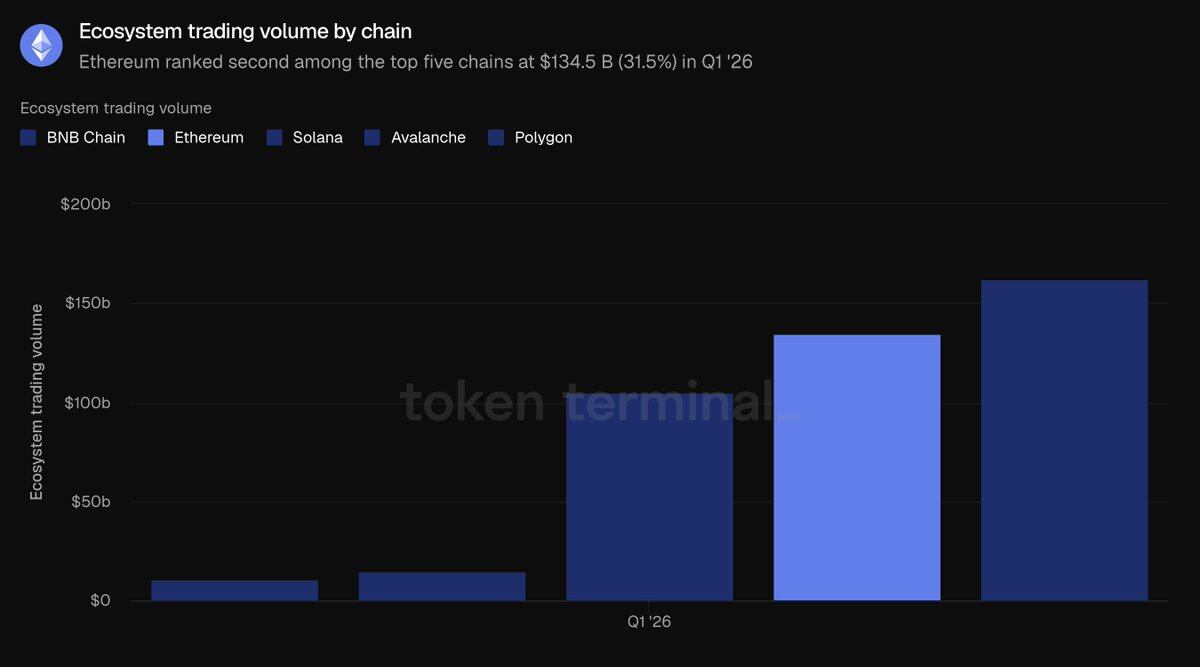
Ethereum DEX trading flow is highly concentrated on top platforms: Uniswap processed approximately $85.5 billion in Q1 volume, accounting for two-thirds of the ecosystem total, followed by Curve (~$22.1B) and CoW Swap (~$12.4B). Trading volume is the only indicator where Ethereum did not top the five major public chains: BNB Chain's total volume of $162.5 billion exceeded Ethereum's $134.5 billion, with Solana close behind ($104.9B), while Avalanche ($14.5B) and Polygon ($10.7B) ranked lower. Ethereum's trading volume constituted 31.5% of the sum for the five chains, second to BNB Chain's 38%.
Ecosystem fees refer to all costs incurred by users using various applications, including borrower interest and trader transaction fees, directly reflecting the economic value generated by the ecosystem. This aggregates all fees across Ethereum applications. In Q1, total ecosystem fees reached $2.0 billion, down 16.9% QoQ and 7.8% YoY, declining in line with reduced trading and lending activity.
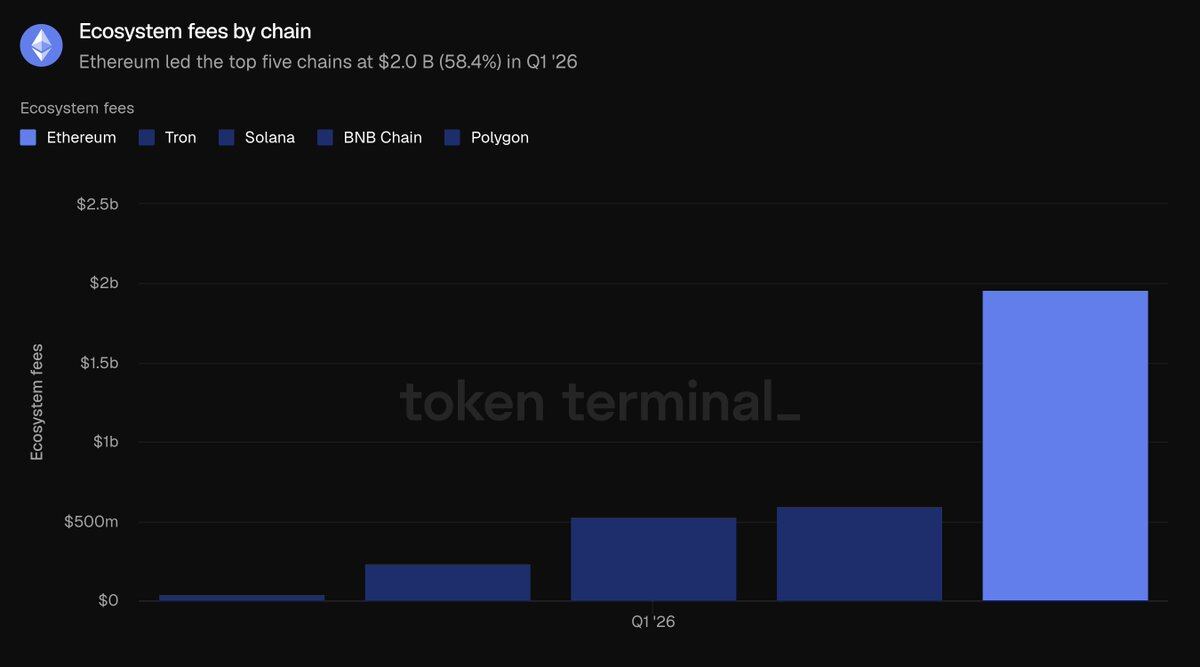
Ethereum's $2.0 billion in ecosystem fees far surpasses TRON ($599.3M), Solana ($532.5M), BNB Chain ($231.9M), and Polygon ($38.8M), accounting for 58.4% of the total fees across the five major chains. Even with a decline this quarter, Ethereum remains the largest source of application fees in the industry. Summarizing all indicators in this section: Ethereum leads the industry in TVL, lending scale, and ecosystem fees, with only DEX trading volume trailing BNB Chain.
Tokenized Assets Sector
Circulating Asset Market Cap refers to the total value of tokenized assets on-chain. It is calculated by multiplying the circulating supply by the closing price for the day. For stablecoins, the total outstanding circulation is used; for tokenized funds, the on-chain assets under management (AUM); for tokenized stocks, the total value of on-chain issued shares. This section only tracks assets issued on Ethereum.
In Q1, the average total market cap of Ethereum tokenized assets was $203.4 billion, remaining essentially flat QoQ (down only 0.7%) but experiencing significant YoY growth of 42.9%. Stablecoins accounted for 87.9% of the total, with the remainder shared by tokenized funds, commodities, and stocks.
Stablecoins
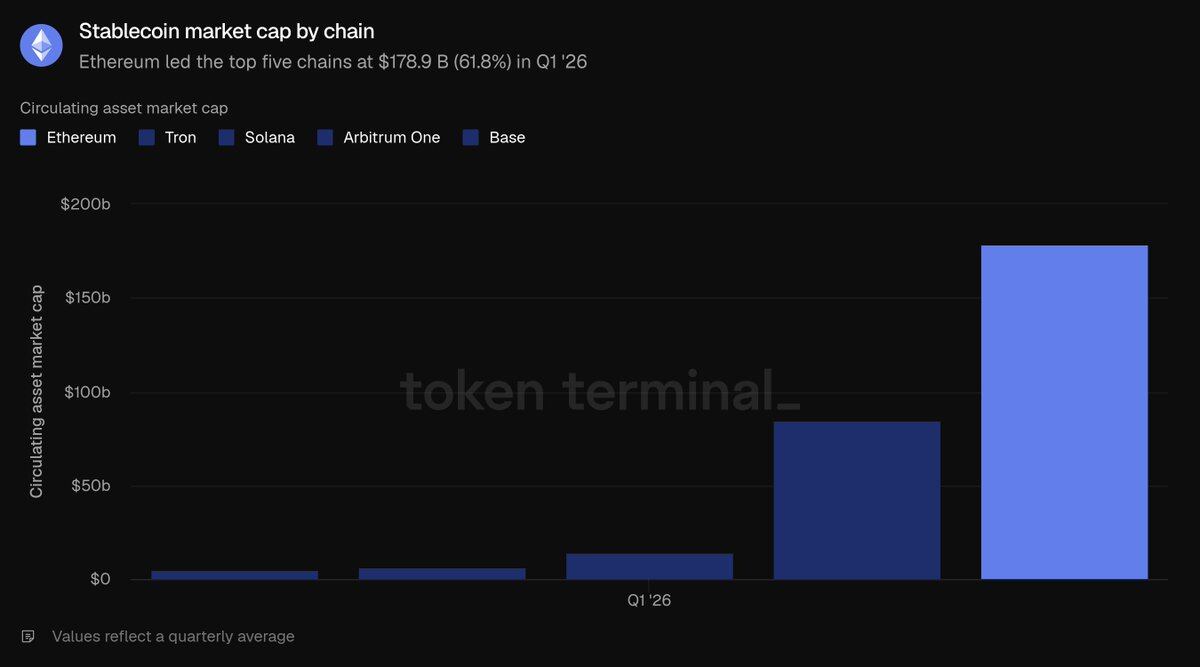
In Q1, the average stablecoin market cap on Ethereum was $178.9 billion, down slightly by 2.3% QoQ but up 37.6% YoY, making it the only tokenized sub-sector to contract QoQ. The market is dominated by two major issuers: at quarter-end, Tether (USDT, $94.1B) and Circle (USDC, $54.5B) together constituted the vast majority of Ethereum's stablecoin market cap. Other top products include Sky USDS ($12.4B), Ethena USDe ($5.9B), and PayPal PYUSD ($2.9B). New compliant stablecoins like Ripple's RLUSD ($1.1B) have also been launched. Comparing horizontally across five major public chains, Ethereum's $178.9 billion stablecoin market cap leads TRON ($84.5B), Solana ($14.5B), Arbitrum One ($6.8B), and Base ($4.7B), capturing 61.8% of the total across these five chains.
Tokenized Funds
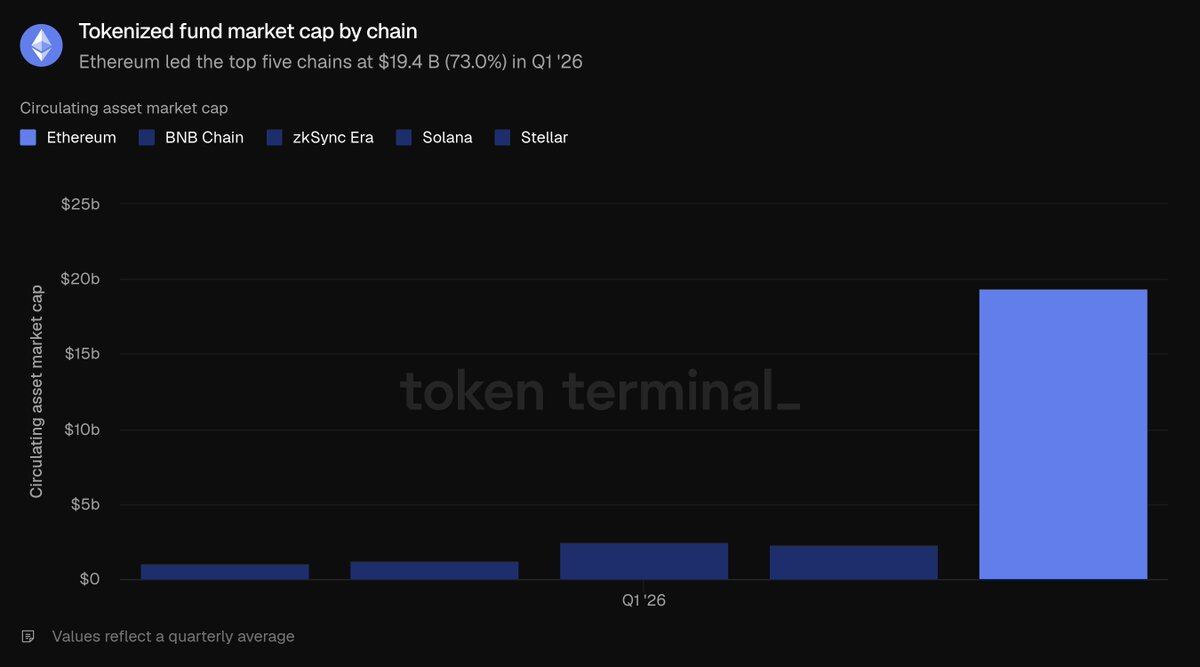
In Q1, the average market cap of tokenized funds on Ethereum was $19.4 billion, up 4.9% QoQ and a YoY surge of 73.1%. This sector is divided into two main categories:
Yield-bearing on-chain dollar products (largest scale): Sky sUSDS (~$6.4B), Ethena sUSDe (~$3.5B).
Traditional finance compliant funds (core narrative vehicle for institutional adoption): BlackRock's BUIDL (issued via Securitize, ~$1.0B), WisdomTree Government Money Market Fund (~$0.815B), Superstate USTB (~$0.62B), followed by Ondo OUSG (~$0.32B). Comparing across five major public chains, Ethereum's $19.4 billion in tokenized funds vastly outpaces ZKsync Era ($2.5B), BNB Chain ($2.3B), Solana ($1.3B), and Stellar ($1.1B), capturing 73% of the total. This is Ethereum's second most dominant tokenized asset sector.
Tokenized Commodities
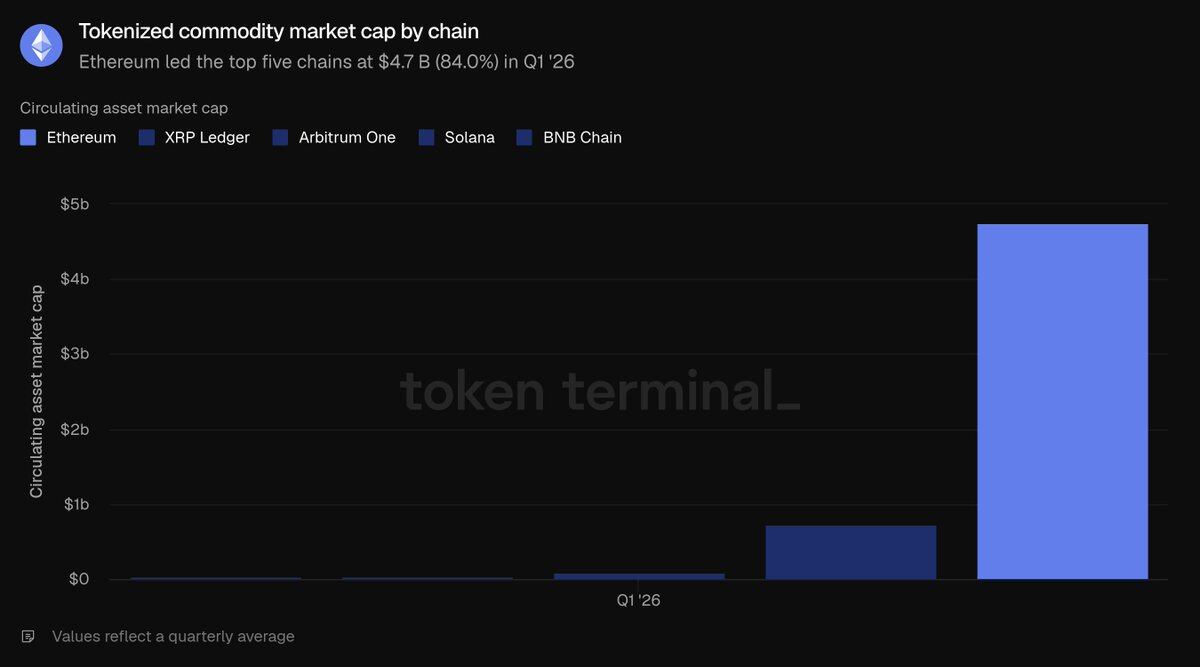
In Q1, the average market cap of tokenized commodities on Ethereum was $4.7 billion, up 60% QoQ and a YoY surge of 325.9%, making it the fastest-growing tokenized category. This sector is almost entirely composed of on-chain gold: Tether Gold (XAUT, ~$2.6B) and Paxos Gold (PAXG, ~$2.4B) together account for the entirety of the sector. Comparing horizontally across five related public chains, Ethereum's $4.7 billion scale far exceeds Ripple ($736.6M), Arbitrum One ($95.9M), BNB Chain ($38.4M), and Solana ($29.8M), capturing 84% of the total – the most dominant sub-sector for Ethereum.
Tokenized Stocks
Tokenized stocks represent the smallest sub-sector category. In Q1, the average market cap on Ethereum was $365.1 million, compared to negligible levels in the same period last year, up 16.5% QoQ. This sector is almost exclusively dominated by Ondo Finance, which issues on-chain assets tracking the S&P 500, Nasdaq 100 broad-based indices, and dozens of individual stocks, constituting the vast majority of Ethereum's tokenized stock market cap. Comparing horizontally across the five major public chains, Ethereum's $365.1 million slightly leads Solana ($249M), BNB Chain ($150.5M), Arbitrum One ($29M), and Stellar ($4.2M), but only accounts for 45.8% of the total tokenized stocks across these five chains – the only tokenized asset sector where Ethereum does not hold an absolute majority share.
Summary of the Tokenized Assets Sector: In Q1, stablecoin supply declined slightly, but Ethereum's monopoly position in the tokenized fund and commodity sectors continued to consolidate.
On-Chain Usage Activity
Monthly Active Users are defined as unique addresses that execute revenue-generating on-chain transactions per month. This metric counts only addresses interacting on the Ethereum Layer 1 mainnet. In Q1, the average number of monthly active users was 13.2 million, surging 53.5% QoQ and increasing 85.9% YoY, setting a new all-time high. This ended a period of slow growth over previous quarters and marked a significant acceleration in user growth.
Total Transactions refer to the number of transactions written to and confirmed on the blockchain, reflecting user interaction activity. Transactions Per Second (TPS) is the average confirmation rate over the period, measuring the network's real-time capacity. Both metrics count only the Ethereum Layer 1 mainnet. In Q1, total Layer 1 transactions reached 200.4 million, up 38% QoQ and 81.5% YoY; average TPS rose to 25.78,


