






2026 H1 Crypto VC Report: $13.3 Billion Across Just 435 Deals, Capital Begins to Vie for Control


- Key Insight: The crypto investment market is undergoing a structural shift, with capital concentrating on a handful of projects that already possess mature business models, compliant licenses, and revenue structures. Traditional financial institutions dominate over half of the deals, rendering the "spray-and-pray" investment strategy completely obsolete.
- Key Elements:
- H1 2026 saw $13.3 billion in funding (matching the total for 2024), but only 435 deals were closed – a 78% drop from the 2022 peak, highlighting extreme capital concentration.
- Traditional financial institutions participated in 54.5% of investment deals. For instance, a16z-led funding for the Canton Network included direct participation from institutions like HSBC and BNP Paribas.
- Seed round deal volume has plummeted 88% from 2022, while Series A and later-stage rounds now account for 75.2% of total investment, with capital favoring "buying ripe fruit."
- Total financing in the payments and stablecoin sector surged approximately 20x, but this was primarily driven by large M&A deals like Mastercard's acquisition of BVNK ($1.8 billion).
- Funding rounds in the gaming sector collapsed by 96% from 141 to just 5. Segments like NFTs and social entertainment also contracted significantly, as sectors lacking sustainable models were phased out.
This article is written by Tiger Research. The crypto investment market is undergoing a brutal shakeout. In the first half of 2026, funding reached $13.3 billion (on par with the full year 2024 total), but the number of deals plummeted by 78% to just 435 deals—more money is flowing in, but it's only going to a very select few projects. For investors and practitioners, this means the "spray-and-pray" investment strategy has completely failed. Traditional financial institutions have taken market dominance (participating in 54.5% of transactions), and only projects with mature business models and necessary regulatory licenses can secure capital. Capital in the crypto market is undergoing a paradigm shift, concentrating towards specific sectors and companies. Tiger Research and RootData analyzed 9,416 investment transactions recorded from 2018 to the first half of 2026 to study this shift in the capital market.
Key Findings
- Capital inflows reached $13.3 billion in the first half of 2026, already comparable to the $13.2 billion total for the entire year of 2024, but the number of funding rounds plummeted to just 435, a 78% decline from the 2022 peak of 1,978 rounds.
- The market is now split into two major camps: a few large crypto-native VCs focusing on leading rounds, and exchange-affiliated VCs competing based on liquidity advantages, while mid-sized institutions without clear competitive edges are rapidly exiting the market.
- The number of funding rounds in the gaming sector crashed from 141 in 2024 to just 5 in the first half of 2026, a 96% drop.
- Capital inflows in the payments and stablecoins sector, as well as the centralized exchange (CEX) sector, are entirely driven by M&A activity.
- Traditional financial institutions participated in 54.5% of investment transactions in the first half of 2026.
1. The 2021 Market: Speed and Diversification were King
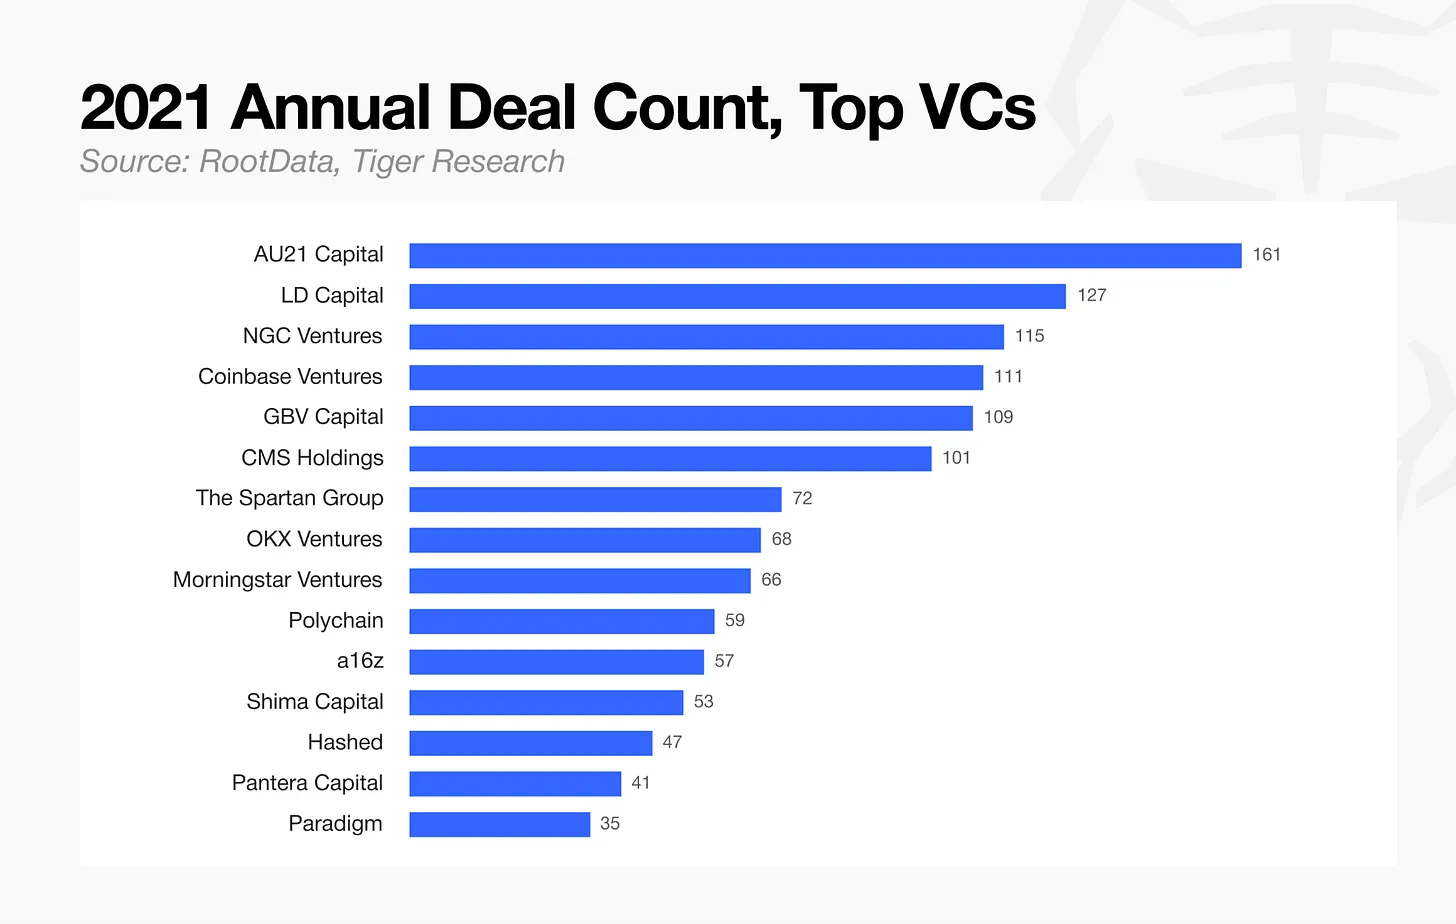
In 2021, the core strategy in the crypto investment market was speed and portfolio diversification. Investors completed 1,750 deals that year, including seed rounds, to the point where the competition for speed was so fierce that AU21 Capital alone averaged over 13 deals per month.
Investment decisions were simplified to basic metrics like the Token Generation Event (TGE) timeline and tokenomics. Because returns could be generated solely from token launches without any actual product development, VCs essentially adopted a "spray-and-pray" strategy, scattering capital across dozens or even hundreds of projects regardless of valuation.
Execution speed was prioritized over thorough due diligence. New rounds closed almost instantly, and VCs that missed a round would often chase the next one at higher valuations, a pattern of FOMO repeating across the industry.
Many VCs following this strategy failed to survive the subsequent bear market, and those that did survive have fundamentally changed their approach.
2. Which VCs Survived: The Landscape Has Shifted
2.1. Leading Rounds, Then and Now
The first metric to examine is leading rounds, i.e., funding rounds historically led by major VCs.
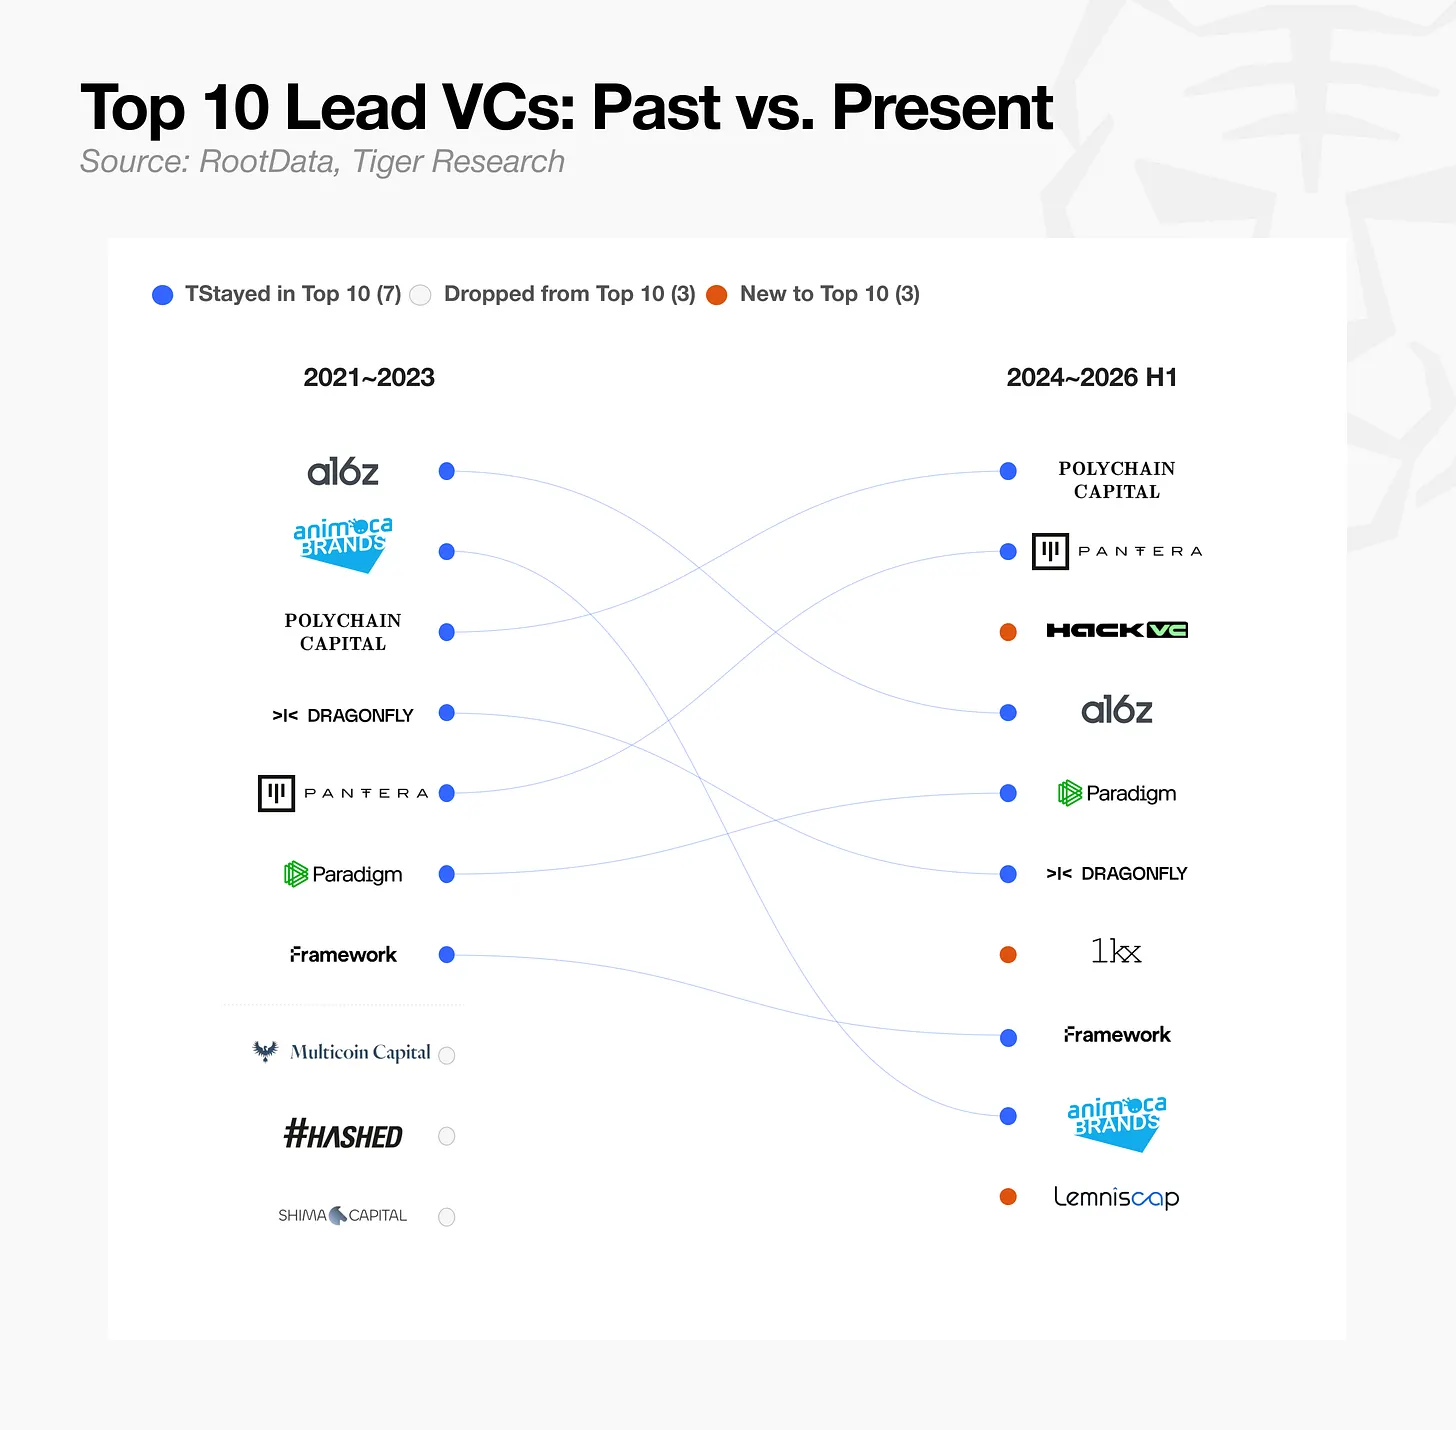
Some VCs remain active in leading rounds today, while others have completely disappeared or only emerged recently. Because leading rounds have always required the reputation and capital scale that only large VCs possess, institutions that led major funding rounds in the past have proven their resilience, with most still ranking in the top ten today.
2.2. How Surviving VCs Have Differentiated
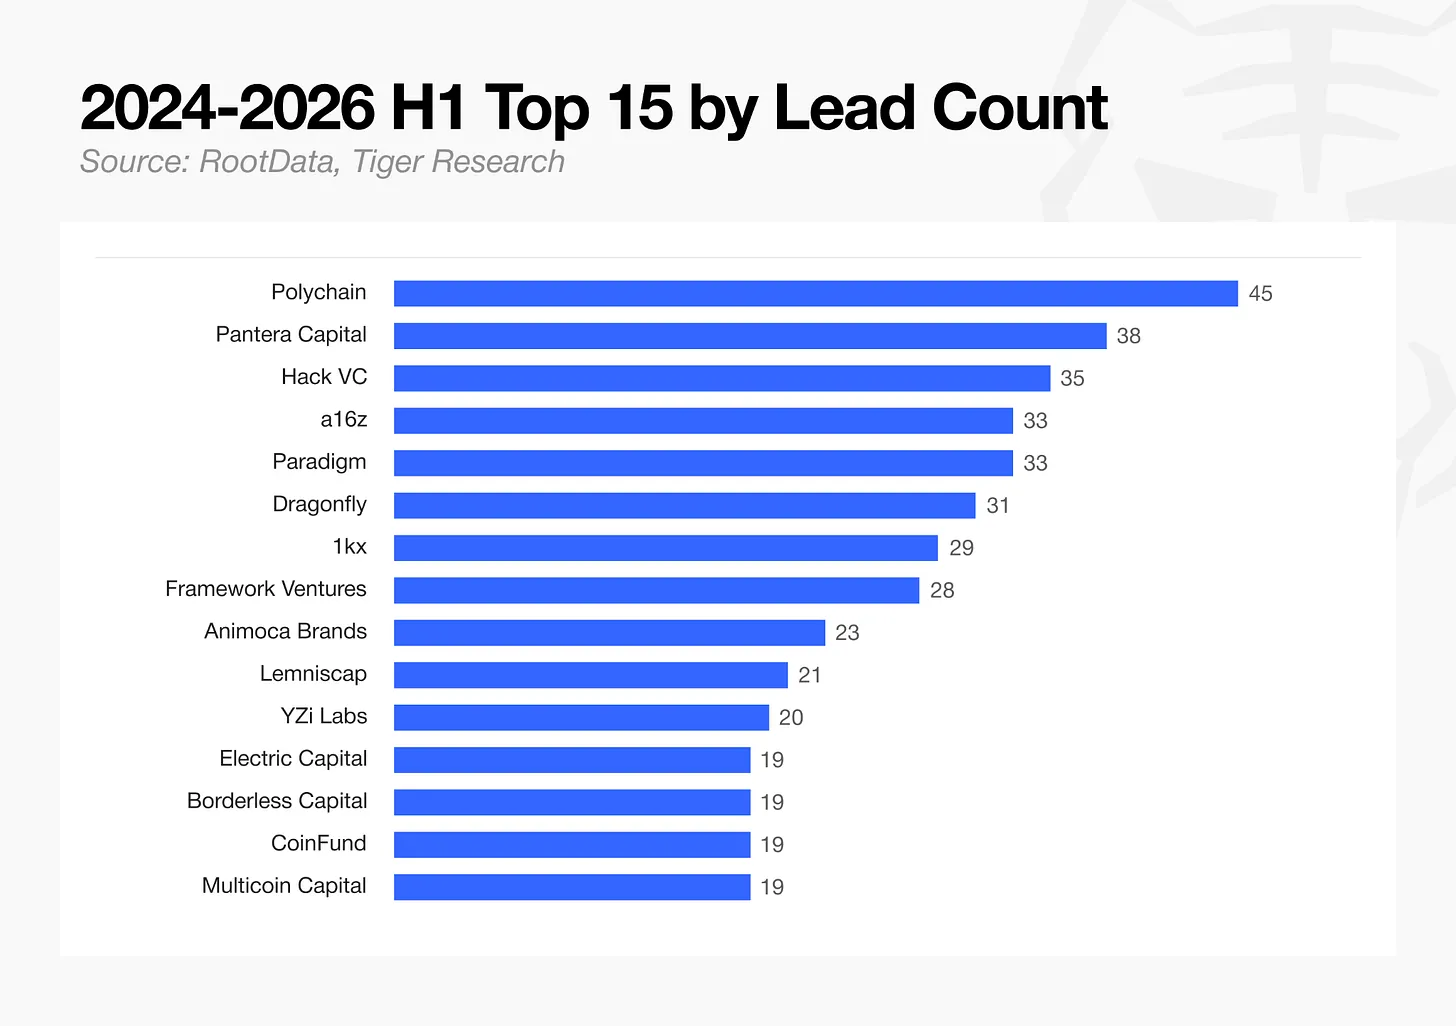
Looking at the latest data from 2024 to 2026, crypto-native VCs and established large institutions are concentrating resources on leading rounds, engaging more deeply in individual transactions. They have shifted their business models towards reducing the total number of deals while raising due diligence standards, securing board seats, and seeking greater governance influence.
However, a different pattern emerges when looking at the cumulative number of rounds participated in (excluding leadership roles).
Among the top 15 VCs by number of rounds participated in from 2024 to the first half of 2026, exchange-affiliated entities hold a significant share. Exchanges are more active in joining rounds than leading them. Coinbase Ventures ranks first with 140 deals, OKX Ventures second with 94 deals, and YZi Labs third with 92 deals. YZi Labs is the organization formerly known as Binance Labs, renamed in January 2025.
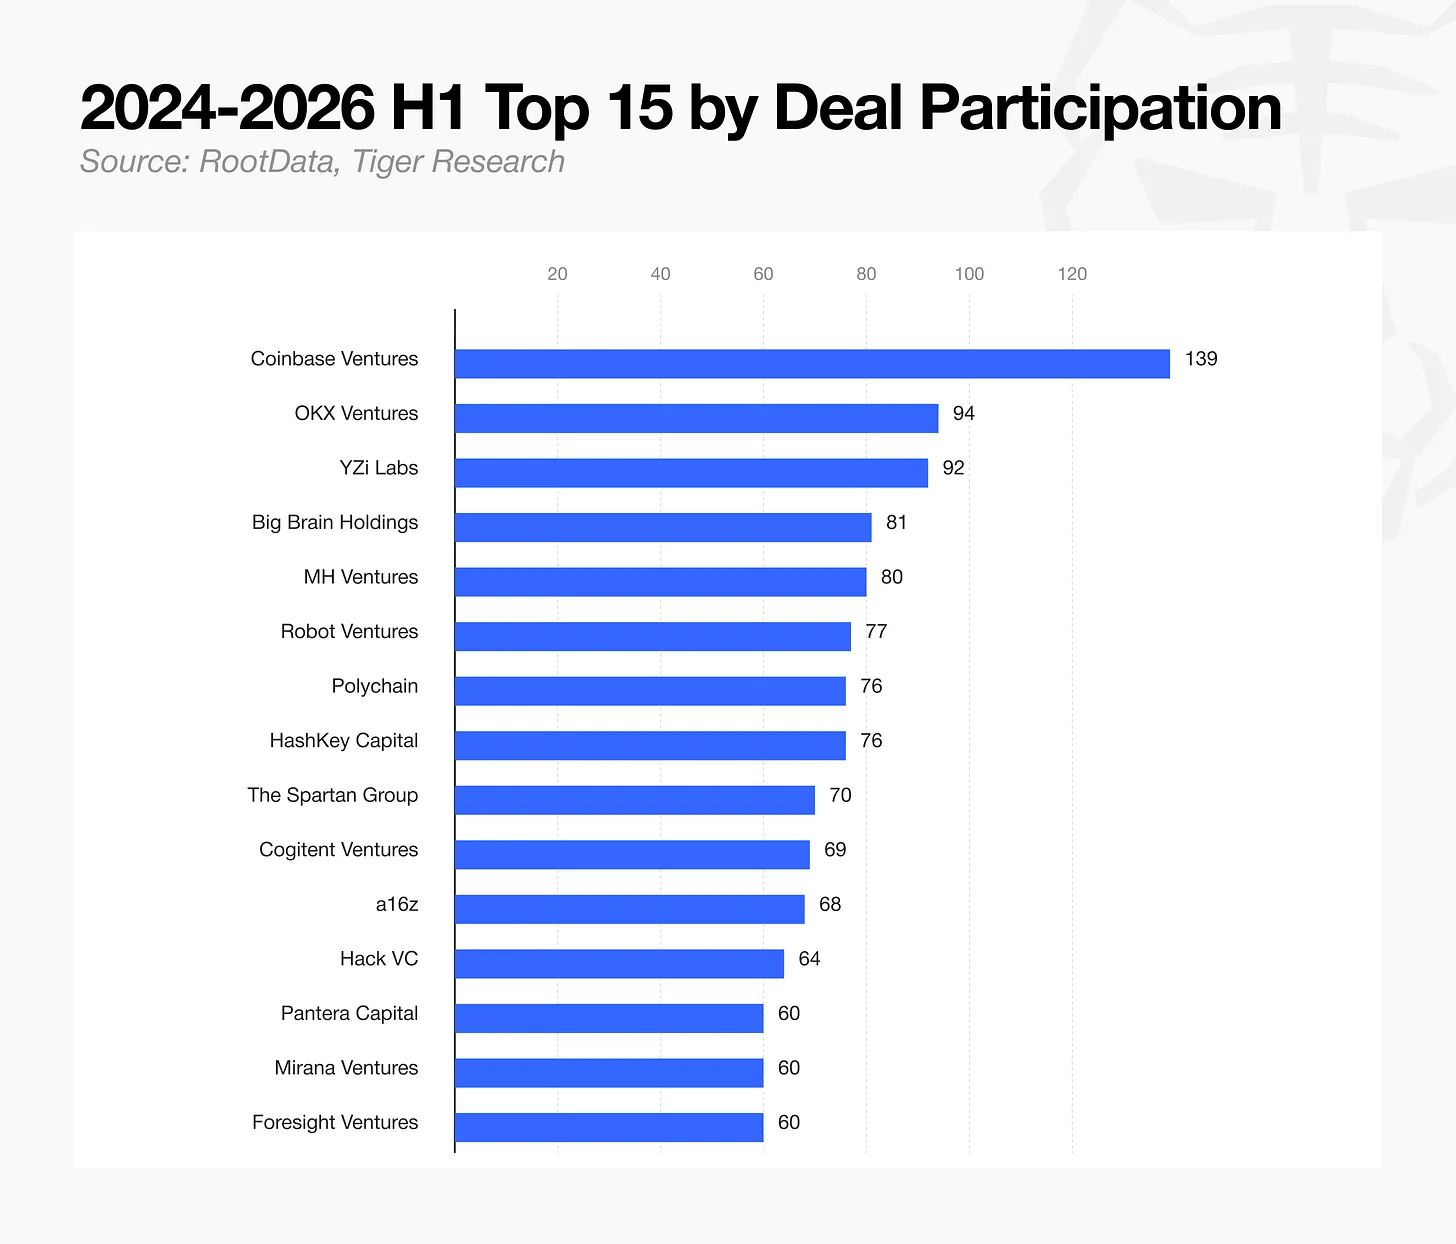
Ranked seventh is HashKey Capital, the venture arm of the Hong Kong-based HashKey Exchange, and ranked fourteenth is Mirana Ventures, the venture arm of Bybit. Through their respective venture arms alone, the top five exchanges appear in the top 15. Large VCs focused on leading rounds, such as Polychain and Pantera Capital, rank lower on the metric of total rounds participated in.
Exchange-affiliated VCs have established themselves as core participants in major rounds by leveraging the liquidity and marketing support their platforms can offer. Mid-sized VCs lacking a clearly defensible advantage—whether economies of scale, brand recognition, or exchange-level liquidity support—are being rapidly squeezed out of the market by the dual pressures of capital constraints and unsuccessful exits.
2.3. VCs That Left: The End of Spray-and-Pray Investing
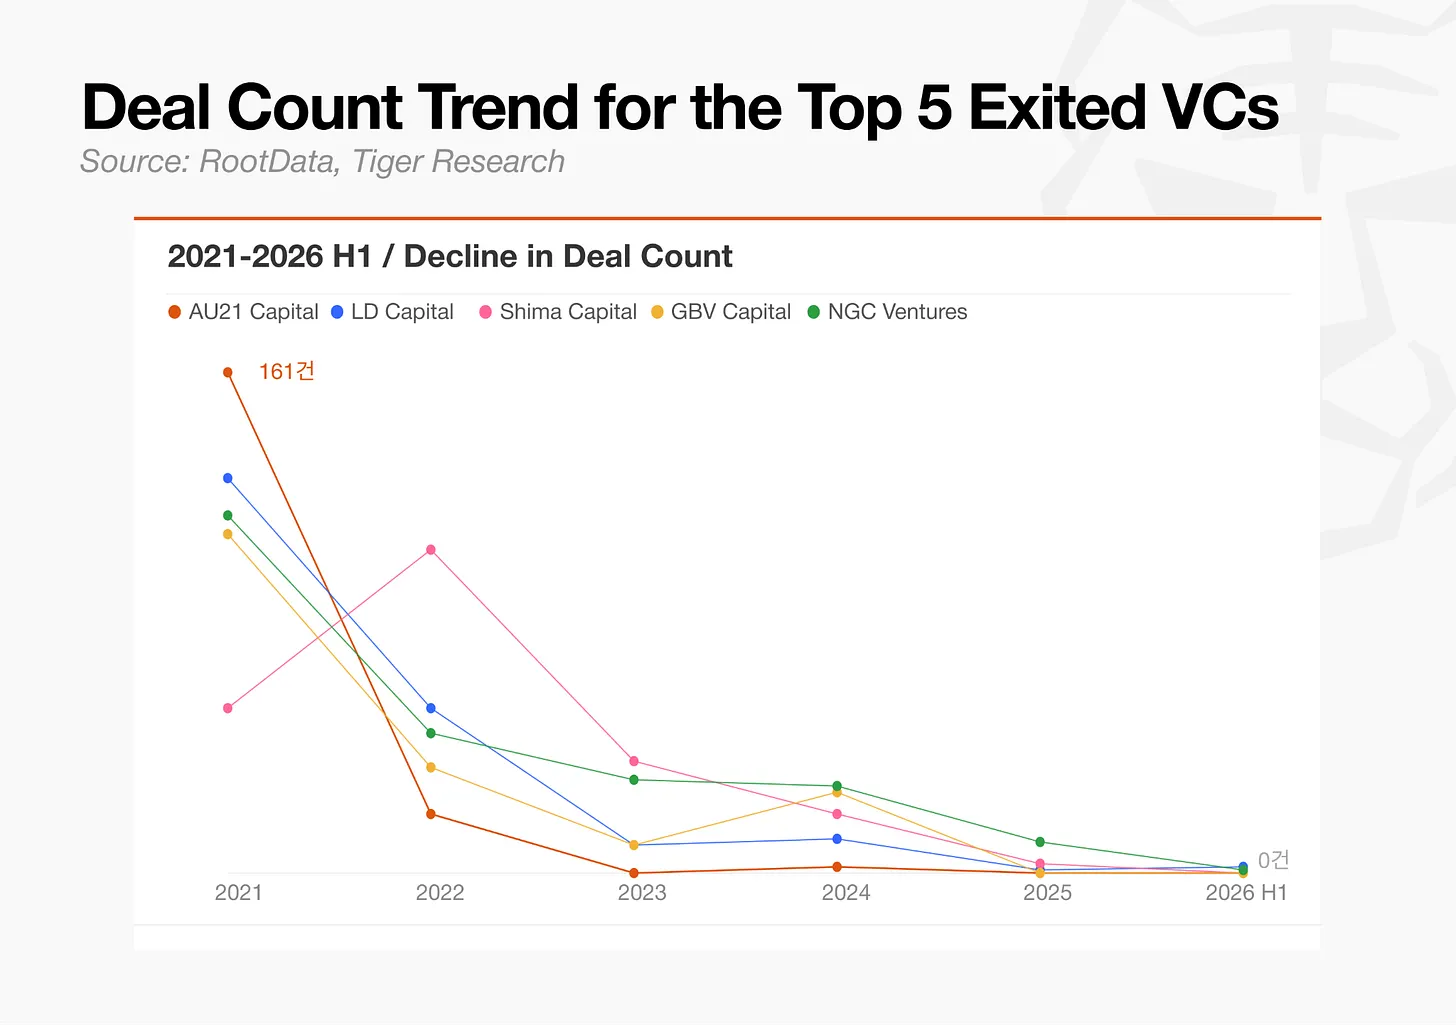
Most VCs that built broad portfolios in the previous bull market relying on quick token flips have vanished. The deal counts for AU21 Capital, LD Capital, and Shima Capital have fallen by as much as 98.9%, effectively losing their market influence. Once sustained bear markets and regulatory tightening set in, strategies built on chasing short-term narratives ceased to work.
The primary reason is their failure to develop any genuine differentiation, but it's also notable that the overall flow of crypto capital has shifted toward projects that have already reached a certain level of maturity, with few new post-seed projects requiring early-stage financing appearing. In other words, the opportunities these VCs relied on are no longer present in the market.
3. Funding Rounds: Buy Mature Fruit, Not Seeds
3.1. The Collapse of Seed Rounds
In the first half of 2026, seed-stage deals totaled 81, an 88% drop from 694 in 2022. The market's aversion to unproven, higher-risk early-stage projects is evident. This decline is also reflected in the overall structure of funding rounds: seed rounds accounted for 35.3% of all deals in 2022, but this share fell to 18.7% in the first half of 2026.
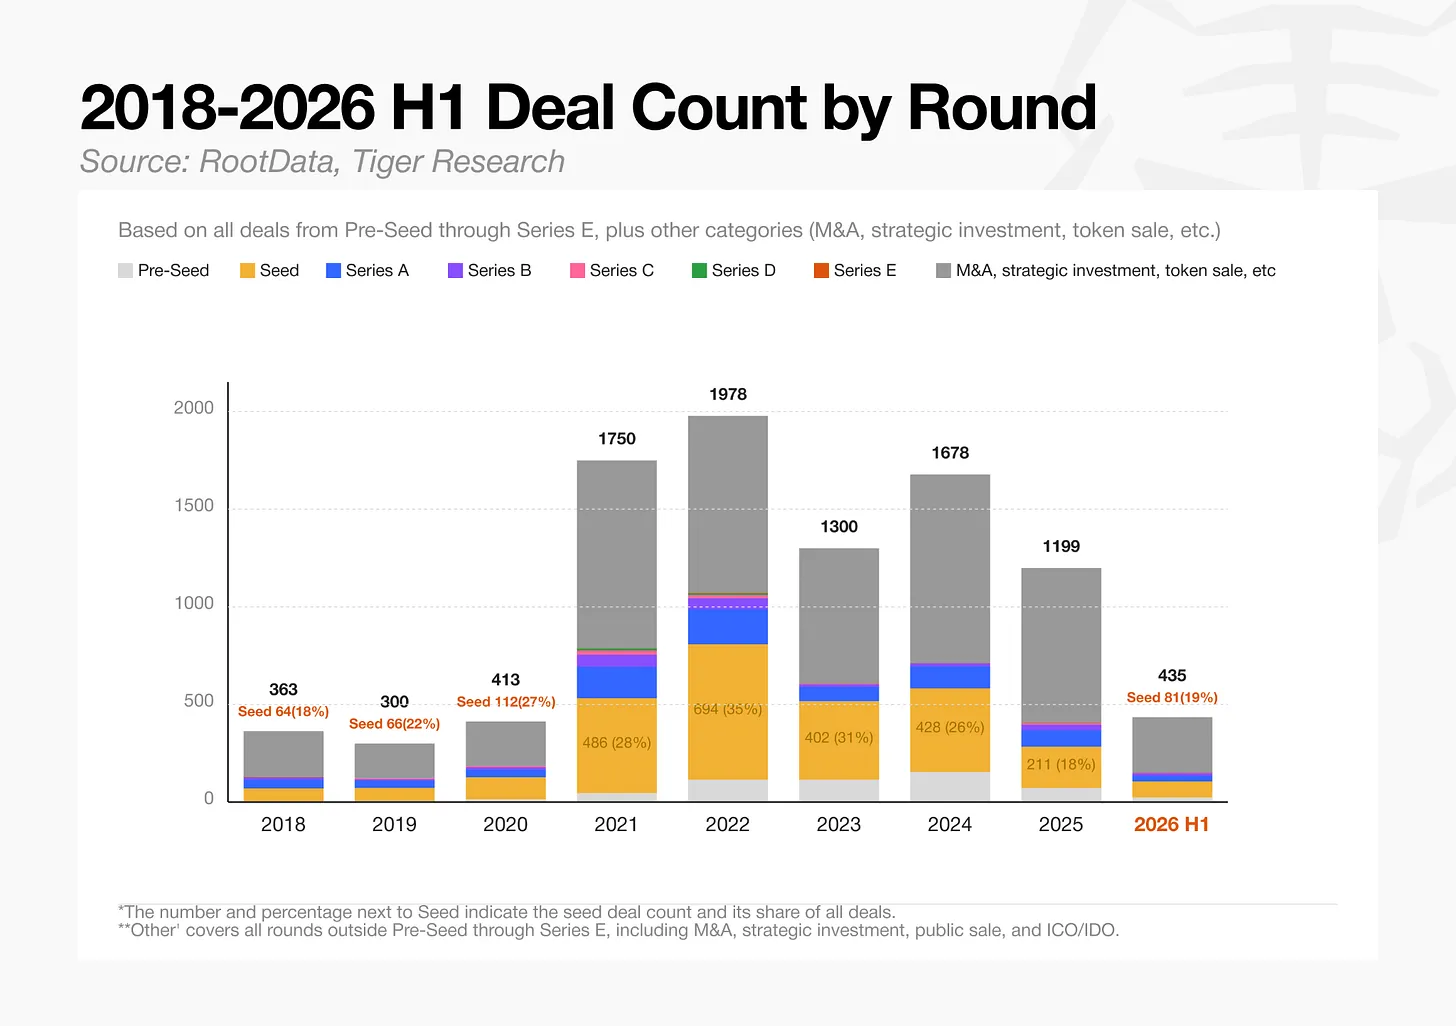
The decline in seed rounds can be interpreted as reflecting both investor aversion and a simple shortage of new early-stage projects seeking seed funding. It's an indicator that captures both market contraction and market maturation simultaneously.
3.2. Capital Concentrates in Later Stages
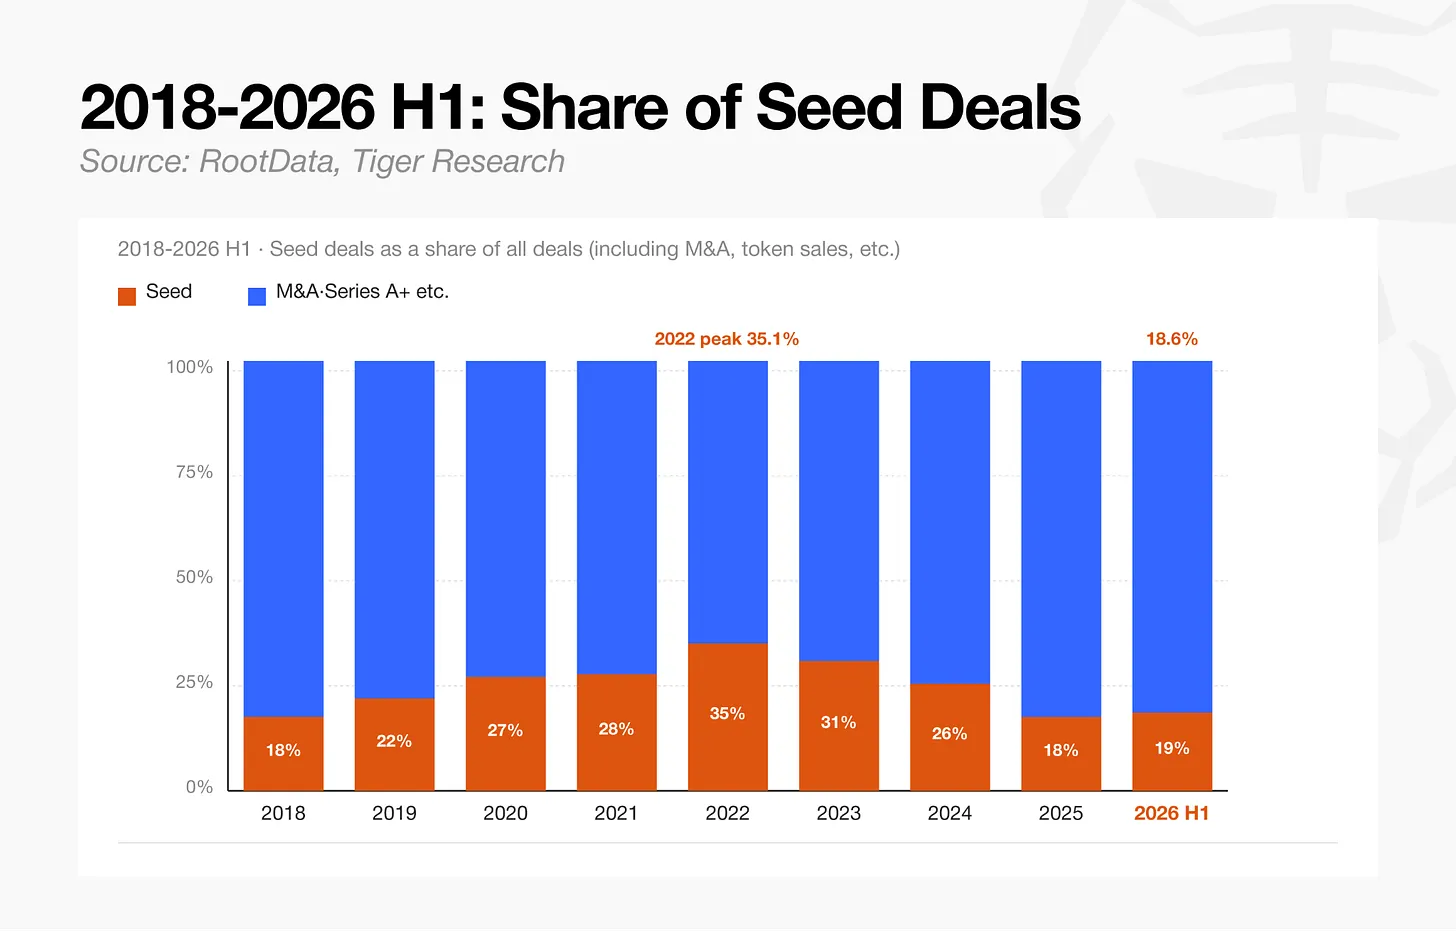
Measured by capital allocation, later-stage rounds (Series A and beyond) now account for 75.2% of total investment. Seed-stage investment briefly held a majority share during the 2023 bear market, but once the market entered recovery, capital was quickly reallocated to well-capitalized companies.
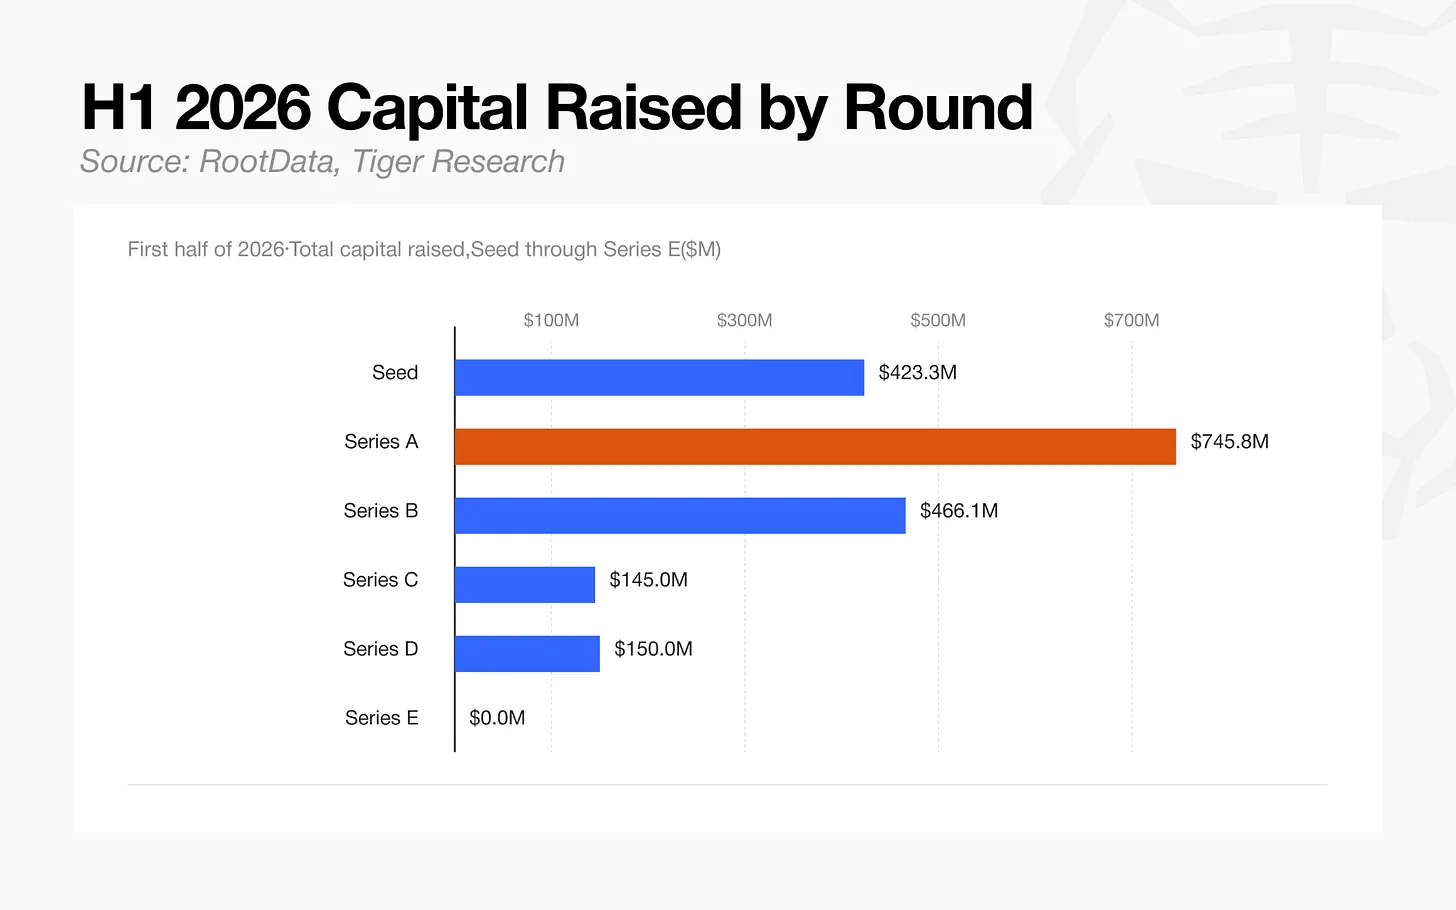
In the first half of 2026, the total amount raised in Series A ($745 million) surpassed the total capital raised across all seed stages ($423 million), making it the largest category by value in any round.
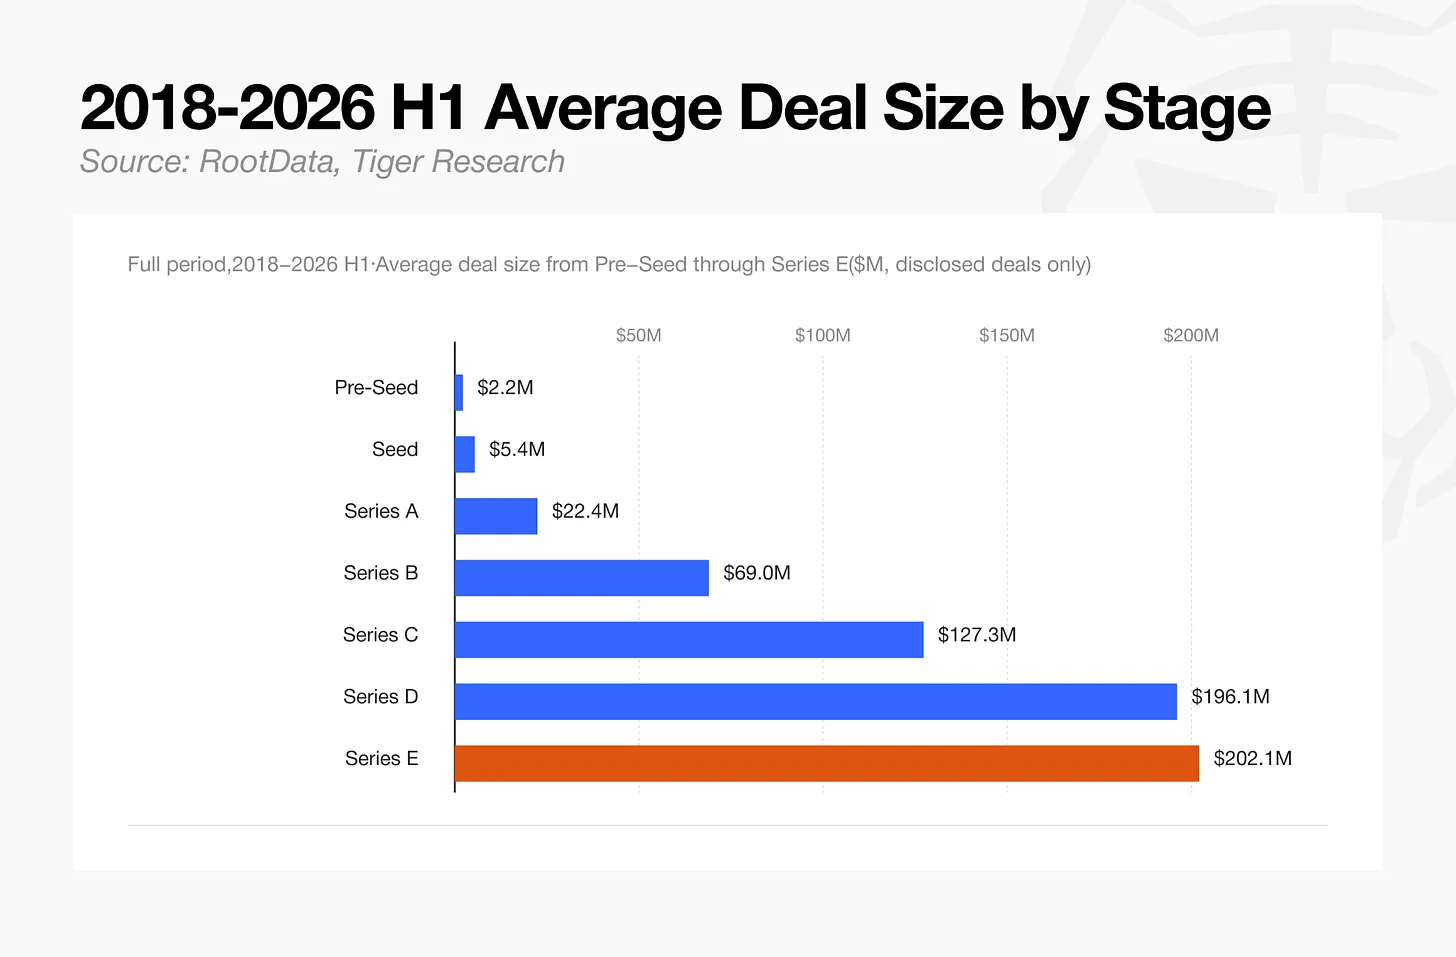
The average deal size shows a clear step-wise increase from one stage to the next: $5.4 million for Seed, $22.4 million for Series A, $127 million for Series C, and $202 million for Series E. The sample size shrinks at later stages, but companies reaching these stages have already increased their revenue and valuation, hence the proportionally larger capital involved per round.
4. Overall Market: Capital Concentration, Deal Count Decline
4.1. Divergence of Capital and Deal Count
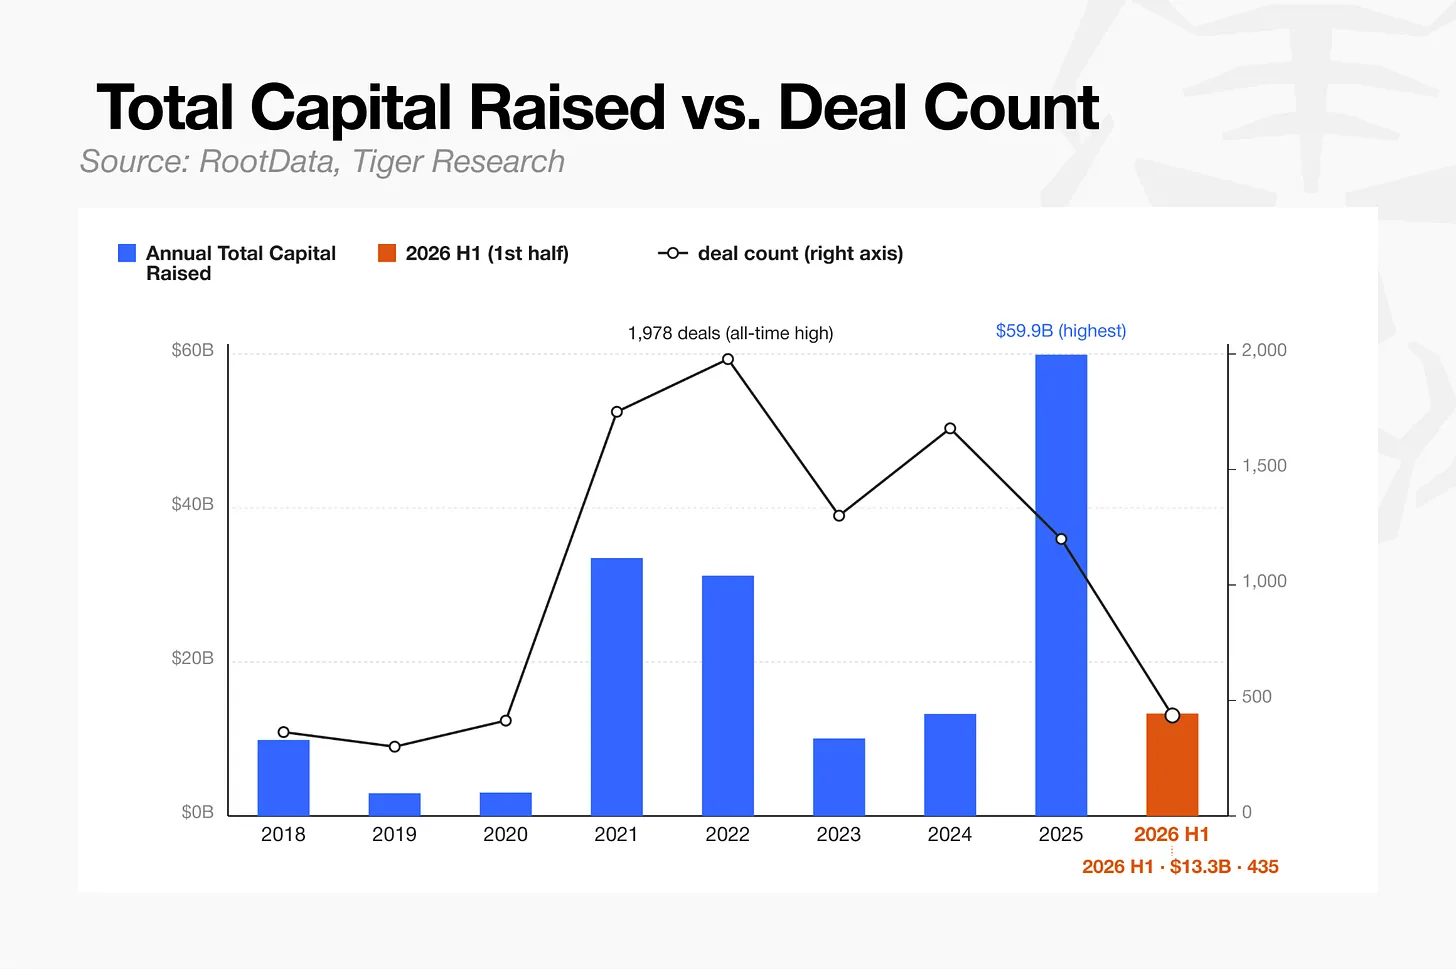
Total capital inflow reached $13.3 billion in H1 2026, while the total deal count of 435 was only 22% of the 1,978 deals recorded in 2022 (the year with the highest annual deal count). From 2024 to 2026, the capital volume remained flat or increased, even as it concentrated into fewer deals.
Small, diversified bets by VCs chasing short-term returns around token liquidity events have decreased, while large direct investments from traditional financial institutions have increased. Institutions apply stricter criteria, evaluating not token listing timelines or market narratives, but whether a company has auditable revenue structures and the necessary regulatory licenses.
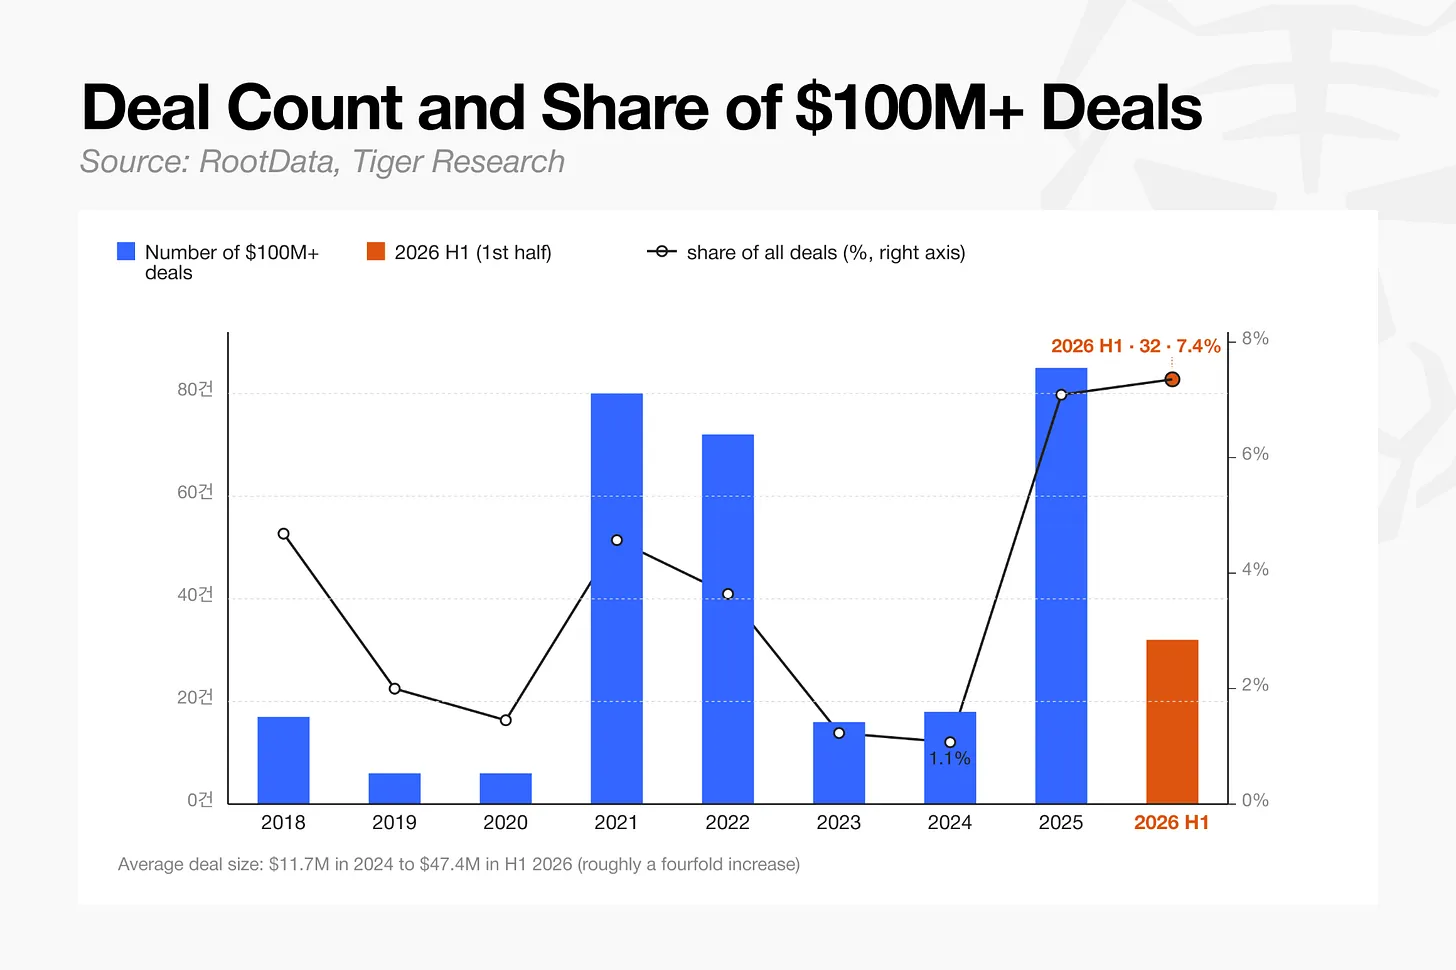
In H1 2026, deals worth $100 million or more totaled 32, accounting for 7.4% of all deals, a significant increase from 1.1% in 2024. Over the same period, the average deal size roughly quadrupled, from $11.7 million in 2024 to $47.4 million in H1 2026.
This increase in share comes from two directions. The number of large deals itself has increased, while the total number of deals has fallen due to the disappearance of small transactions, including seed rounds. A small cohort of surviving projects has begun to dominate the market, and as small deals vanish, the already limited pool of large deals occupies a larger relative share.
4.2. Direct Participation in Venture Rounds
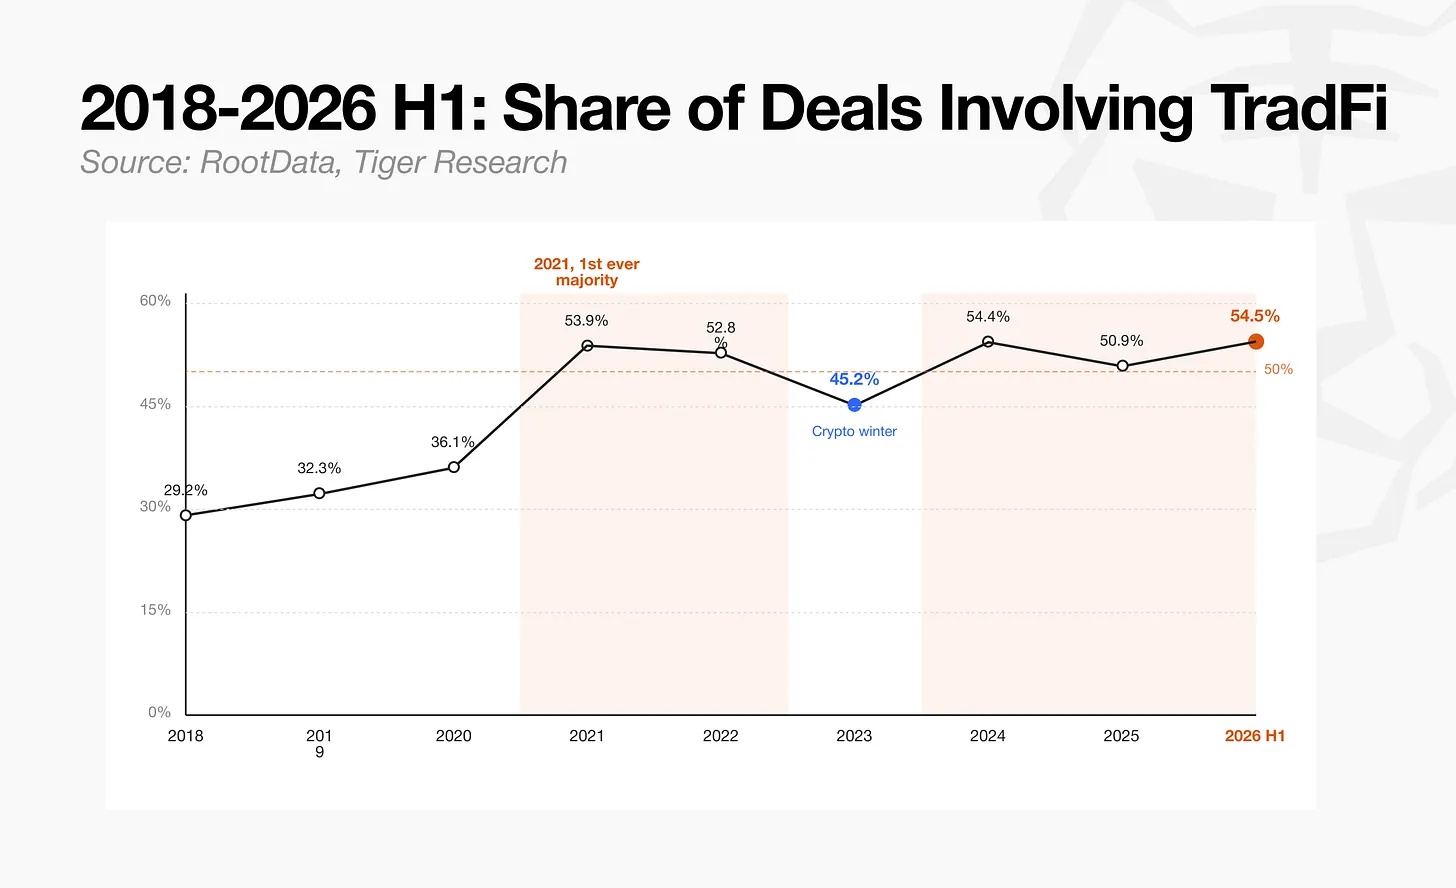
The proportion of investment deals involving traditional financial institutions rose from 29.2% in 2018, first exceeding a majority in 2021 at 53.9%. Their participation dipped to 45.2% during the last downturn in 2023, rebounded to 54.4% in 2024 as regulatory clarity improved, eased to 50.9% in 2025, and reached 54.5% in H1 2026. Since first crossing the majority threshold in 2021, participation has remained near these high levels.
For example, a16z led a $355 million funding round for Digital Asset, the developer of Canton Network, but core institutional participants included BNP Paribas, HSBC, S&P Global, and Hanwha Investment & Securities, investing directly rather than through VC subsidiaries.
Investment once flowed primarily into the earliest stages, but the growth of crypto VC firms and the entry of traditional investors have redirected more capital toward companies that have already reached a certain level of maturity.
5. Sectors: Surviving in a Changing Environment
2024 was the year the Bitcoin spot ETF was approved, coinciding with a more favorable regulatory environment, and it produced the first clear sector-level capital flows since the bear market. This analysis uses it as a baseline year for sector comparison.
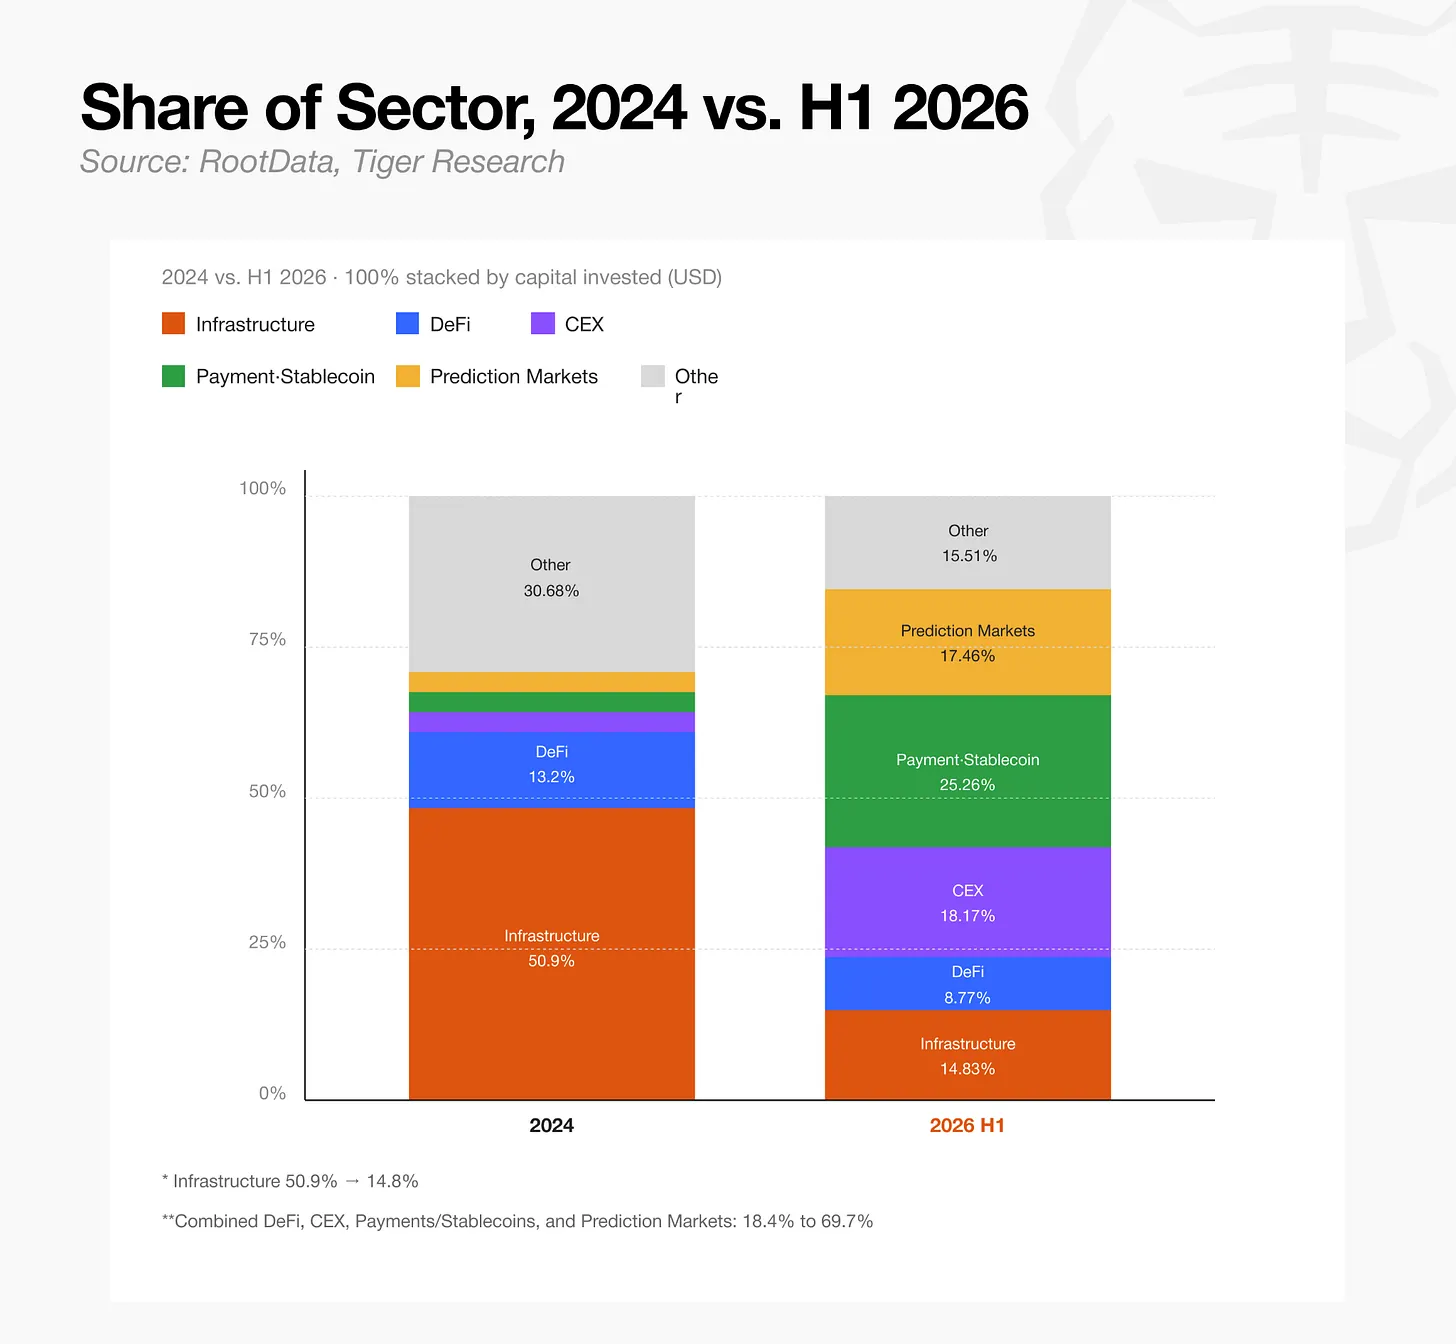
In 2024, the year of the Bitcoin ETF approval, the infrastructure sector commanded a majority share of total investment capital at 50.9%. By H1 2026, this share had sharply declined to 14.8%. Payments & Stablecoins (25.3%), Centralized Exchanges (18.2%), and Prediction Markets (17.5%) have taken the lead instead, completely reshaping the sector landscape.
This shift indicates that the nature of blockchain infrastructure has changed from an independent investment target to a utility platform for actual institutional business operations. Representative cases include Robinhood running its own Layer 2 on Arbitrum, and Securitize adopting Solana and Avalanche as settlement layers around its NYSE listing. In other words, the core demand in the current capital market has shifted from building new protocol infrastructure from scratch to actually operating real-world financial services on top of existing infrastructure layers.
5.1. The Laggards: Gaming, NFTs, and Social
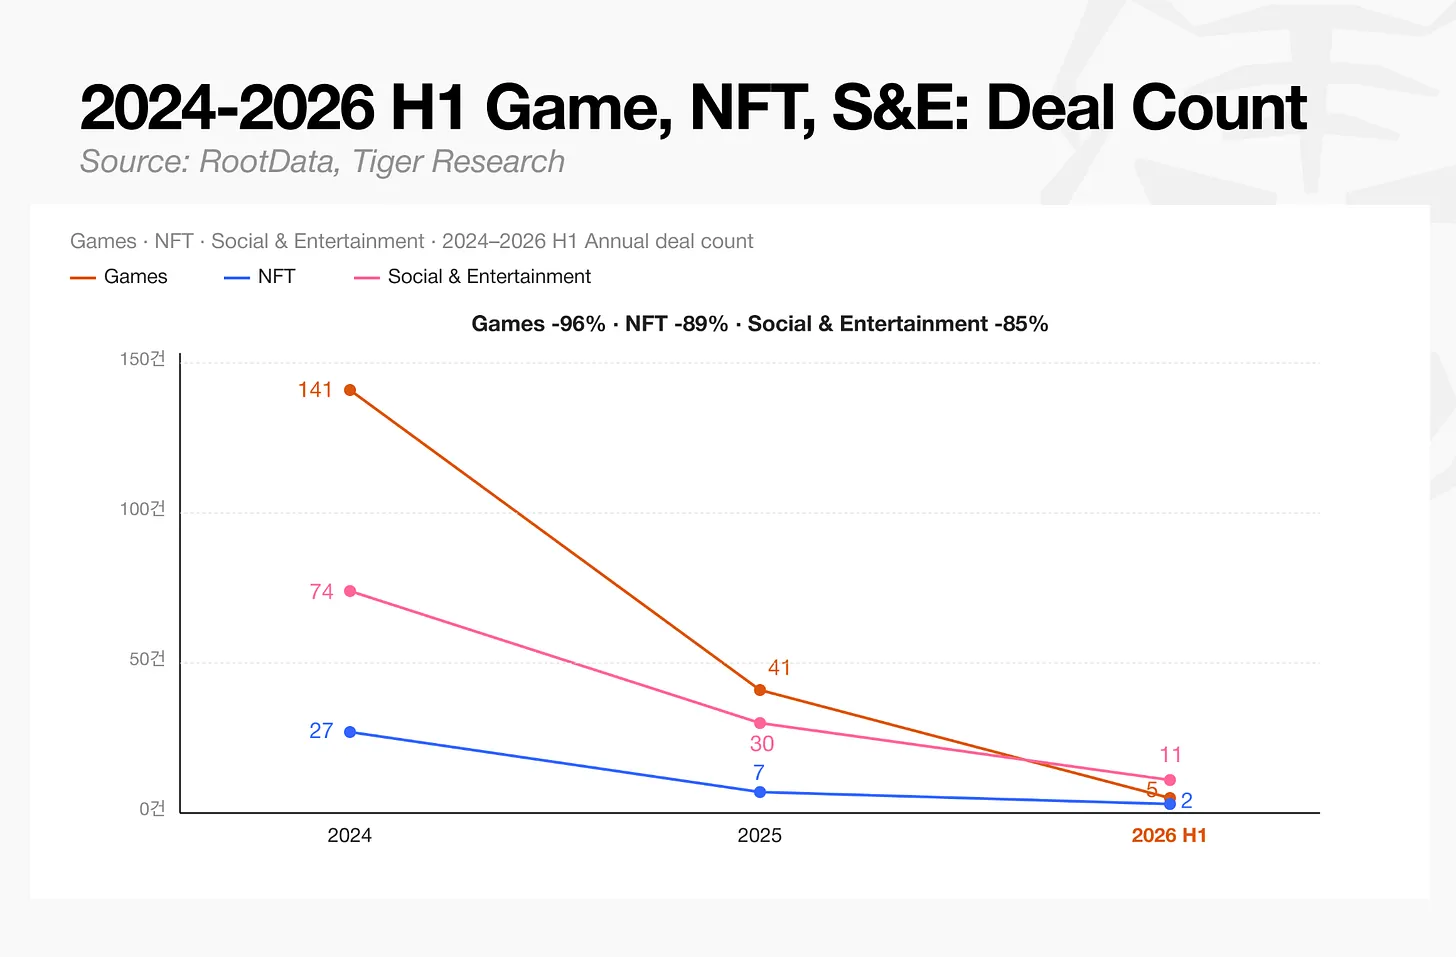
All three sectors saw significant drops in deal count. Gaming fell from 141 to 5, NFTs from 27 to 2, and Social & Entertainment from 74 to 11.
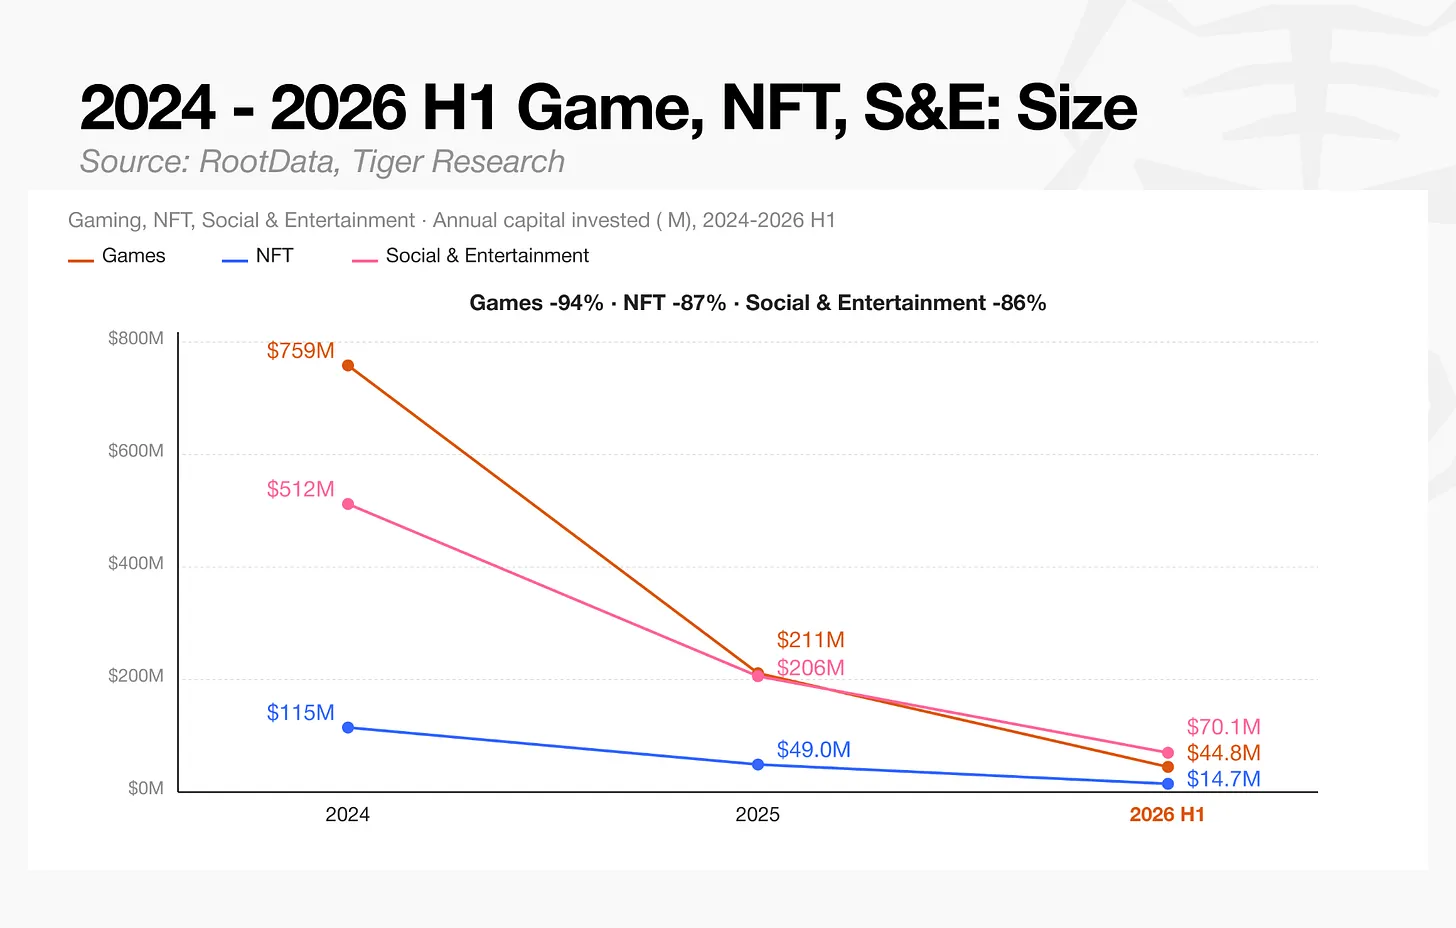
Capital inflows for all three sectors followed the same downward path. Gaming capital dropped from $758.6 million to $44.8 million, NFT capital from $114.9 million to $14.7 million, and Social & Entertainment capital from $512.1 million to $70.1 million.
The decline in the gaming sector is the largest of the three. The early GameFi model, combining gaming with token rewards, often relied excessively on token launches for financial returns rather than building sustainable gameplay. Once new user growth slowed, this model fell into a so-called death spiral—a structural cycle where token price decline and user churn reinforce each other without finding an exit. The result is that user traffic data, once a key KPI for due diligence, lost its reliability, and capital inflows to the sector were effectively cut off.
5.2. DeFi: Quiet but Stable
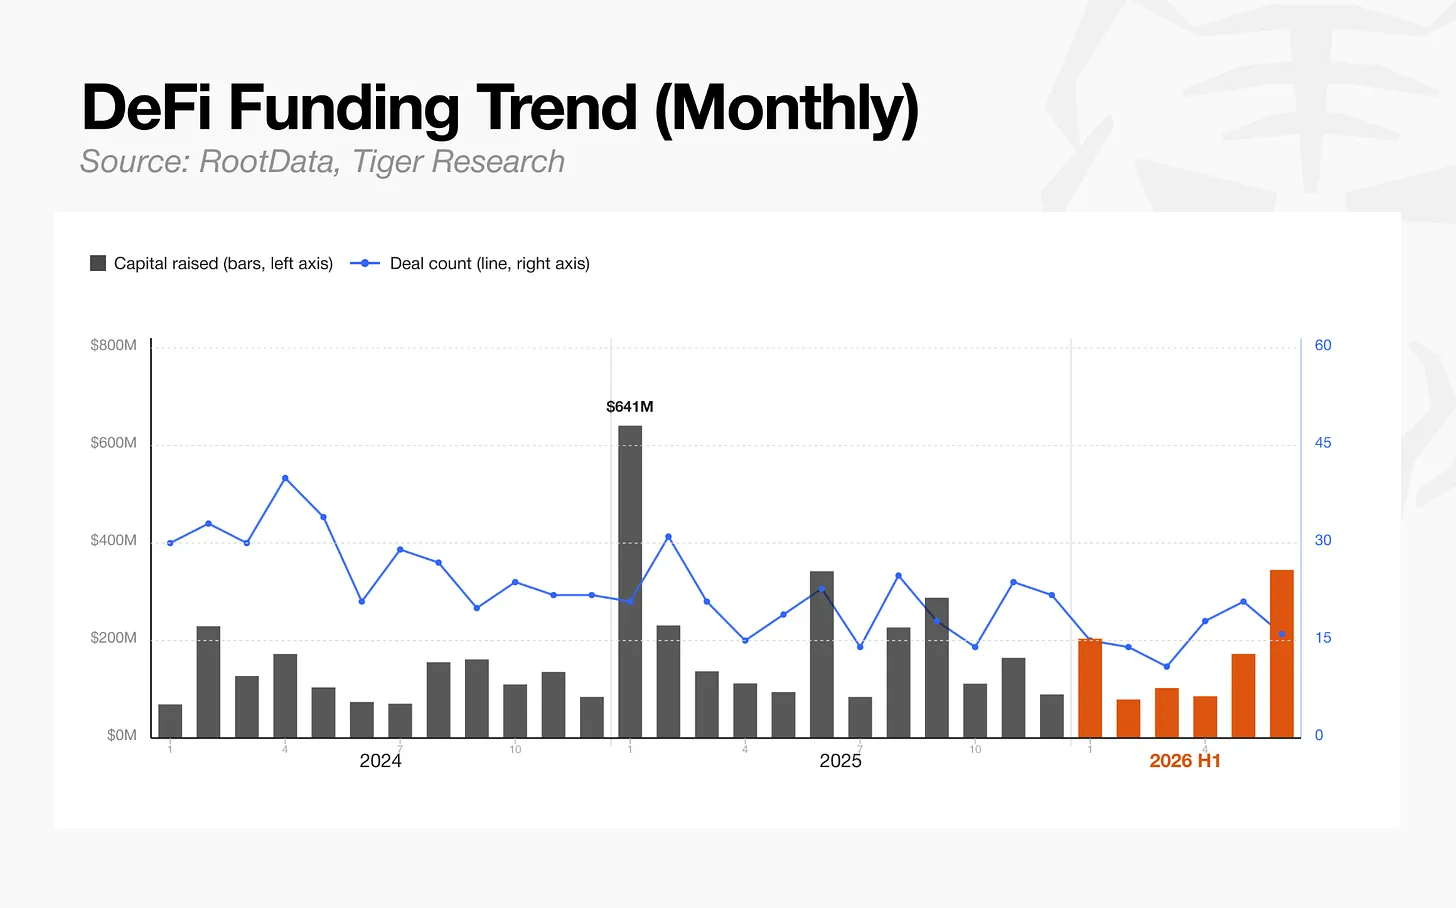
The number of deals in the Decentralized Finance (DeFi) sector dropped by 71%, but total investment declined by only about 34%. The average deal size actually increased,





