






Monera Digital June Crypto Monthly Report: When the Largest Marginal Buyer Turns Away


- Core Thesis: In June 2025, the crypto market completed a prelude to a bottom formation, transitioning from capitulation selling to silent accumulation by long-term holders. The halving of prices, record ETF outflows, and the shattered MSTR conviction signaled that internal deleveraging has entered deep waters. However, the initial confirmation of seller exhaustion is in place, with coins migrating from weak hands to strong hands.
- Key Factors:
- Price & Leverage Deleveraging: BTC fell 19.2% month-over-month to $59,624, touching a monthly low of $58,201, representing a -54% drawdown from its cycle high—a true "halving." Open interest in derivatives compressed by over $2.3 billion for the month, indicating significant market deleveraging.
- Institutional Buying Paradigm Breaks: Strategy broke its "never sell" commitment by selling BTC for the first time and authorized the monetization of up to $1.25 billion in BTC. The formerly largest price-insensitive buyer may now become a structural seller.
- Worst-Ever ETF Bleeding: BTC spot ETFs saw net outflows of approximately $4.51 billion for the month, the largest single-month outflow since the product's inception. ETH spot ETFs simultaneously saw outflows of about $529 million, with U.S. channel selling pressure dominating.
- Triple Macro Headwinds: U.S. data comprehensively refuted expectations of rate cuts (strong May non-farm payrolls, CPI and PCE exceeding estimates). The FOMC's hawkish dot plot confirmed a stagflationary direction. The DXY regained dominance, suppressing BTC.
- On-Chain Accumulation Emerges Alongside Valuation Extremes: Long-term holders returned to net buying after several months. The LTH supply ratio rose to a multi-year high of 88.1%. The Ahr999 indicator dropped to 0.283, entering the "ghost zone." For the first time, more coins were held at a loss than at a profit, signaling a large-scale migration of coins.
- Structural Shift at Month-End: The new low (57.8K) driven by a bear trap was distinguishable from spot selling exhaustion. The options market Gamma structure shifted to suppress volatility, with market makers pricing the 60-64K range. However, all three reversal axes (ETF, Dollar, Price) have yet to be confirmed.
Key Conclusions
June was a public dismantling of a core belief and a textbook preview of bottom-building. In May, we recorded a "failure of liquidity transmission." In June, the market answered the next question: What follows a failure of transmission? It is internal cleansing, descending from "distribution" into "capitulation." It is the cycle's strongest narrative—the "never-sell" corporate treasury—completing self-negation. It is the macro environment deteriorating from "good news fails to rally" to "substantial tightening materializes." Yet simultaneously, it was a month when long-term holders returned to net accumulation after months, and strong hands quietly absorbed supply amidst panic.
On the price front, BTC opened the month at $73,764 and closed near $59,624, falling approximately 19.2% for the month. The two key intra-month lows—$59,130 on June 5th and the month-end low of $58,201—extended the drawdown from the cycle high of $126,000 in October 2025 to -54%, officially a "halving" of value. ETH fell from $2,007 to $1,572, a decline of about 22% for the month, touching a low of $1,505.
Three main themes defined June:
1. The Public Breakdown of the Institutional Buying Paradigm. Strategy broke its "never sell" promise at the start of the month, selling 32 BTC for the first time. Mid-month, its mNAV dropped to 1.02, shutting down both equity and credit financing channels. By month-end, it officially announced the "Digital Credit Capital Framework," with the board authorizing the monetization of up to $1.25 billion in BTC—"selling coins to pay interest" transitioning from a tail risk to an institutionalized reality. The largest price-insensitive buyer of the past two years may not only fail to return but could also become a source of supply, potentially adding ~20,000 BTC to the market.
2. The Worst Monthly Outflows in ETF History. BTC spot ETFs saw net outflows of approximately $4.51 billion for the month, the largest single-month outflow since the product's inception. This included a record 10-day consecutive outflow streak and a panic-level single-day redemption of -$696 million. ETH spot ETFs simultaneously saw outflows of about $529 million. The redemptions showed a full-spectrum risk-aversion characteristic, coupled with persistently negative Coinbase Premium, indicating that marginal selling pressure from US channels dominated the entire month.
3. A Complete Microstructural Evolution from Capitulation to Accumulation. The breakdown on June 24th was a "clean" capitulation driven by spot selling—selling pressure came from holders, with leverage merely amplifying it passively. The monthly low of 57.8K on June 30th, however, was a bear trap—spot selling pressure had been exhausted, and the final leg down was purely driven by short positions in derivatives. This distinction is crucial: capitulation-driven declines require time for sentiment repair, while trap-driven declines only require shorts to admit they are wrong.
Our assessment for the month: The deep bear market has moved from the "mid-stage of clearing" into the "deep waters of clearing," culminating in preliminary confirmation of "seller exhaustion" at month-end. Three pieces of evidence support this: panic has been fully released (Ahr999 plummeted to 0.283, a historical "ghost zone"; for the first time, loss-making coins globally outnumbered profitable ones); strong hands have returned to accumulation (LTH returned to net buying, their supply share rising to 88.1%, a multi-year high, with accumulation showing broad-spectrum, cross-cohort characteristics); a structural shift occurred at month-end (BTC refused to make a new low on the day of MSTR's negative catalyst, and market makers turned long gamma in the 60-64K range).
But the other side that must be kept in perspective is that none of the three reversal axes were established at month-end: ETF outflows have not stopped, the dollar has not weakened, and the price has not reclaimed key resistance levels. The STH-SOPR is still 0.14 standard deviations away from the severe capitulation threshold, and the final capitulatory volatility spike often associated with historical cycle lows has not yet appeared.
Extreme undervaluation and signs of accumulation define a bottoming zone, not a bottoming point. What June accomplished was a preliminary confirmation of seller exhaustion, not a final one. A bear trap can explain a tactical bounce, but it cannot define a cyclical bottom.
I. Macro: From "When Will Rates Be Cut" to "Rate Hikes Are Priced In"
In May, the market was still debating whether easing expectations could be repaired. In June, the macro environment delivered a decisive triple blow denying them.
First blow: Data comprehensively disproved rate cuts. On June 2nd, JOLTS job openings came in at 7.62 million, a nearly two-year high, exceeding expectations by 750,000. The 10-year Treasury yield rose back above 4.45%. On June 6th, the May non-farm payrolls report was "red-hot," dashing hopes for rate cuts. The market immediately priced in a 25bp hike by December and a roughly 60% probability of an October hike, triggering a stock market crash that day (Nasdaq -4.18%, Philadelphia Semiconductor Index -10% intraday). On June 11th, May CPI came in at 4.2% YoY, the highest since April 2023. On June 25th, the core PCE for May hit 3.4%, the highest since October 2023, and the headline PCE at 4.1% breached 4% for the first time in three years—inflation stickiness was repeatedly nailed down by four heavyweight data points.
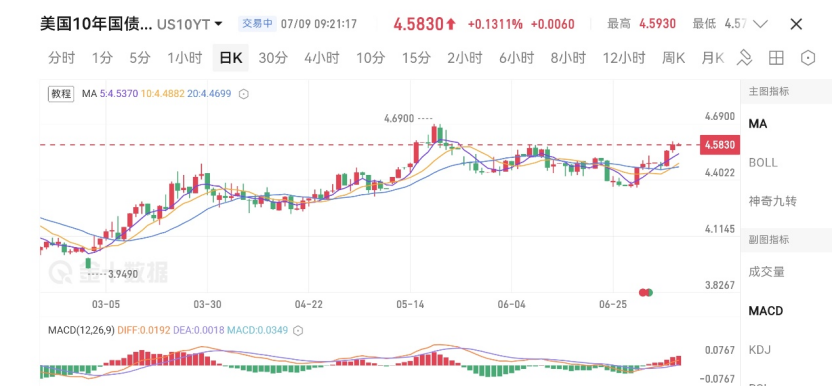
Second blow: The FOMC's hawkish dot plot sealed the deal. On June 18th, the Fed held steady for the fourth consecutive time (3.5%–3.75%), but the SEP underwent a systematic stagflationary correction: the 2026 median rate was raised to 3.8% (from 3.4%), the PCE forecast was raised to 3.6%, and GDP was revised down to 2.2%. New Chair Warsh's first press conference set the tone: "Persistently high prices are a burden on the people." Market institutions have already shifted from pricing in rate cuts to pricing in rate hikes.
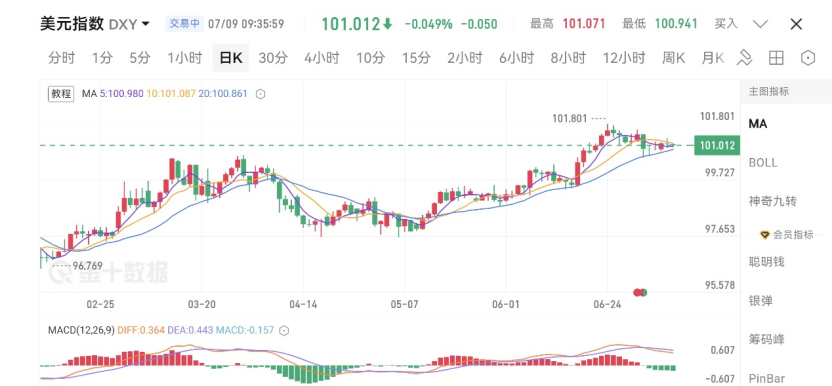
Third blow: The dollar regained dominance. The DXY climbed back above its 200-day moving average (101.80 vs 98.72) in late June, the first time since the "Liberation Day" shock in April. The negative correlation of a "strong dollar suppressing crypto," seen in 2022-23, re-established itself after a period of decoupling: the S&P 500 recovered its year-to-date losses and stood above its 200-day MA, while BTC traded at an 18% discount to its own 200-day MA ($76,466) at month-end. Macro repair is purely a stock market story; BTC did not get an invitation. The Bank of Japan raised rates by 25bp to 1.00% (the highest since 1995) on June 16th, but the yen fell rather than rose, breaking through 162 at month-end to hit a nearly 40-year low, laying the groundwork for potential intervention that poses a risk to global risk assets.
Equity markets experienced extreme rollercoaster rides: early in the month, the Nasdaq broke 27,000 for the first time, the Nikkei pushed to 70,000, and the KOSPI hit repeated highs with multiple two-way circuit breakers in a single month. On June 6th, the non-farm payrolls report triggered a global chain reaction crash (KOSPI -8.4% circuit breaker in a single day). By month-end, the AI capital expenditure bubble was systematically priced in for the first time: the Philadelphia Semiconductor Index fell 7.87% on June 23rd, Apple surged and then plunged 6.1% in a single day due to "AI infrastructure costs passing to end consumers," Micron's explosive earnings and South Korea's massive semiconductor national investment package kept the narrative from dying completely. The harsh reality for crypto throughout the month was: When AI rallied, there was no spillover effect; when AI crashed, there was full resonance.
II. Geopolitics: Four Rounds of Rollercoaster, Crypto Absorbs Only Bad News, Ignores Good News
The Middle East in June completed a full cycle of "rupture—actual combat—agreement—re-escalation—ceasefire."
Early in the month, the negotiating farce quickly devolved into live fire: On June 2-3, the US and Iran conducted military strikes against each other. On June 10-11, the US military launched multiple airstrikes on Iranian soil; Iran announced the closure of the Strait of Hormuz, stranding over 160 oil tankers; the IMO, for the first time in its history, advised commercial vessels to avoid the strait. Market pricing momentarily switched from a "geopolitical premium" to "wartime discounting," with WTI surging to $96.
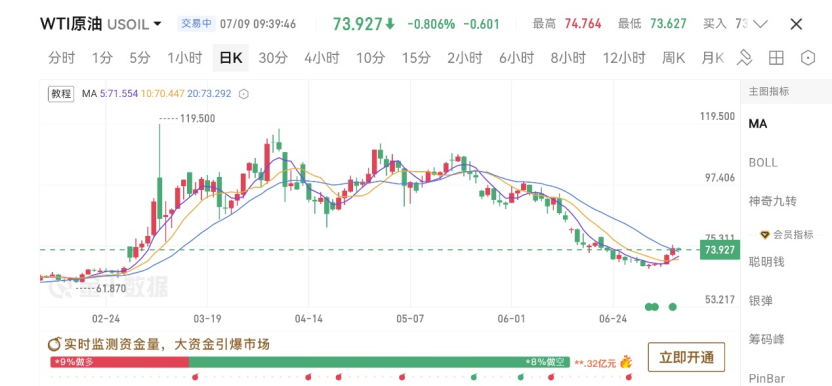
Mid-month, the narrative did a 180-degree turn: On June 14th, Trump announced a "birthday gift" agreement and the full reopening of the Strait. On June 17th, an MoU was signed remotely and took effect immediately. Oil crashed from $86 to $76, the safe-haven premium in gold evaporated, and BTC only managed to reclaim the 65-66K corridor—Oil was repricing based on real demand outlooks; BTC was just repricing based on the disappearance of a single headwind.
Late month, "sign first, then shoot": On June 25th, a cargo ship was attacked by drones. On June 26th, the US military conducted airstrikes again, and Iran retaliated against US military outposts. On June 28th, another ceasefire was agreed upon pending talks in Doha, which Iran subsequently denied, and Israel publicly threatened "independent action."
Gold fell from $4,483 at the start of the month to below $4,000 by month-end, a decline of roughly 10%. Every injection and withdrawal of the geopolitical premium was priced into precious metals, but BTC refused to rally on any de-escalation and fell fully on every escalation—The "digital gold" narrative was thoroughly invalidated in June; BTC was traded purely as a high-beta risk asset for the entire month.
III. Fund Flows: Largest Monthly ETF Outflows in History; Buying Power Waning
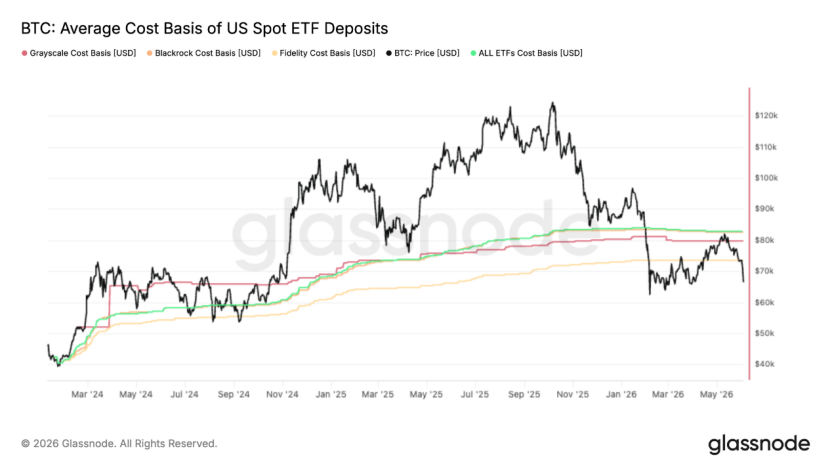
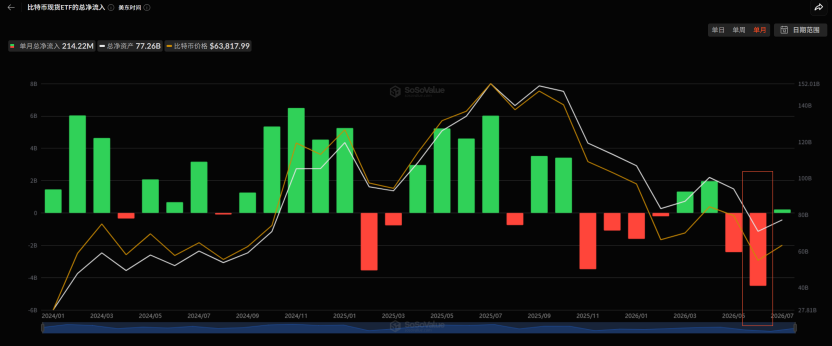
First, BTC spot ETFs saw record outflows of approximately -$4.51 billion for the month, in a "three-wave amplification" pattern: The early-month crash saw outflows of -$3.45 billion over 11 consecutive days, with a single-day peak of -$520 million. The mid-month geopolitical détente saw only a couple of small inflow days in the tens of millions, making the consecutive outflow streak the longest since inception. Late month, despite a seemingly easing geopolitical backdrop, the situation worsened, with a single-day outflow of -$696 million on June 25th, a new phase high. This round of redemptions was "orderly but persistent," more about rational realization of profits by institutions that built positions at far lower prices than outright panic—but this doesn't change the conclusion: "Good news fails to bring back flows, bad news accelerates the exit," the most important incremental inflow channel was in a state of drainage for the entire month. The 82.8K bounce in mid-May was precisely rejected at the ETF aggregate cost basis of 83K—the average ETF investor spent the entire month in unrealized losses, creating a structural supply overhang from "holders using bounces to reduce positions."
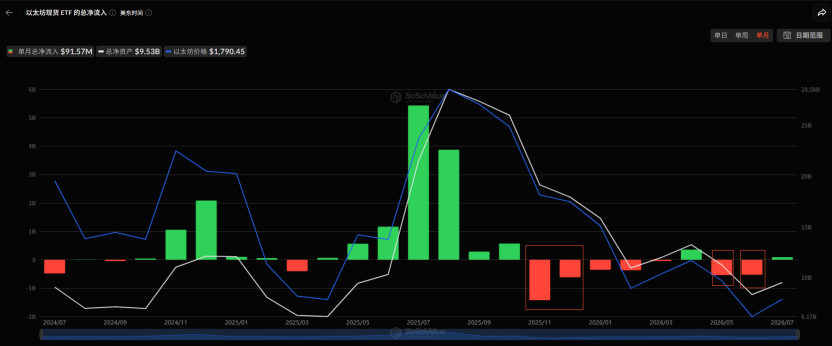
Second, ETH spot ETFs saw net outflows of approximately $550 million for the month. The only countervailing force came from the DAT side: Bitmine increased its holdings by about 280,000 ETH counter-cyclically, bringing its total position to 5.7 million ETH. Sharplink resumed accumulation after an 8-month hiatus. However, the entire DAT industry's AuM has shrunk from $220 billion to $140 billion, with financing virtually halted except for the top two or three players. Net inflows into corporate treasuries plunged from a peak of >$500M/day in April-May to nearly zero in June—another marginal buying force extinguishing.
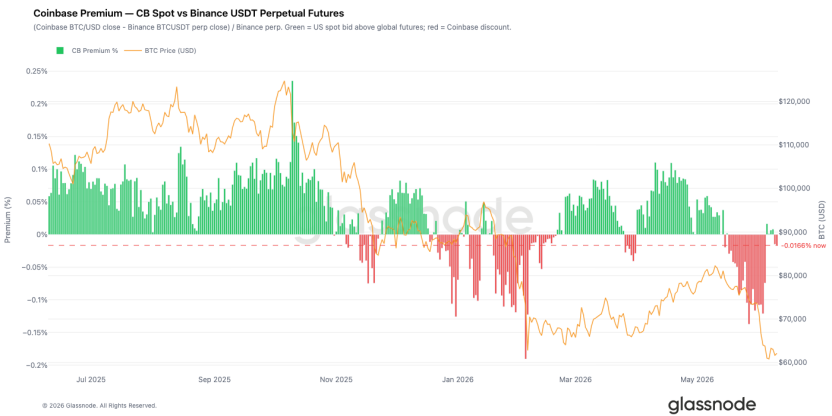
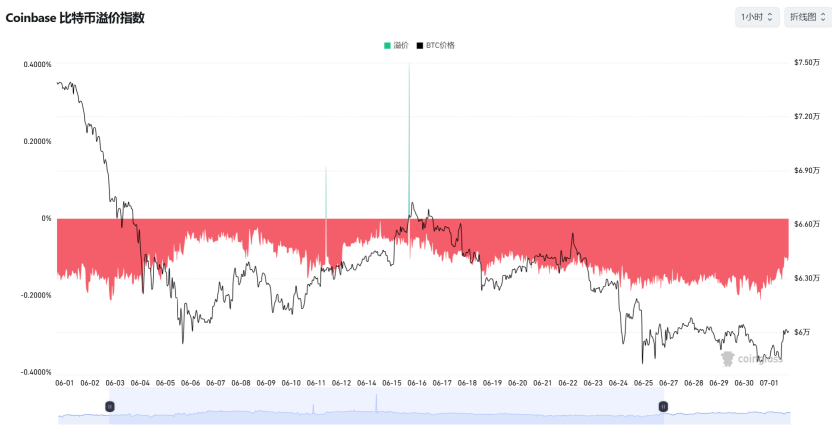
Third, the Coinbase premium was deeply negative for most of the month, but a crucial marginal change appeared in late June: after BTC broke below 62K, the Coinbase Spot CVD Bias turned positive first, while Binance's remained negative—US institutions started absorbing supply on the spot side, while offshore speculative capital remained defensive. Combined with Binance's order book depth imbalance swinging to its strongest buy-side dominance in months, within this "sell ETF + buy spot" hedging structure, real US buying power was actually re-emerging at these lower levels.
IV. On-Chain: Structural Shift from Failed Bounce to Emerging Accumulation
June presented the most contradictory yet information-rich on-chain landscape of the month, with the overall evolution showing a clear chain of "falsification—capitulation—healing—accumulation."
The core signal at the start of the month was a falsified bounce. The 7-day moving average of the Realized Profit/Loss Ratio crashed from 3.16 to 0.29. The 90-day moving average failed to touch the 2.0 threshold throughout, confirming the 82K bounce as a bear market rally rather than a structural shift. The short-term holder cost basis fell below the True Market Mean for the first time since January 2022, solidifying the "late-stage bear market" structure. Single-day realized losses expanded to $1.35 billion, with $770 million coming from capitulation by buyers at the cycle top, indicating that overhead supply was starting to realize losses materially.
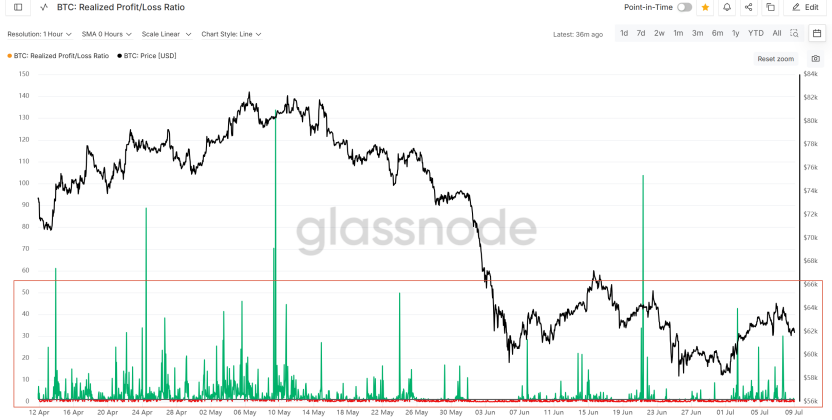
Subsequently, capitulation deepened but had not yet reached historical extremes. The AVIV z-score touched a low of -1.09, entering the historically extreme discount zone. The short-term holder profitable supply ratio briefly fell to just 0.6% (4-year average: 55%), meaning over 95% of new buyers were simultaneously underwater. The STH-SOPR z-score hit a low of -1.86, just 0.14 standard deviations away from the -2 "severe capitulation" threshold. The market was in a typical uncomfortable middle ground—realized losses confirmed a deep bear market, but had not yet reached the final intensity needed to catalyze a durable rebound.
Entering the second half of the month, signs of healing began to appear. The short-term holder cost basis shifted down to 71.4K, marking the first systematic instance of new buyers building positions below the cycle mean—a key early step in bottom formation. The 90-day moving average of Net Realized P/L remained at -$205 million/day, continuing to push the market's center of gravity towards the Realized Price (53.4K). The dense supply cluster of short-term holders in the 66.8K–70.7K range was clearly identified as the most immediate overhead resistance zone.
The most important shift at month-end was the emergence of accumulation, and for the first time, it showed broad-spectrum, cross-cohort characteristics. The Long-Term Holder Net Position Change turned positive, ending the prolonged distribution phase. The Accumulation Trend Score rose significantly, with cohorts holding less than 1 BTC and 100–1,000 BTC showing near-perfect accumulation scores, and larger entities (1k–10k BTC) also turning net buyers. The LTH supply share rose to 88.1%, a multi-year high. Concurrently, a cycle-level milestone occurred—the total supply in loss (10.83 million coins) exceeded the supply in profit (9.22 million coins) for the first time. Historically, this kind of collapse in profitable supply has been the breeding ground for a massive transfer of coins from weak hands to strong hands.
Extreme signals on the valuation front are also worth noting. The Ahr999 index reading at month-end was 0.283, a level historically seen only at a handful of moments such as late 2011


