
Monera Digital|Crypto Market May Report: Four Key Reasons Behind the Accelerated Market Decline
- Core Viewpoint: In May, the Bitcoin market experienced two shifts in pricing power. First, it was suppressed by macroeconomic factors, and then the decline was driven by internal capital attrition. While the macro environment improved towards the end of the month, the crypto market refused to rally, indicating that internal deleveraging has become the core drag, with the market entering an accelerated phase of the deep bear cycle.
- Key Factors:
- Macro & Geopolitics: The rebound in US inflation and personnel changes at the Federal Reserve led the market to price in "forced rate hikes," pushing the 30-year US Treasury yield to 5.19%. After geopolitical tensions eased at the end of the month, the correlation between Bitcoin and the Nasdaq turned deeply negative, with stocks rising while the crypto market fell independently.
- Capital Outflows: Bitcoin spot ETFs saw a net outflow of $2.425 billion for the entire month, the third-largest monthly outflow on record. The Coinbase premium index turned entirely negative, indicating systematic de-risking of crypto assets by US institutions.
- On-Chain Capitulation: The short-term holder MVRV ratio fell below the 1.0 breakeven line into loss territory. The NUPL indicator dropped from the "euphoria" zone to the edge of "hope-fear," confirming panic selling and capitulation.
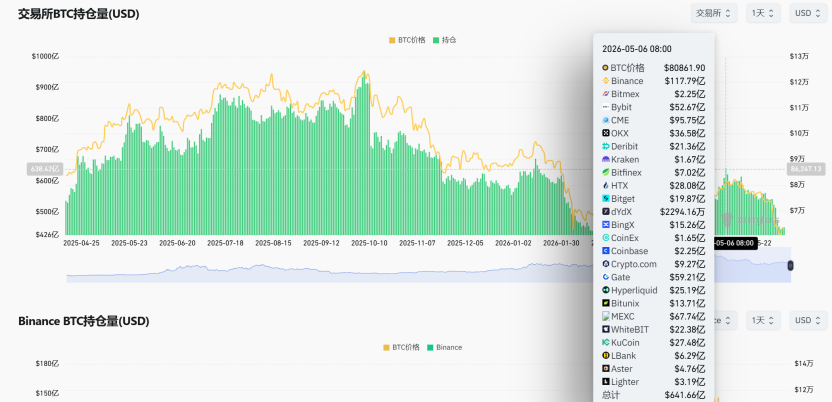
- Derivatives Risk: Open interest counterintuitively rose to over $64 billion. By the end of the month, long positions saw $307 million in liquidations (compared to only $90 million for shorts), completing a deleveraging event.
- Key Defense Line Breached: Bitcoin's price broke through the $75,000-$76,000 cost basis of publicly listed company reserves, and a gamma squeeze by market makers was triggered, leading to momentum-driven selling.
- Cycle Value Zone: The 200-week moving average percentile dropped to 10.2%, placing it in the historically undervalued territory. However, history shows that a trough in this percentile to a price reversal typically takes 3-6 months.
Core Conclusions
May was a month of two transfers of pricing power. First, the risk-free rate seized pricing power from crypto narratives, fully exposing Bitcoin's high-beta characteristics; then, at the end of the month, with both interest rates and geopolitical tensions easing, internal capital outflows and holder capitulation took over price control.
Price-wise, BTC briefly surged to the $82,850 area at the start of the month but subsequently faced sustained downward pressure, closing the month at $73,674, forming a clear downward trend throughout the month. The most noteworthy period was the final week – the external environment had effectively turned accommodative, yet the crypto market refused to respond. This is a textbook case of "liquidity transmission failure" and a classic example of the brutal nature of a deep bear market.
The synchronized deterioration across three internal lines of the crypto market was the true root cause of May's decline:
· First, double hemorrhage of incremental capital. BTC spot ETFs saw net outflows of $2.425 billion for the full month, the third-largest monthly outflow since BTC ETFs were launched (only behind February 2025's $3.555 billion and November 2025's $3.481 billion), while stablecoin supply contracted simultaneously.
· Second, holder capitulation-style selling. The short-term holder MVRV fell below the 1.0 breakeven line into loss territory, presenting a textbook capitulation pattern on-chain.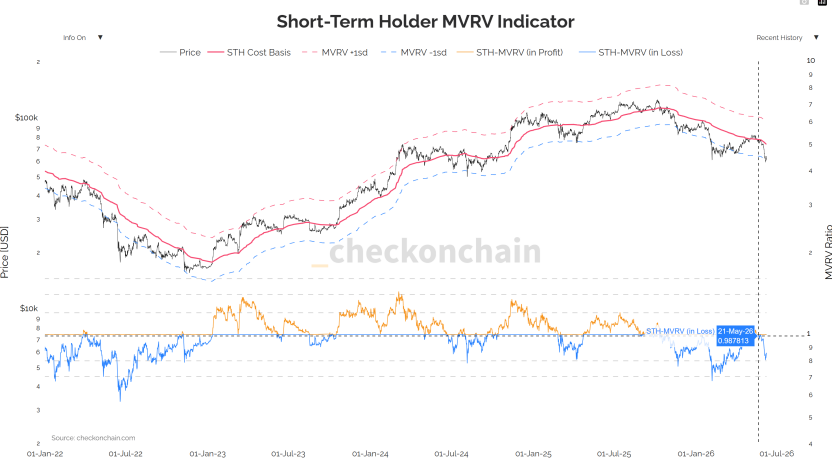
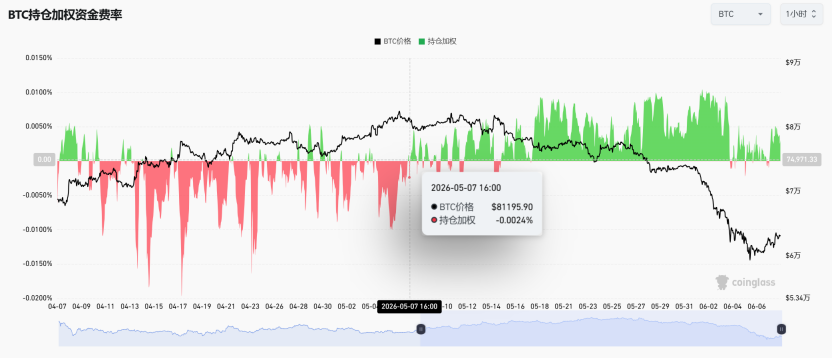
· Third, derivatives longs adding leverage against the trend. Open interest counterintuitively increased to over $64 billion, with funding rates turning positive, ultimately culminating in a devastating deleveraging event with $307 million in long liquidations (vs. only $90 million for shorts).
May marks the "launch" of a new phase of independent decline following the end of a rebound consolidation, and an "acceleration phase" of cyclical deep bear market cleansing. When it stops no longer depends on macro factors, but on whether off-exchange capital can stop the bleeding and whether long-term holder distribution can slow down.
I. Macro & Geopolitics: Two Transfers of Pricing Power, Transmission Fracture in Final Week
Phase One: Inflation Rebounds Again, Easing Expectations Dashed
The April CPI released on May 12 was the first inflection point of the month. While seemingly moderate on the surface, the structure deteriorated – core services inflation (supercore) accelerated for the third consecutive month, the most sticky dimension directly linked to employment and wages. The following day, April PPI surged to 6.0%, the highest since late 2022; concurrently, China's PPI turned positive for the first time in 41 months, ending the "Chinese goods deflation" tailwind that had suppressed global inflation for two years.
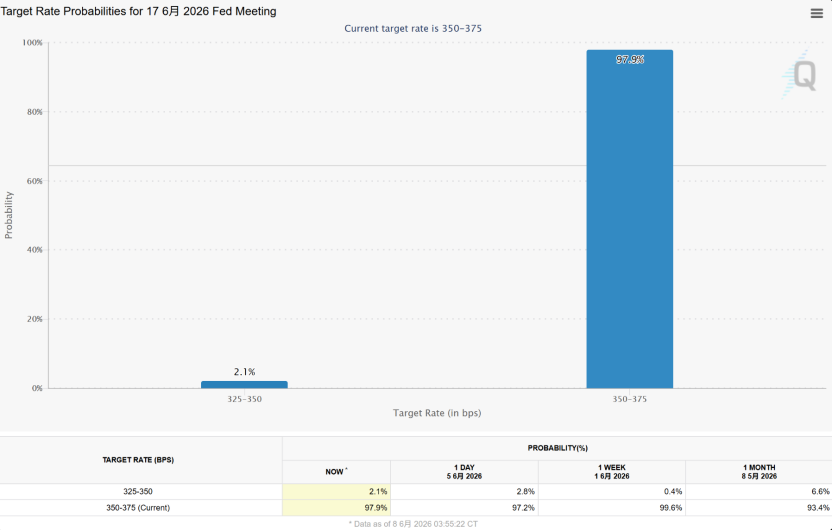
The market's focus underwent a paradigm shift: from "when will rates be cut" to "how much will rates be raised." It's crucial to clarify the timeframe here – a rate hike at the upcoming meeting is almost off the table (CME shows >99.4% probability of no change in June), but the tail risk of the policy path has been significantly adjusted upward. The market no longer believes in automatic rate cuts and is instead pricing in "forced rate hikes." This shift alone is sufficient to systematically raise the discount rate for all high-beta assets.
Phase Two: Fed Personnel Earthquake, Reaction Function Becomes Unstable
On May 15, reformist Kevin Warsh officially took the helm of the Federal Reserve, pushing a "de-transparency" agenda to abolish the dot plot and cancel press conferences. On the same day, the outgoing chair broke the Fed's 75-year precedent by announcing she would remain as a governor until 2028 to provide internal checks and balances. This represents the deepest internal power split within the Fed since 1951. Its market implication isn't about the policy direction debate itself, but a significant decline in the predictability of the reaction function. Bond markets responded directly: the 30-year Treasury yield pushed to 5.19%, the highest since the eve of the subprime crisis; the dollar index hit a six-week high. For assets valued by discounted cash flow, this is a direct and unresolvable blow.

Phase Three: Geopolitical Ice Breaks, But Transmission Chain Fractures
Geopolitics was the core disruptor for oil prices, and consequently the inflation path, in May, unfolding in four stages: "easing - fading - escalation - ice breaking." Early-month dovish rhetoric sent WTI down over 7% in a single day, and BTC broke above $80,000 for the first time; mid-month, US-Iran negotiations stalled; late-month saw frequent conflict escalation, with Brent hovering around $107–$111. The script flipped at the end of the month – on May 28, the US and Iran reached a 60-day truce memorandum, ensuring "unrestricted passage" through the Strait of Hormuz and Iran clearing naval mines. The geopolitical premium was largely digested, with WTI closing at $88.53.
Entering the final week, the negative feedback loop that dominated mid-month – "geopolitical tension → high oil prices → sticky inflation → rate hike expectations → strong USD and bonds → risk asset pressure" – was abruptly interrupted. The 10-year Treasury yield fell approximately 11 basis points for the week to 4.45%; the dollar index dropped to 98.91; the S&P 500 gained 1.43% for the week, the Nasdaq rose 2.39% to consecutive record closes, and the Nikkei surged over 1200 points in a single day. Logically, this combination of "lower rates, lower oil, lower dollar, higher equities" should have provided significant support for crypto, but the market refused to respond. This is a clear signal of crypto's deterioration.
The complete reset of correlations reinforces this point. Mid-month, Asia-Pacific risk appetite (South Korea's KOSPI fell 5% in a day triggering a circuit breaker) briefly caused a rise in the BTC-Nasdaq correlation, but entering late month, the 30-day rolling correlation coefficient between BTC and the Nasdaq dropped significantly and turned deeply negative, hitting a one-year low. The same positive macro news was channeled into completely different fates: stocks rallied together while crypto fell alone – empirical evidence of this deep negative correlation.

This decoupling has a dual meaning. In the short term, it is objective confirmation that "internal cleansing is dominant" – crypto is no longer moving in sync with macro risk appetite but is driven by its own capital flows and positioning. In the medium term, it means that even if US stocks continue to hit new highs, the pull effect on crypto will be extremely limited. However, a layer of medium-term vigilance is warranted: Goldman Sachs warns that global visible crude oil inventory is only enough for 73 days of demand; geopolitical easing does not mean oil prices have peaked. The latent concern of inflation remains high. What is its impact on risk assets?
II. Capital Flows: Monthly ETF Reversal, Coinbase Premium Deteriorates
This is the most directionally significant part of the month, presenting the most direct evidence of "internal hemorrhage."
Monthly ETF Flows: Complete Reversal from April Inflows to May Outflows
Looking at BTC spot ETFs first. April saw net inflows of $1.966 billion, pushing cumulative net inflows to an all-time high of $58.088 billion, with total net assets exceeding $100 billion for the first time at $100.532 billion. In May, the flow flipped completely – total net outflows reached $2.425 billion, the third-largest monthly outflow since the product's inception, behind only February 2025 (-$3.555 billion) and November 2025 (-$3.481 billion). Cumulative net inflows fell back to $55.663 billion, and total net assets shrank to $94.169 billion, evaporating over $6.4 billion in a single month.
The key point is this was a progressive escalation within the month, not a one-time shock: cumulative net outflows stood around $1.417 billion by mid-May, expanding to the full month's $2.425 billion by month-end. Capital didn't stabilize; instead, it accelerated its flight towards the end of the month.
ETH spot ETFs confirmed the trend: April still saw net inflows of $356 million, with total net assets of $13.253 billion; May flipped to net outflows of $541 million, also the third-largest monthly outflow historically (behind November 2025's $1.424 billion and December's $617 million), with cumulative net inflows falling back to $11.37 billion and total net assets shrinking to $11.266 billion. Both BTC and ETH saw net inflows in April and significant net outflows in May, each recording their third-largest monthly outflows on record – this constitutes a systematic reduction in institutional allocation to the entire crypto asset class.
The conclusion is clear: The "ETF marginal buyer" narrative that dominated the entire rally since the halving effectively exited in May. The most important incremental capital channel transformed from a "capital engine" in April into a "pump draining water" in May. (Is the phrase "effectively exited" appropriate? I think it can only express that a major support for April's rally has now become a headwind.)
Coinbase Premium: From Mostly Positive in April to Severely Negative in May
The Coinbase Premium Index is the most direct window to gauge US institutional spot buying and selling pressure. In April, the index was predominantly in positive territory (green), indicating net buying by US institutions on most trading days, forming the spot-side foundation for April's rebound. In May, the index was almost entirely in negative premium (red) and at a severe level – the chart shows the negative premium zone continuously expanded, reaching an extreme area near -0.22%. This represents one of the most persistent and deepest negative premium zones in the past year.
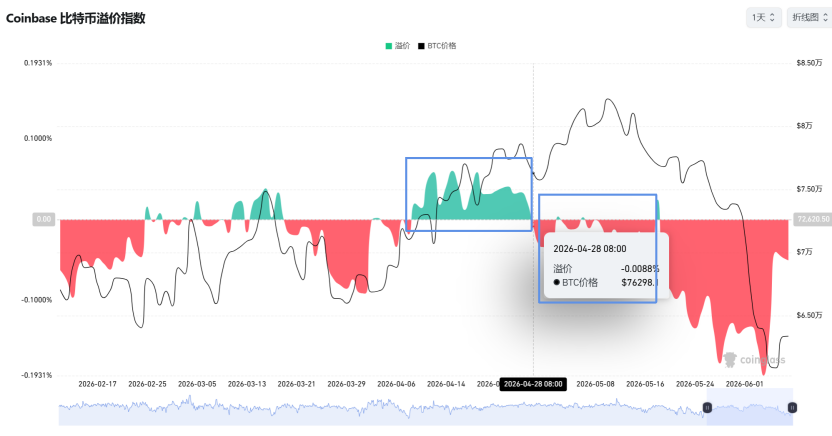
The inflection point where the premium turned from positive to negative perfectly aligns with the reversal in monthly ETF flows, reinforcing each other as evidence. The core driver behind this is an asset rebalancing led by relative yields – as US Treasury attractiveness rose, US institutions "voted with their feet," swapping BTC positions for Treasury positions. Notably, at the end of the month, as Treasury yields fell back and the arbitrage incentive weakened significantly, the negative premium not only failed to repair but held steady – indicating that institutional exit has transcended simple "yield comparison" and added a layer of confirmation regarding the downward expectation for the crypto cycle.
The Divergence Between Futures and Spot
Concurrent with the ETF slowdown, CME open interest paradoxically grew to over $64 billion. The market's driver shifted from "spot absorption" to "futures positioning extension," the so-called "resilience above 80K" being essentially not real incremental capital but the extension of leveraged positions. This ultimately led to a devastating deleveraging event, with $307 million in long liquidations versus only $90 million in short liquidations in a single week.
III. On-Chain: Full Breach of Cost Basis Matrix, Capitulation Signal Confirmed
On-chain data paints the "internal cleansing" even more vividly.
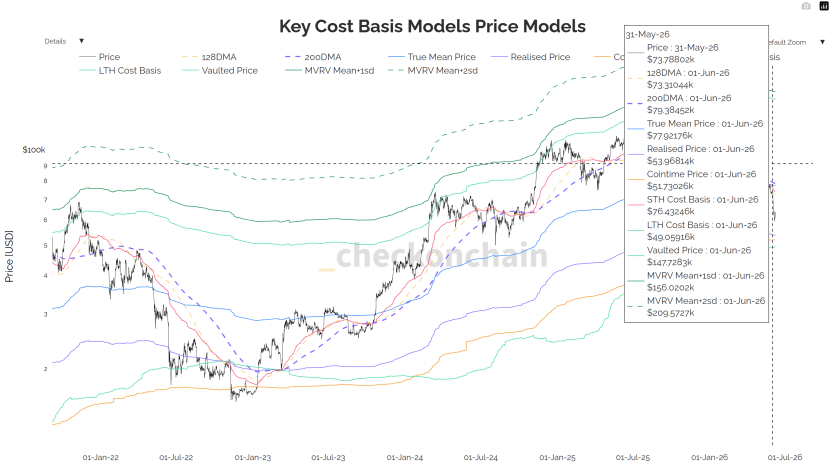
1. Realized Market Price & 200 DMA: From Unstable Hold to Confirmed Loss
According to the Key Cost Basis Models chart, the realized market price and the 200-day moving average together form the bull-bear demarcation zone repeatedly validated over the past three cycles for BTC. This zone was located in the $77–$79K range in May. The early-month rebound briefly reclaimed this level but failed to hold; after breaking down on May 18, the zone was essentially lost. By month-end, prices were trading below this demarcation zone, finding factual support from lower moving average areas. This critical threshold has transformed from support beneath feet to a "resistance ceiling" overhead, with all short-term holders deeply underwater.
2. Realized Profit/Loss Ratio: Down Instead of Up
When the 30-day moving average of this metric is above 1, it signifies profit-taking dominance. It bottomed at 0.4 in February 2026, rising to as high as 1.8 by mid-May. However, confirming a bullish reversal requires sustained levels above 2.0. The month-end reality: it not only never touched 2.0 but fell back to 1.56. Each upward move encountered selling pressure from early buyers looking to break even, making every rebound short-lived.
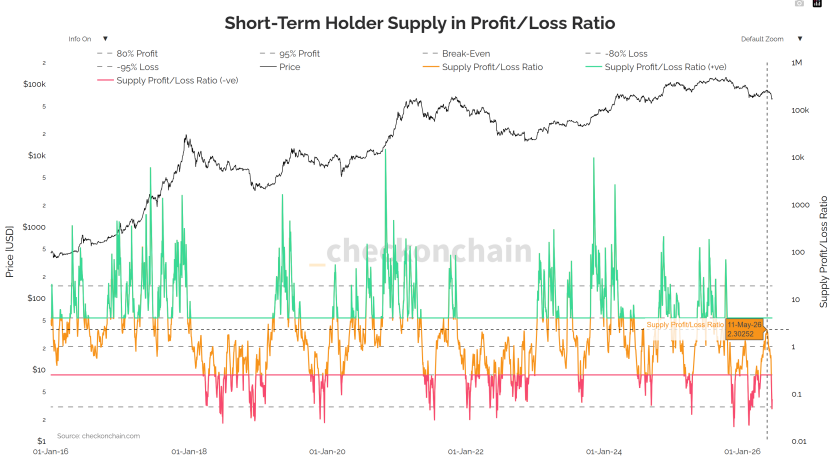
3. MVRV & NUPL: Capitulation Signal Confirmed
The STH-MVRV indicator chart clearly shows the ratio has fallen below the 1.0 breakeven line into loss territory – an objective measure of "overall short-term holder losses" and one of the most identifiable capitulation signals in past deep corrections. The NUPL indicator (Net Unrealized Profit/Loss) confirms the deteriorating sentiment: the chart shows NUPL has significantly retreated from the year-start "Optimism – Belief" zone (cyan-green) to the edge of the "Hope – Fear" zone (orange), approaching the critical transitional area seen before the 2022 bear market bottom. This is an objective measurement of the continuous compression of market unrealized profit space and a structural decline in risk appetite.


IV. Derivatives & Corporate Reserves: Leverage Cleansing and the 75K Psychological Line
1. Market Maker Gamma & Expiry Effects
Price stability in early May came from market maker long gamma. BTC was pinned in a narrow range around 80K in early May, not due to real supply-demand balance, but because market makers held substantial long gamma, creating a mechanical "price stabilizer" – selling on rallies, buying on dips, actively compressing volatility. This explains why, despite red-hot CPI and geopolitical tensions, BTC's actual volatility actually trended lower (30D RV fell to 27%).
The consecutive roll-offs of two major expiry dates directly changed the market structure. The monthly expiry on May 15 alone saw over $4 billion in notional value cleared for IBIT. After this massive position rolled off, market makers' stabilizing ability waned, and on May 18, BTC broke below $77.5K. The second, more critical monthly expiry on May 29 involved approximately $7.5 billion in concentrated settlement across the market. By the time of this expiry, the spot price had already broken through the $75K max pain zone and the zone of highest short gamma, with passive short hedging flows further exacerbating month-end selling pressure.
2. The 75K Trap Has Been Triggered
The largest cluster of short gamma was locked in the $75K–$76K range (over $8 billion in negative gamma). Once prices fell into this zone, market maker hedging reversed to pro-cyclical selling, creating a downward gamma squeeze. The month-end reality is this trap was triggered, coinciding with the breach of the cost psychology floor of corporate BTC reserve strategies. Only one line of defense remains among the three-layer resonance – the deeper, cycle-level accumulation cost basis.
3. Skew Defensive Intent Continues to Rise
1M Skew expanded from +2.7% at the start of the month to +6.2% on the day of the breakdown. 6M Skew held steady at the +10% high level. Institutions are not just hedging short-term events; they are constructing structural downside protection for the entirety of H2 2026.
4. Corporate BTC Reserve Cost Lines: From Marginal Buyer to Potential Seller
The average cost basis for major "BTC Treasury" companies is approximately in the $75,000–$76,000 range. In Q1 earnings calls, management from some firms, for the first time in a decade, conceded that they


