






Gate Research: ETF Outflows Suppress Risk Appetite, Two-Way System Navigates a Weak Market


- Core Viewpoint: In May 2023, the crypto market exhibited a pattern of an early-month surge, a mid-month decline, and low-volatility consolidation at the end of the month. Market structure shifted from spot recovery to leverage dominance, leading to losses for buy-and-hold strategies. In contrast, the two-way moving average cluster breakout strategy captured short-term trends in ETH and SOL, generating positive returns. This proves that the current environment is more suited for disciplined two-way trading rather than subjective momentum chasing.
- Key Elements:
- Market Performance: BTC, ETH, and SOL all formed local highs in early May before retreating, with monthly returns of -4.45%, -12.09%, and -1.74% (based on closing prices), respectively. ETH experienced the largest decline.
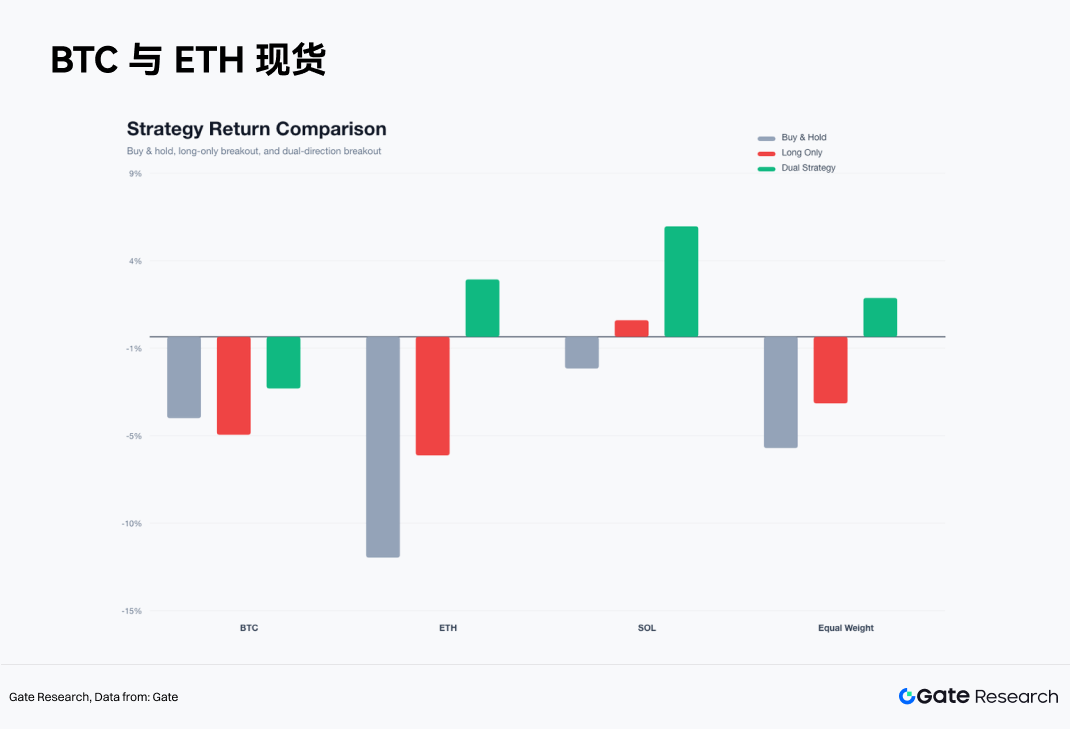
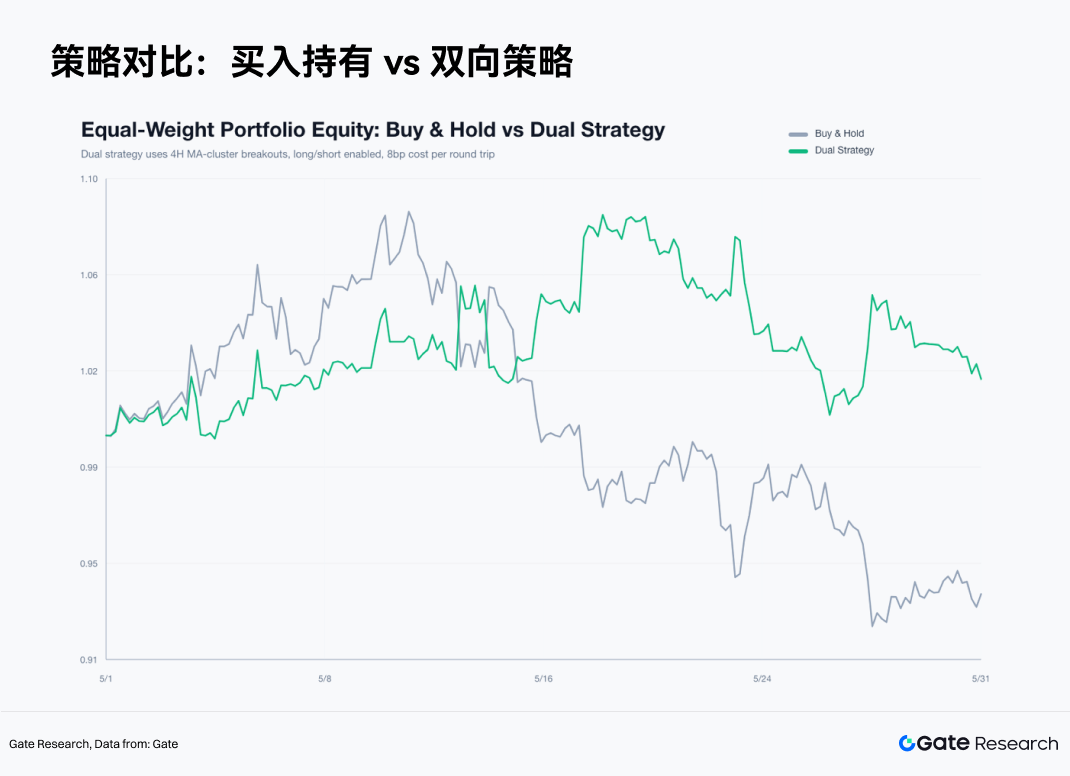
- Strategy Comparison: An equal-weight buy-and-hold strategy for the three assets yielded approximately -6.09%, a long-only strategy yielded approximately -3.65%, while the two-way moving average cluster breakout strategy yielded +2.11%, achieving an excess return of approximately +8.2%.
- Capital Structure: Mainstream ETF momentum weakened (BTC ETF experienced net outflows for 9 consecutive days totaling approximately $2.8 billion). The proportion of perpetual contract trading volume rose to 7.2 times that of spot trading. Leverage dominated price discovery, and insufficient spot follow-through led to frequent failure of breakout signals.
- Correlation with US Stocks: The correlation between BTC and the S&P 500 remained high (around 0.6). AI leaders like Nvidia attracted capital due to strong earnings, while crypto mainstream ETFs saw outflows, causing crypto asset performance to lag behind US tech stocks.
- Core Strategy Framework: After moving average cluster compression, two-way trading is allowed. EMA12 is used to manage false breakouts, a 2.5% fixed stop-loss controls single-trade risk, and a 3R take-profit retains trend gains. May's profits primarily came from the short-term trend segments after mid-month.
Summary
• In May, the crypto market experienced an initial rally at the beginning of the month, followed by a mid-month decline and low-volatility consolidation towards the end. BTC, ETH, and SOL all formed local highs in the first third of the month before entering a correction. Mainstream ETF demand weakened, perpetual contract trading volume remained high, and the market exhibited a structural characteristic of weak spot demand and leverage dominance.
• The dual-direction moving average cluster breakout strategy performed the best. The equal-weight buy-and-hold return for the three assets was approximately -6.09%, the long-only strategy returned about -3.65%, and the dual-direction strategy returned about +2.11%. Profits primarily came from the bearish trend legs in ETH and SOL, confirming that May's market was more suitable for dual-direction trend trading.
• Disciplined trading outperformed subjective judgment under low-volatility compression. The EMA12 exit mechanism effectively controlled losses from false breakouts, while the 3R take-profit preserved trend profits. The current market is still in a directional selection phase. A framework that identifies the market state, controls risk, and executes dual-direction signals is superior to a subjective, momentum-chasing approach.
The main contradiction in the crypto market during May was the divergence between spot demand and leveraged trading structures after prices peaked early in the month. BTC, ETH, and SOL all formed local highs in the first part of May, followed by pullbacks and low-volatility consolidation. BTC fell from its early-month 4H closing price of $77,117.4 to $73,684.0 at month-end, a monthly return of -4.45%. ETH dropped from $2,283.02 to $2,007.0, a monthly return of -12.09%. SOL declined from $83.90 to $82.44, a monthly return of -1.74%. Although SOL's closing decline was smaller, it reached an intra-month high of $98.40 before retreating to around $80.00, indicating actual trading volatility was significantly higher than the monthly price change suggests.
The results of this month's strategy backtest are clear. The equal-weight buy-and-hold return for the three assets was approximately -6.09%; the long-only moving average cluster breakout strategy returned about -3.65%; and the dual-direction moving average cluster breakout strategy returned +2.11%. The dual-direction strategy outperformed the buy-and-hold by approximately +8.2%. Profits mainly originated from the bearish trend legs after mid-May, with ETH and SOL contributing the most significantly.
The effective trading framework for May was: first, identify compression in the moving average cluster; then, allow prices to complete a directional selection either upwards or downwards; manage failed signals with EMA12; limit single trade losses with a 2.5% fixed stop-loss; and preserve trend profits with a 3R take-profit (3 * 2.5%). This framework was suitable for the market structure in May, characterized by low win rates, high risk-reward ratios, and concentrated trend legs.
Factors related to the US stock market reinforced this assessment. In May, AI-related heavyweight stocks were supported by earnings and industry prosperity. Nvidia reported strong quarterly results, with Q1 FY2027 revenue around $81.6 billion, and briefly revisited the ~$5 trillion market capitalization milestone. The correlation between BTC and the S&P 500 remained high. The observed sample showed the 30-day correlation reached approximately 0.74 at points within 2026, hovering around 0.6 by the end of May. Crypto assets did not escape the risk budget framework set by the US stock market in May. Consecutive outflows from BTC ETFs, weakening demand for ETH ETFs, and an increased proportion of perpetual contract trading volume collectively resulted in the crypto market underperforming US tech leaders.
I. Market Structure: Early-Month Rally, Mid-Month Weakness, Late-Month Low Volatility
The first phase of May occurred from May 1st to May 6th. BTC rose from $77,117.4 to $82,828.2, ETH climbed from $2,283.02 to $2,423.99, and SOL continued its ascent until May 11th, reaching $98.40. During this phase, short-term moving averages shifted upward, volatility remained within a controllable range, and the market exhibited characteristics of a recovery rally. SOL showed leading elasticity, with capital willing to take on higher risk exposure at the start of the month.
The second phase began around May 7th. BTC failed to stabilize above $82,000, ETH could not sustain levels above $2,400, and SOL formed its monthly high near $98. Breakout signals began to fail frequently, with prices pulling back to the EMA12 level, repeatedly triggering exits. BTC long trades initiated after May 14th hit stop-losses. ETH long trades initiated after May 6th consistently failed. SOL entered a clear downward trend segment after May 15th.
The third phase was concentrated from May 22nd to the end of the month. BTC moved down to around $73,000, ETH approached $2,000, and SOL returned to the vicinity of $82. Price fluctuations narrowed, the width of the moving average cluster decreased, and the market entered a new phase of compression.
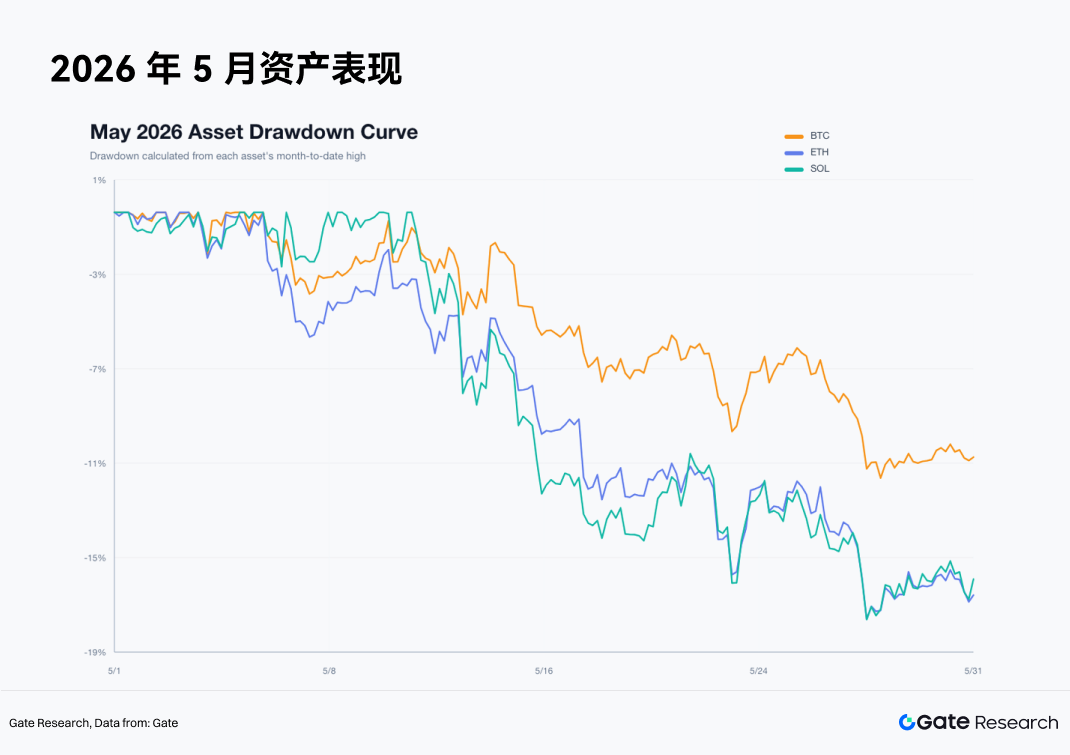
The magnitude of intra-month drawdowns validated the assets' roles. BTC's maximum drawdown from its high to low was approximately 12.5%, ETH's around 18.8%, and SOL's about 18.7%. BTC served as the risk anchor, while ETH and SOL functioned as amplifiers of risk appetite. When BTC weakened, ETH and SOL experienced faster drawdowns, suggesting the need to reduce long exposure in high-beta assets at the strategy level.
II. Capital Structure: Stablecoins Remain Ample, Mainstream ETF Demand Weakens
As of May 31st, the total market capitalization of stablecoins across all exchanges was approximately $320 billion, with DeFi TVL around $251 billion. Underlying USD liquidity did not show a systemic retreat. 24-hour CEX spot trading volume was about $124.2 billion, while CEX perpetual trading volume was approximately $894.4 billion, meaning perpetuals trading was about 7.2 times spot volume. Price discovery was primarily driven by the derivatives market.
ETF flows became a significant source of pressure in the second half of May. Public news indicated that BTC spot ETFs experienced net outflows for 9 consecutive trading days, totaling approximately $2.8 billion. This included a single-day net outflow of about $649 million, with BlackRock's IBIT alone seeing a daily outflow of roughly $448 million. ETH ETFs also faced pressure, with net outflows of around $241 million in the last week of May.
However, capital did not entirely leave the crypto asset space. Altcoin ETFs like SOL and XRP saw small net inflows, and new ETF narratives such as HYPE also garnered attention. Capital migrated from mainstream BTC and ETH ETFs towards thematic ETFs and more volatile assets. This structure suggests the core issue was the cooling of demand in mainstream spot markets, with capital participating in local rotations and short-term trading.
Derivatives data corroborates this. The active buy/sell ratio for BTC, ETH, and SOL was all below 1, indicating slightly stronger active selling pressure. The funding rate was around 0.01%, not reaching extreme crowding levels. The May market was in a typical state: active leveraged trading, insufficient spot market follow-through, weak active buying pressure, and price breakouts that easily turned into false moves.
III. US Stock Market Linkage: AI Leaders Support Nasdaq, Crypto ETFs Create Capital Pressure
The performance of crypto in May must also be viewed within the context of US stock market risk appetite. The correlation between BTC and the S&P 500 remained elevated. The 30-day rolling correlation reached approximately 0.74 at points within 2026, still hovering around 0.6 by the end of May. On a larger scale, BTC acted as a high-beta risk asset this month, lacking stable, independent safe-haven characteristics.
Key support on the US stock side came from AI and large-cap tech stocks. Nvidia reported strong quarterly results in May, with Q1 FY2027 revenue around $81.6 billion. Its stock price hit an all-time high and briefly revisited the ~$5 trillion market capitalization milestone. AI powerhouses supported Nasdaq risk appetite through confirmed earnings. Crypto assets lacked an equally strong earnings anchor, with prices influenced by ETF flows, derivatives leverage, and liquidity expectations.
This cross-asset divergence impacted May's strategy results. US tech leaders were earnings-driven, while mainstream BTC and ETH ETFs saw outflows. Capital was redistributed within large risk assets. Traditional capital continued to buy into AI leaders with higher certainty, reducing its willingness to allocate to BTC ETFs. Crypto long breakouts lacked spot market support, making volume surges prone to becoming rallies that subsequently faded.
The macro data calendar in May also compressed risk budgets. Key data during the month included NFP, CPI, PPI, the second estimate of GDP, and PCE. Employment, inflation, and growth figures directly impacted US Treasury yields, the US dollar, and Nasdaq valuations, which then transmitted to BTC ETF subscriptions/redemptions and perpetual funding rates. Towards the end of the month, the market began focusing on early June data releases (employment, ISM, JOLTS, ADP), as well as the FOMC meeting and options expiry windows. The low-volatility compression in crypto occurring around these events is reasonably explained by position reduction and decreased risk budgets.
IV. Volatility: Short-term Compression Forms, Price Strength Insufficient
At the end of May, BTC's 7-day 4H realized volatility was approximately 0.46%, and its 30-day 4H realized volatility was about 0.64%; ETH's figures were roughly 0.7% and 0.81%, respectively; SOL's were around 0.76% and 1%. For all three assets, short-term realized volatility was lower than medium-term volatility, indicating the market had entered a low-volatility compression phase.
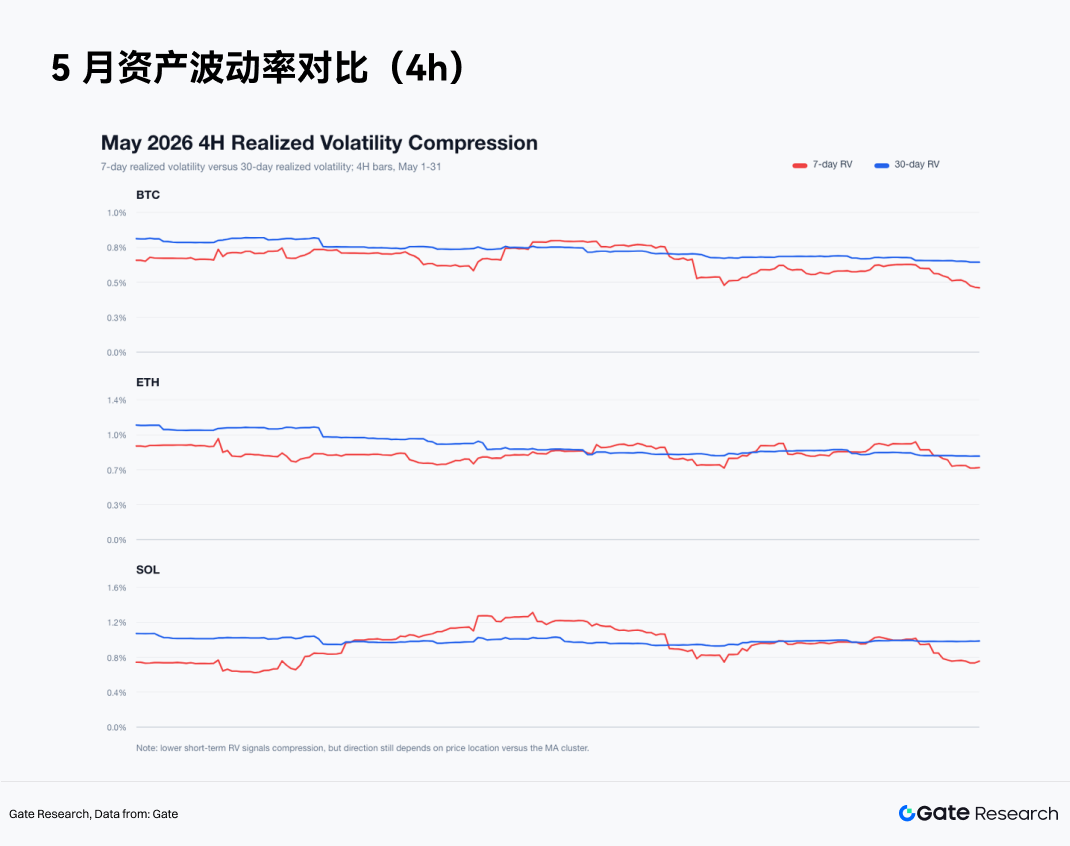
Low-volatility compression suggests a directional move is approaching, but it does not guarantee an upward breakout. At the end of May, BTC closed at $73,684.0, with its EMA12 around $73,776.35; ETH closed at $2,007.0, with its EMA12 around $2,016.34; SOL closed at $82.44, with its EMA12 around $82.39. BTC and ETH were still in a weak range, while SOL had just returned near its EMA12. With insufficient price strength, the low volatility appeared more like consolidation following a decline.
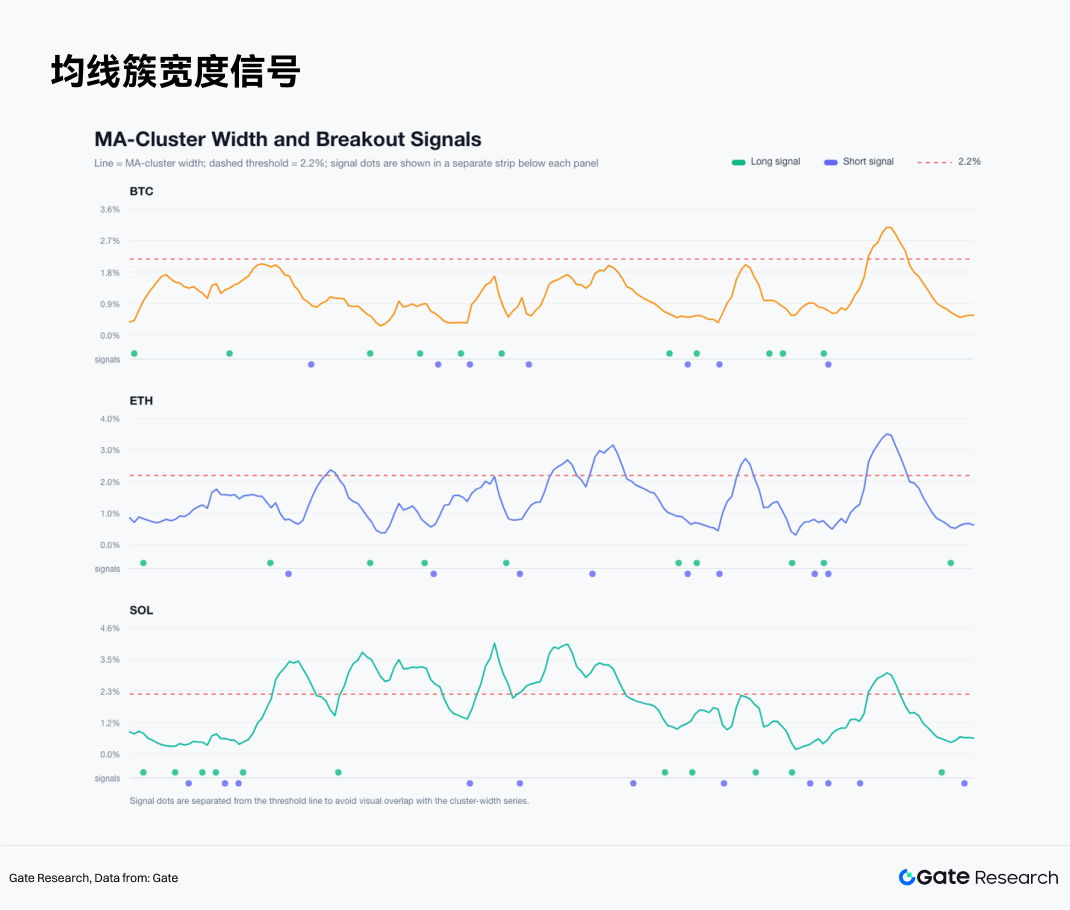
The width of the moving average cluster confirmed this. At month-end, BTC's cluster width was about 0.57%, ETH's about 0.63%, and SOL's about 0.58%, all well below the 2.2% strategy threshold. This environment can frequently generate breakout signals. May's data demonstrated that after moving average cluster compression, it is essential to allow for dual-direction trading. Trading only upward breakouts would systematically miss downward trends.
V. Strategy Backtest: 4H Moving Average Cluster Compression Breakout System
The strategy uses six moving averages to form a cluster: EMA6, EMA12, EMA24, SMA6, SMA12, SMA24. The cluster width equals the maximum value of the six moving averages minus the minimum value, divided by the current closing price. If the cluster width of the previous candle is below 2.2% and the current candle closes above the upper band of the cluster, a long position is opened at the start of the next 4H candle. If the previous candle's cluster width is below 2.2% and the current candle closes below the lower band of the cluster, a short position is opened at the start of the next 4H candle.
Exit rules are fixed. A long position is exited when the price breaks below the EMA12. A short position is exited when the price breaks above the EMA12. The single trade stop-loss is 2.5%, and the take-profit is 3R, meaning 7.5%. If a single candle triggers both take-profit and stop-loss, the stop-loss is prioritized. A round-trip transaction cost of 8bp is deducted. If a position is still open at the end of the month, it is closed at the closing price of the last 4H candle.
This report also tests two strategy versions. The long-only version only trades upward breakout signals. The dual-direction version trades both upward and downward breakout signals. Results from May show that the dual-direction version was a better fit for the market conditions.
5.1 Long-Only Strategy: Quality of Upward Breakout Signals Deteriorated
The long-only strategy was largely ineffective overall. BTC had 11 trades, a return of -5.36%, a win rate of 18.2%, and a maximum drawdown of -10.08%. ETH had 10 trades, a return of -6.49%, a win rate of 10.0%, and a maximum drawdown of -10.64%. SOL had 11 trades, a return of +0.91%, a win rate of 18.2%, and a maximum drawdown of -7.11%.
BTC's long-only profits were concentrated in the first two trades of the month. Entry on May 1st and exit on May 4th yielded a net profit of +2.09%. Entry on May 4th and exit on May 7th yielded a net profit of +0.92%. Signal quality declined thereafter. A long trade entered on May 14th hit its stop-loss, resulting in a net loss of -2.58%.
ETH's long-only performance was the weakest. An entry on May 1st and exit on May 5th yielded a net profit of +3.17%. All subsequent 9 long trades were losing trades. Most of ETH's upward breakouts were weak bounces rather than signs of trend expansion.
SOL's long-only strategy yielded a slight profit from two trades. Entry on May 5th and exit on May 8th resulted in a net profit of +3.95%. Entry on May 8th, which triggered the 3R take-profit on May 10th, yielded a net profit of +7.42%. Most other signals were losing trades. SOL was the only asset this month with positive returns from a long-only strategy, though profits were highly concentrated.
5.2 Dual-Direction Strategy: Bearish Trend Legs Contributed Main Profits
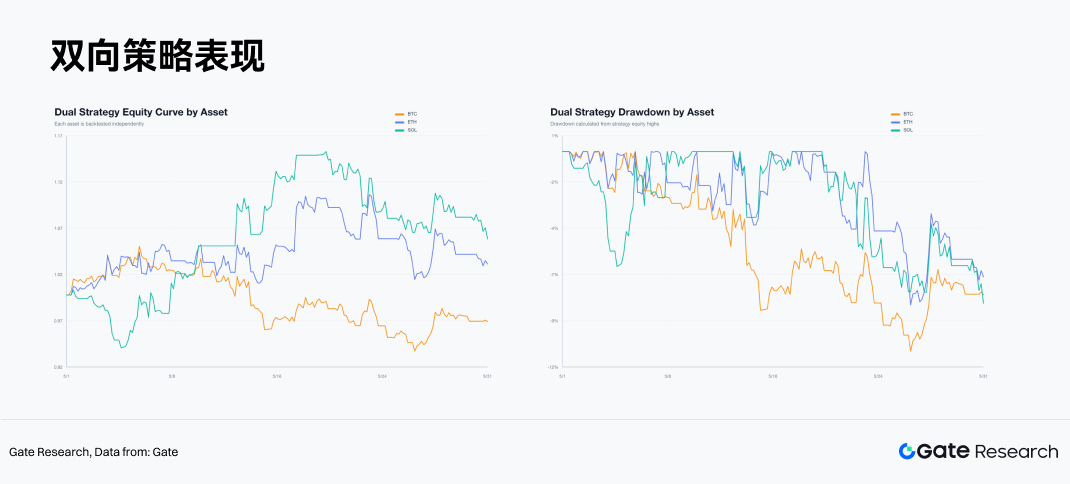
The dual-direction strategy significantly improved results. The dual-direction strategy return for BTC was -2.83%, for ETH +3.14%, and for SOL +6.05%. The equal-weight dual-direction strategy across the three assets returned +2.11%, compared to the approximate -6.09% return of the equal-weight buy-and-hold strategy over the same period.
The BTC dual-direction strategy was still unprofitable, but its loss was smaller than the long-only strategy. BTC had a total of 18 trades, a win rate of 22.2%, and a maximum drawdown of -10.74%. Two short trades made the largest contributions: a short initiated on May 15th and exited on May 20th yielded a net profit of +2.35%; a short initiated on May 26th and exited on May 30th yielded a net profit of +3.42%. BTC experienced many false signals in mid-May, causing friction from frequent long/short switching.
The ETH dual-direction strategy returned +3.14% from 18 trades, with a win rate of 38.9% and a maximum drawdown of -8.26%. Key trades included a short on May 15th that triggered the 3R take-profit on May 17th, yielding a net profit of +8.03%, and a short on May 26th exited on May 29th, yielding +2.68%. Long signals in ETH were ineffective, while short legs constituted the main source of profit.
The SOL dual-direction strategy returned +6.05% from 22 trades, with a win rate of 22.7% and a maximum drawdown of -8.17%. SOL provided both profitable long and short trend trades. A long on May 8th triggered the 3R take-profit on May 10th at 16:00, yielding +7.42%. A short on May 15th triggered the 3R take-profit on May 17th, yielding +8.03%. SOL exhibited the strongest trend elasticity but also the highest trading noise.
5.3 Trade Distribution: Low Win Rate Structure, A Few Large Trades Determine Returns
Among all 58 trades in the dual-direction strategy, the number of profitable trades was limited. BTC's win rate was 22.2%, ETH's was 38.9%, and SOL's was 22.7%. Strategy returns were generated by a few large trend trades, while losses were controlled by the EMA12 exit rule and the fixed stop-loss.


