
花旗解读:标普500基准上看8100点,但牛市“天花板”正在逼近
TL;DR
- Citi raised its year-end 2026 S&P 500 baseline target from 7,700 to 8,100, while maintaining its bull case target at 8,300.
- The upgrade is primarily driven by better-than-expected Q1 earnings and accelerated AI capex, with a new baseline EPS assumption of $350.
- Market breadth has widened from the Mag 8 to other companies and small-mid caps, but sentiment has entered euphoria territory, limiting upside potential for the second half of the year due to elevated valuations.
In its 2H 2026 US Equity Strategy report, Citi raised its year-end S&P 500 baseline target from 7,700 to 8,100 points but kept its bull case target unchanged at 8,300 points, warning that the risk-reward profile for US equities has become asymmetrical in the second half.
The key signal from the report: Citi acknowledges stronger earnings fundamentals and continued support for index upside. However, with the baseline target raised, the bull case target is only 200 points higher, implying shrinking elasticity for further upward movement.
The 8,100 target corresponds to a 23.1x TTM P/E ratio and $350 EPS. Compared to the roughly $320 EPS forecast for 2026 at the start of the year, earnings assumptions have been significantly revised upward. The bear case target is 6,800 points, based on a 20.0x P/E and $340 EPS. In other words, Citi does not deny improving fundamentals but believes current prices already price in considerable good news.
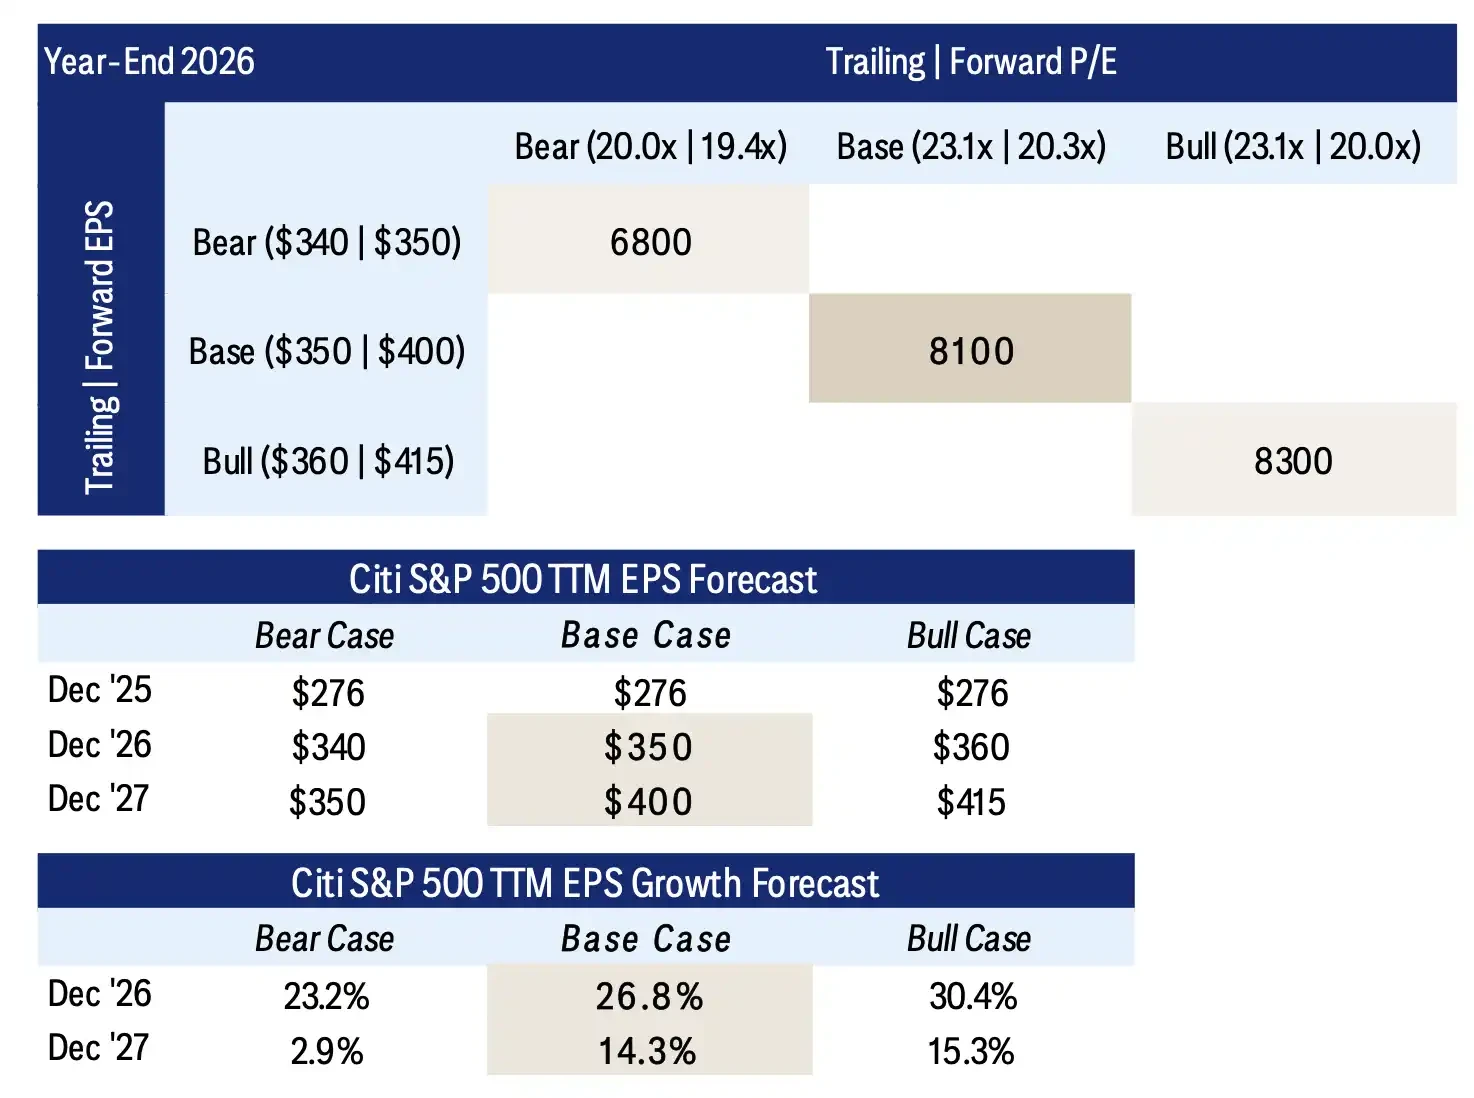
Baseline at 8,100, Bull case at 8,300, Bear case at 6,800. Baseline EPS is $350.
Earnings stronger than expected, Citi raises baseline to 8,100
The direct reason for the target upgrade is earnings. The S&P 500 recorded $81.0 EPS in Q1 2026, 13.1% higher than forecasts made at the end of last year, representing a positive surprise of 13.4%.
Tech, Communication Services, and Energy sectors drove the upward revision of full-year earnings estimates during the earnings season, with Information Technology contributing the most. Mag 8 EPS estimates for Q1 were revised up by 34.5%, indicating large-cap tech firms remain the core source of upward earnings revisions.
However, earnings improvement has begun to broaden from a few giants to a wider range of companies. Consensus EPS growth for the S&P 500 in 2026 is projected at 24.2%, with the Growth cluster seeing 41.8% growth, Cyclicals at 17.6%, and Defensives at only 5.8%. Mag 8 EPS growth is expected to be around 38%, while the remaining index constituents also show approximately 19% growth.
This makes the US stock market rally increasingly dependent on "earnings broadening." If earnings growth can transmit from the Mag 8 to more sectors and companies, the high-valuation index still has fundamental support. If the broadening effect falls short, valuation pressure at the 8,100 level will become more apparent, and more quickly.
Gains no longer solely dependent on Mag 8, market breadth is improving
Year-to-date, the internal structure of the US stock market has changed. So far in 2026, the "other 492 companies" have delivered a total return of approximately +14.9%, while the Mag 8 have actually declined by about 3.1%.
Small and mid-cap performance has also improved markedly. The S&P 600 small-cap index is up approximately +22.3% year-to-date, and the S&P 400 mid-cap index is up about +16.3%, both outperforming the broader market. For investors, this is significant: the more concentrated gains are in a few tech giants, the more the market is perceived as valuation-driven. When earnings and stock price performance broaden to more companies, the foundation for an index rally becomes wider.
Small-cap value stocks are also being placed in a supportive role. The S&P 600 Value forward P/E ratio is around 13.8x, below its 20-year median of 17.2x, with expected EPS growth of 25% in 2026. This supports a more diversified US equity allocation strategy, where capital no longer needs to solely bet on large-cap growth stocks.
However, the broadening of the rally also means more sectors have already been bought by capital. Increased market participation can enhance rally resilience but can also widen the scope of corrections when earnings realization slows down. If fundamentals fall short of expectations in the future, drawdowns may no longer be confined to a few large-cap tech stocks.
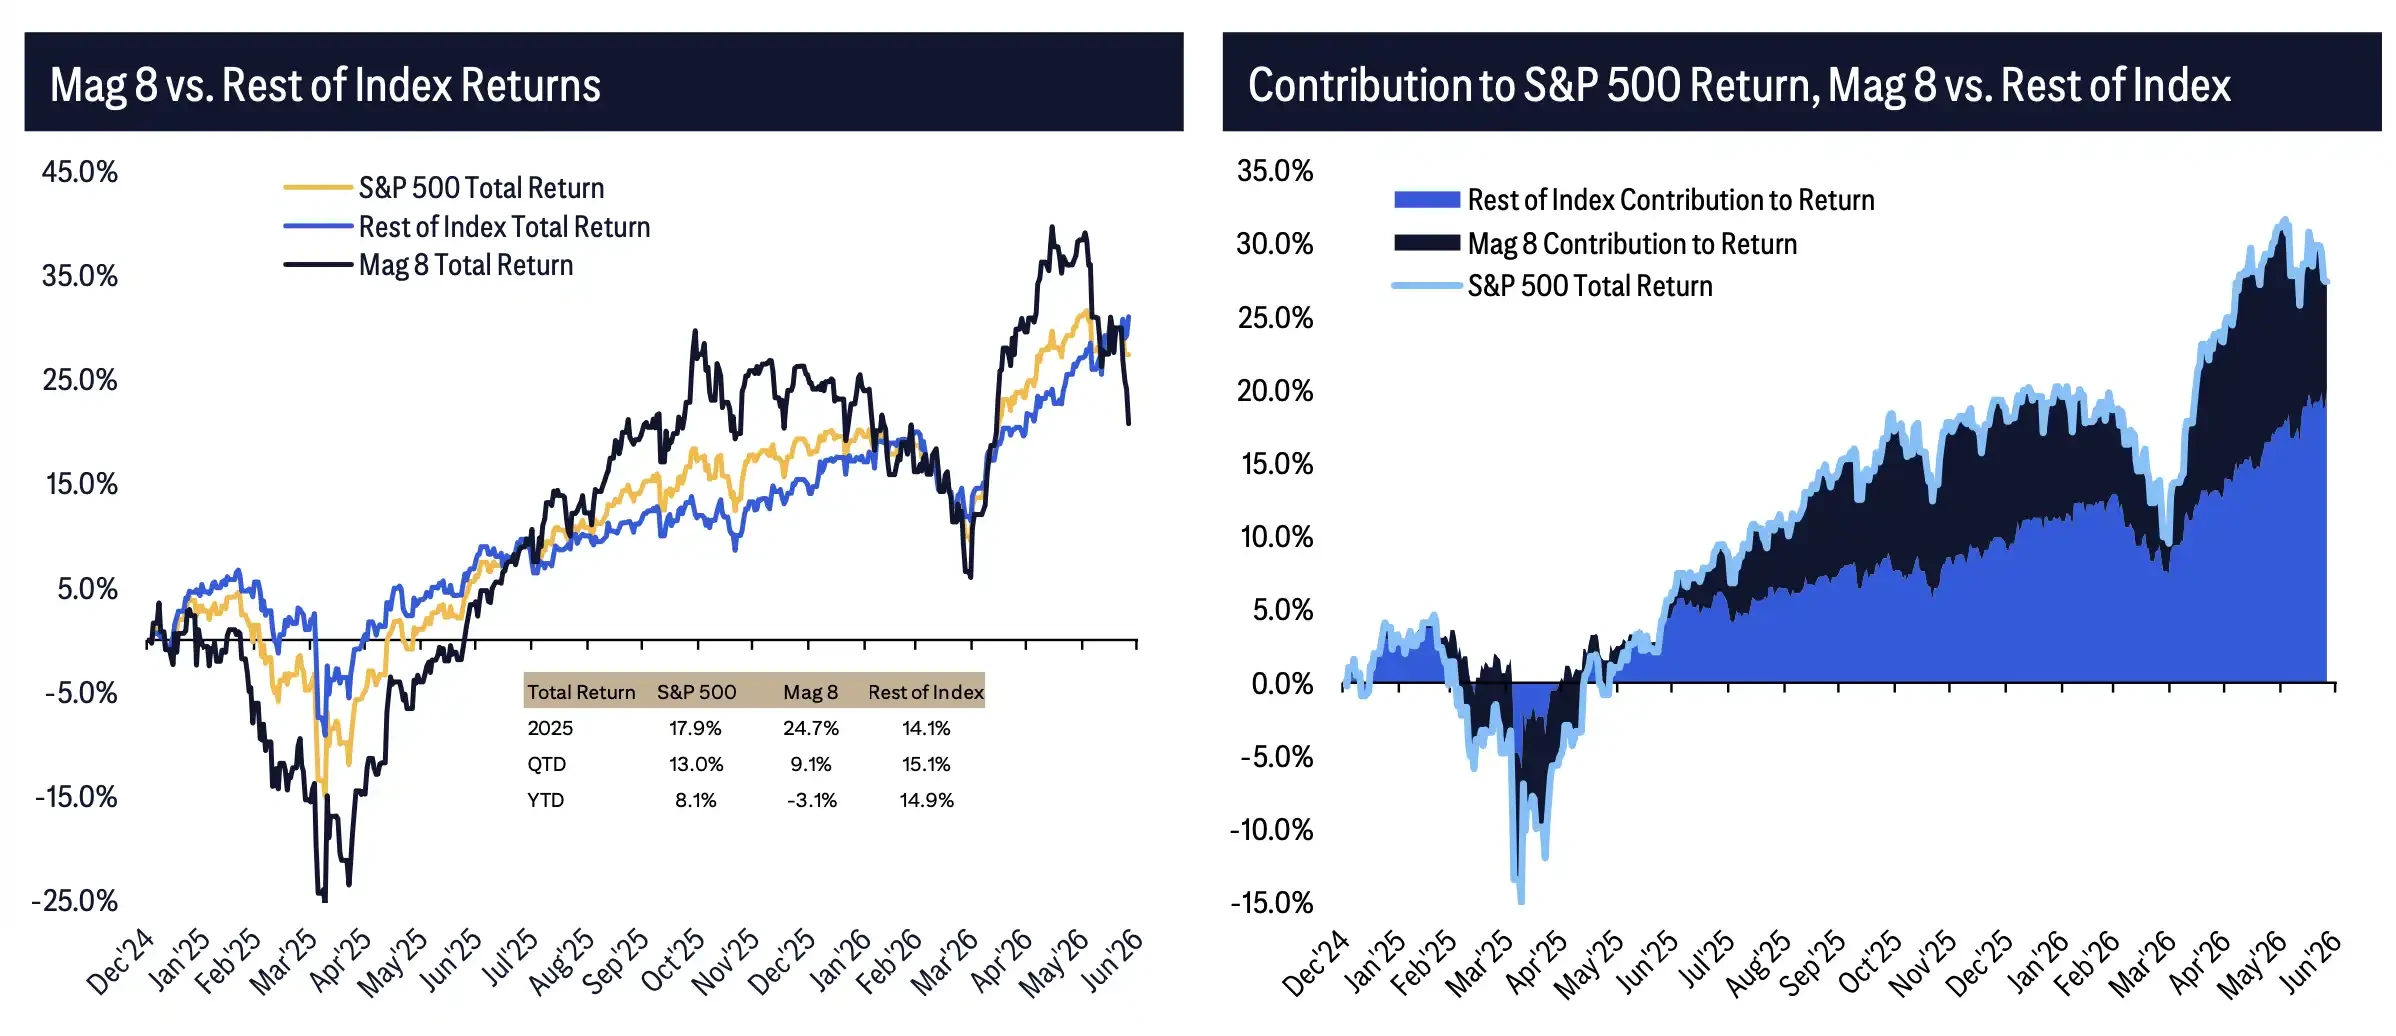
Market breadth year-to-date 2026: Mag 8 returns -3.1%, Other 492 companies approximately +14.9%.
AI spending continues to accelerate, but the market begins questioning returns
AI remains a crucial pillar for this round of earnings revisions. Capex for the S&P 500 excluding financials is expected to increase from approximately $1.20 trillion in 2025 to $1.65 trillion in 2026, with growth accelerating from 23% to 37%; it could potentially rise further to about $1.86 trillion by 2027.
The Mag 8's capex growth rate is even higher, projected to grow by 82% in 2026. Information Technology and Communication Services are the primary drivers, fueled by continued expansion in data centers, chips, cloud infrastructure, and AI training and inference demand.
This explains why Citi was willing to raise its baseline target: AI infrastructure investment is still boosting revenue, orders, and earnings expectations. But risks are accumulating simultaneously. The larger the capex scale, the more the market needs to see these investments ultimately translate into revenue, margins, and free cash flow. If AI spending continues to expand but commercialization returns are slower than expected, current upward earnings revisions could morph into future valuation pressure.
Share buybacks also provide a layer of support. Total S&P 500 buybacks over the past 12 months approached $990 billion, up 10% year-over-year. However, buyback growth rates for the Growth cluster and Mag 8 have already slowed, with more resources shifting towards capex. This suggests large-cap tech companies are reorienting their cash use from directly returning value to shareholders towards continued investment in AI infrastructure.
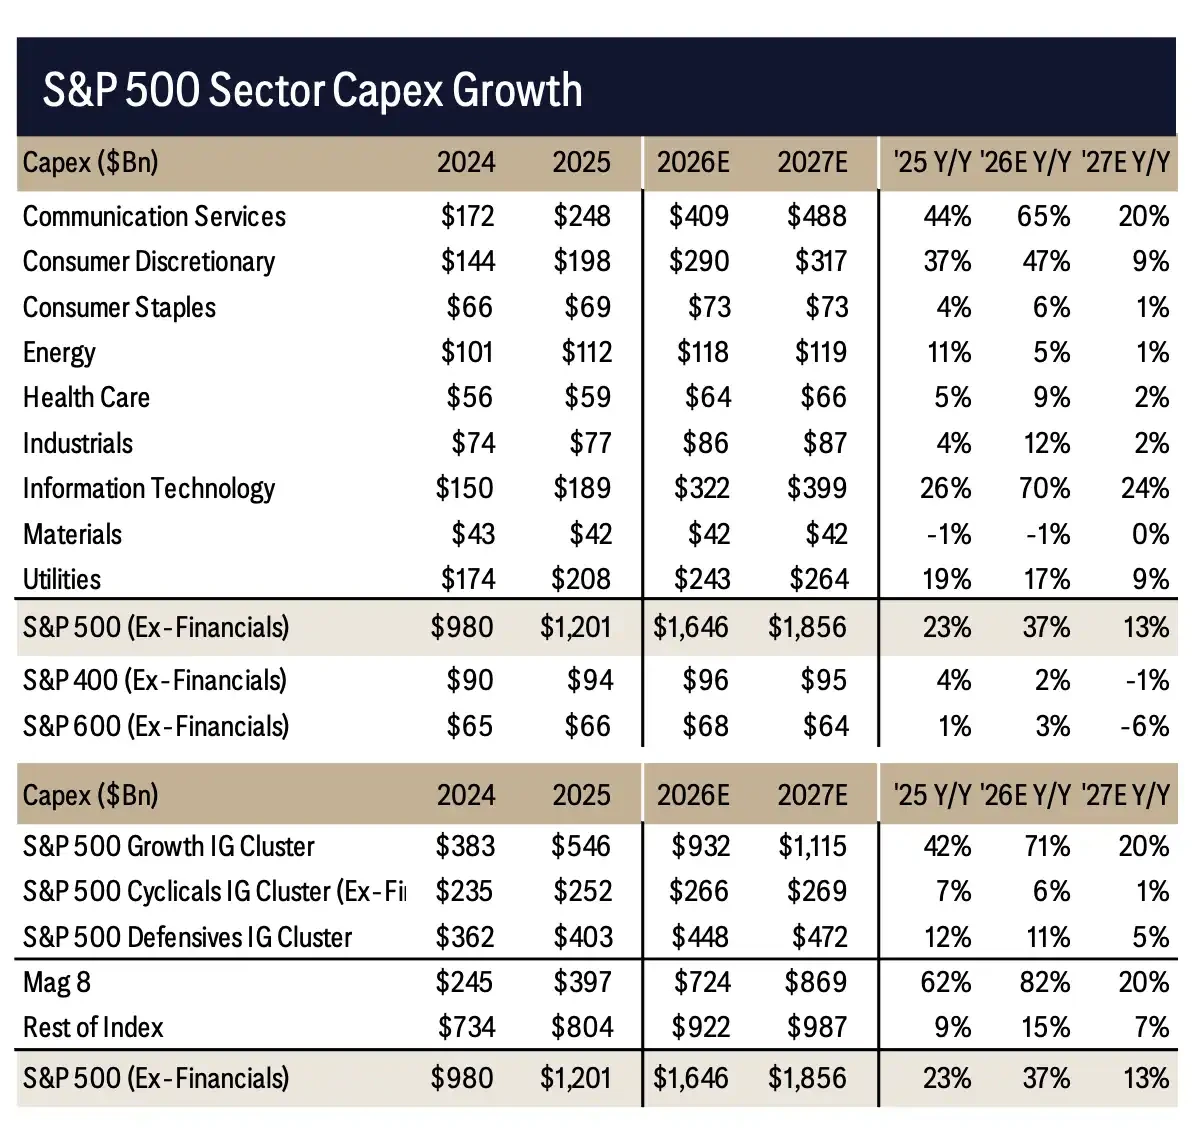
Capex acceleration: S&P 500 ex-Financials 2026E Capex ~$1.65 trillion, Mag 8 2026E growth 82%.
Sentiment enters euphoria territory; target upgrade doesn't mean chasing highs is risk-free
Citi's most cautious assessment centers on sentiment and valuation.
The latest reading of the Levkovich Panic/Euphoria Index is 1.01, having already entered the Euphoria zone, whose threshold is 0.38. Historically, starting from similar levels, the median S&P 500 return over the following year is -8.6%, with a probability of a positive return of only 35%.
These numbers make the 8,100 target look less aggressive. Earnings and fund flows can explain why the US market still has an upside basis, but sentiment indicators show the market is already in a crowded position. Net foreign buying of US equities remains strong, with the past 12 months' proportion relative to S&P 1500 market cap near a 30-year high; equity fund flows into mutual funds and ETFs are also in a 10-year high range this year. Capital is still flowing in, but the fuller the positions, the smaller the market's buffer against bad news.
Consumer resilience provides some macro support. Approximately 70% of US household debt is mortgages, many locked in at lower fixed rates, dampening the transmission of Fed rate hikes to household cash flow. Post-fiscal stimulus deleveraging has also kept household balance sheets relatively healthy.
However, high valuations, euphoric sentiment, pressure for AI capex to yield returns, and geopolitical supply shocks could still disrupt market performance in the second half of the year. Citi raised its baseline target but did not continue to raise the bull case ceiling. The core message is clear: US stocks still have earnings support, but the rally logic of the first half is difficult to simply extrapolate. For investors, 8,100 looks more like a reasonable midpoint following earnings revisions, while 8,300 serves as a reminder that room for chasing highs has narrowed.
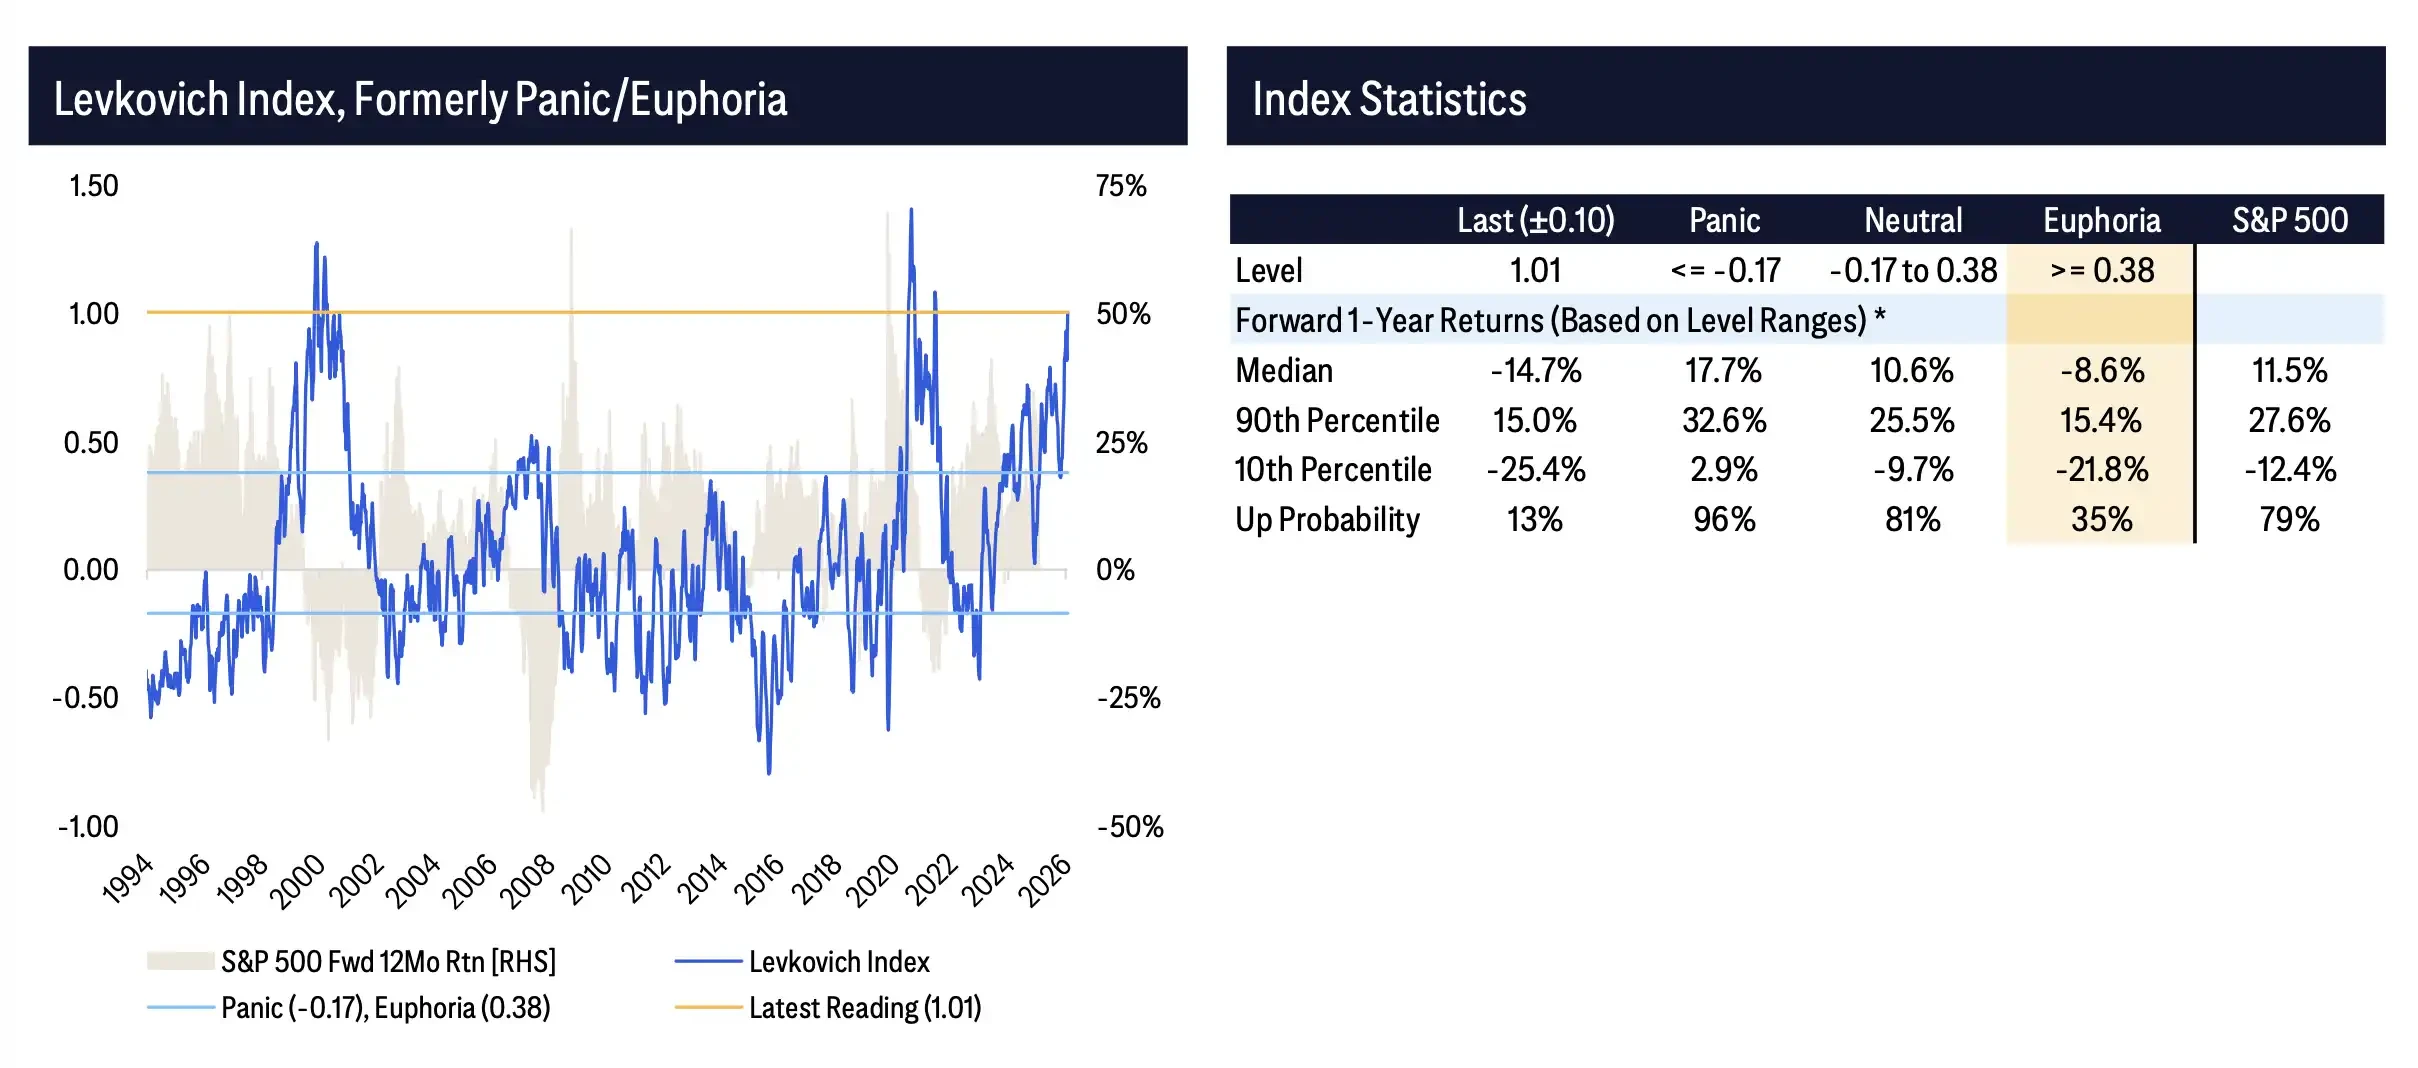
Levkovich sentiment indicator. Current reading of 1.01 enters Euphoria. The historical median forward one-year return is -8.6%.


