
机构流出与现货抛压持续,比特币54000美元成潜在底部?
- 核心观点:比特币跌破6万美元,市场处于深度损失主导环境,链上指标显示价格远低于投资者平均成本基础,ETF持续流出且期权市场偏防御性。尽管出现价值显现和选择性积累的早期迹象,但广泛需求尚未恢复,市场处于派发与价值驱动需求之间的拉锯。
- 关键要素:
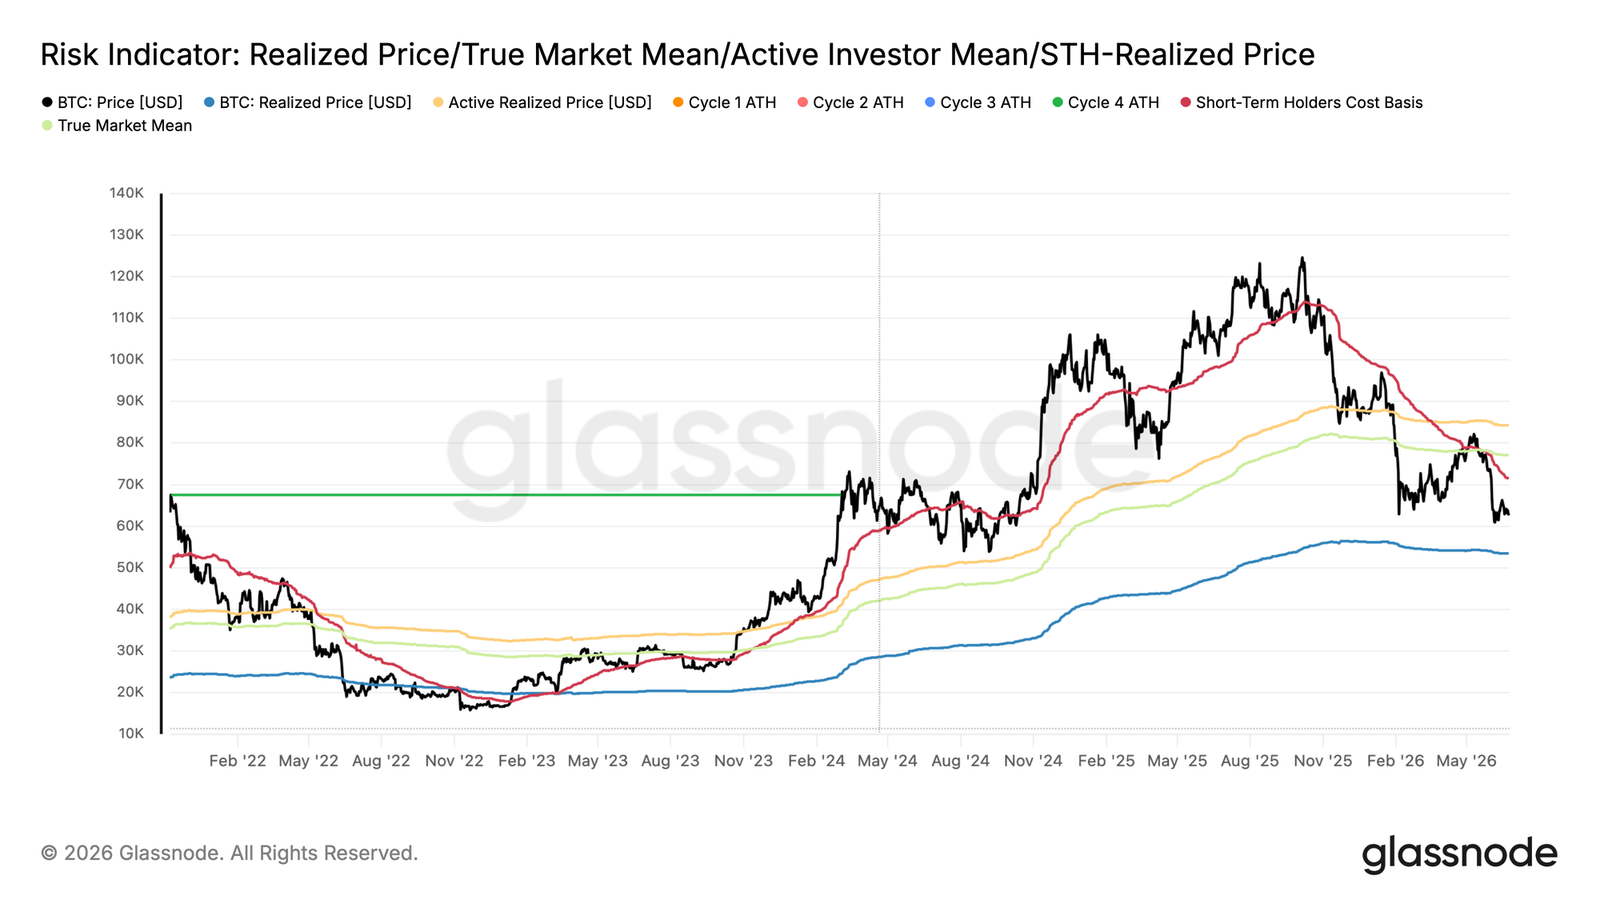
- 比特币当前交易价较真市场均价(77,000美元)折价19%,短期持有者成本基础降至71,400美元。
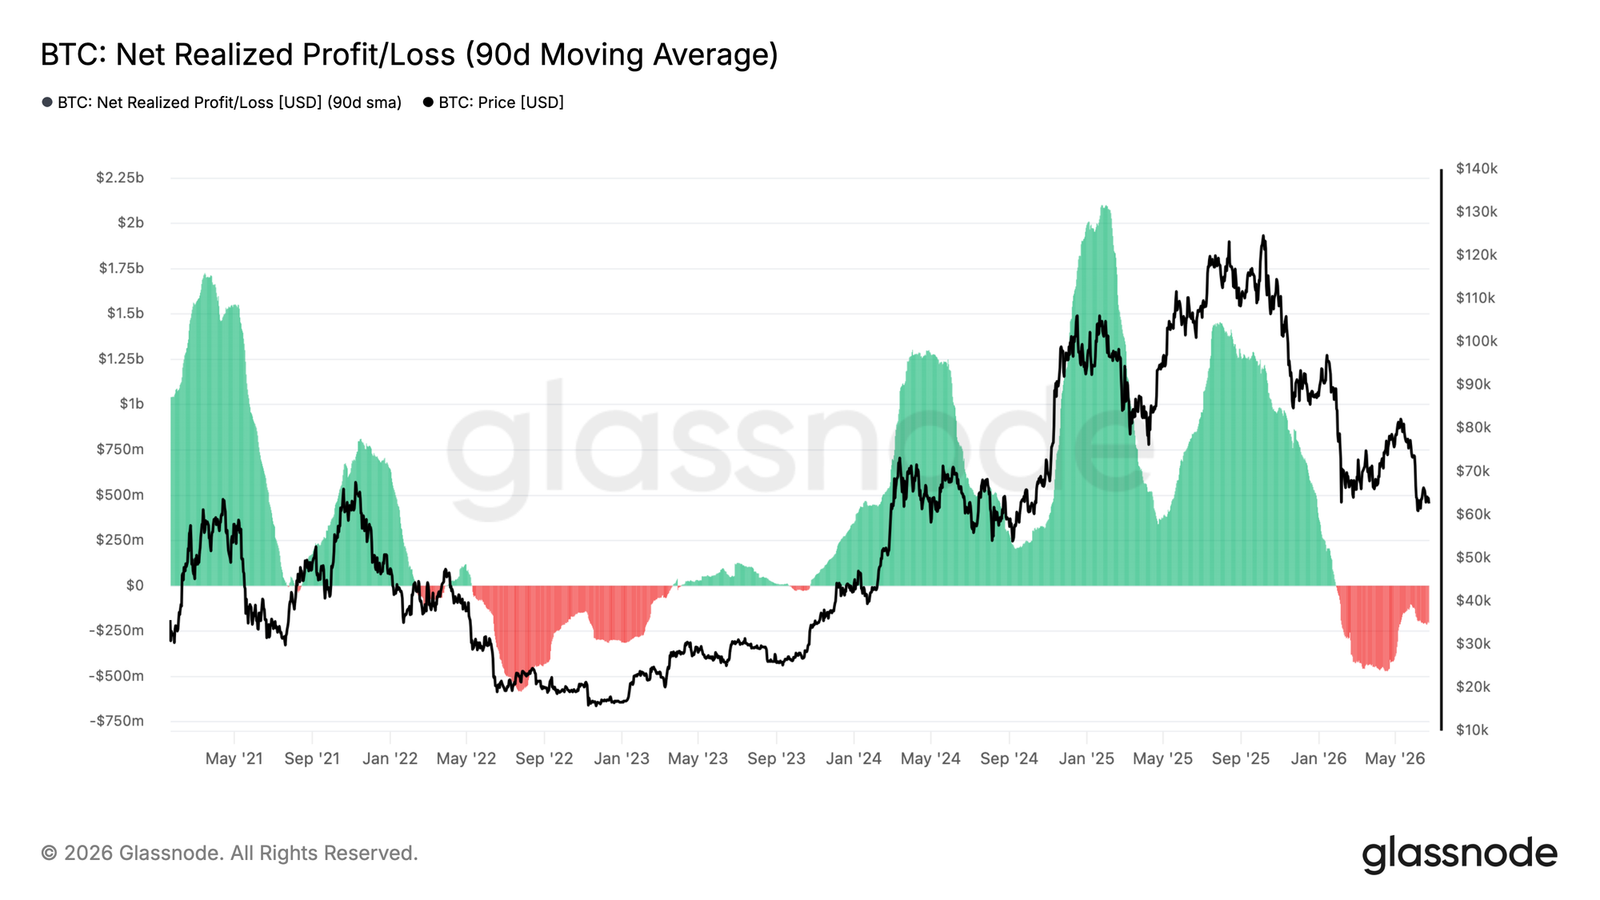
- 净已实现盈亏90日均线为每日-2.05亿美元,确认市场深度嵌入损失主导环境,重心向已实现价格53,400美元倾斜。
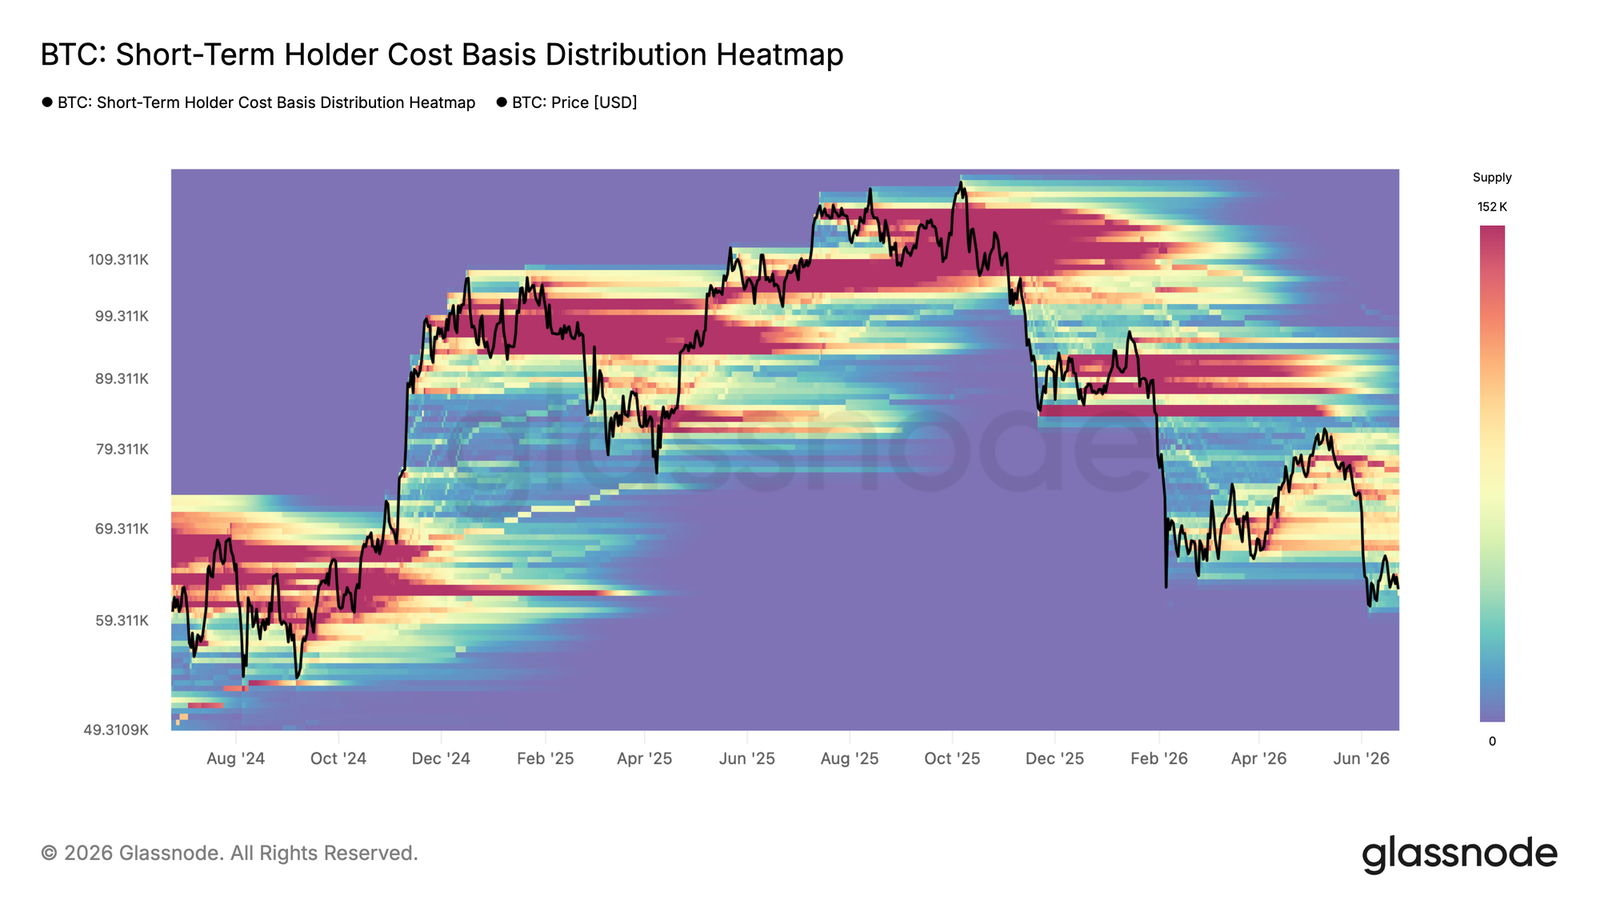
- 短期持有者密集供应簇在66,800-70,700美元区间形成直接上方阻力,限制了短期上行空间。
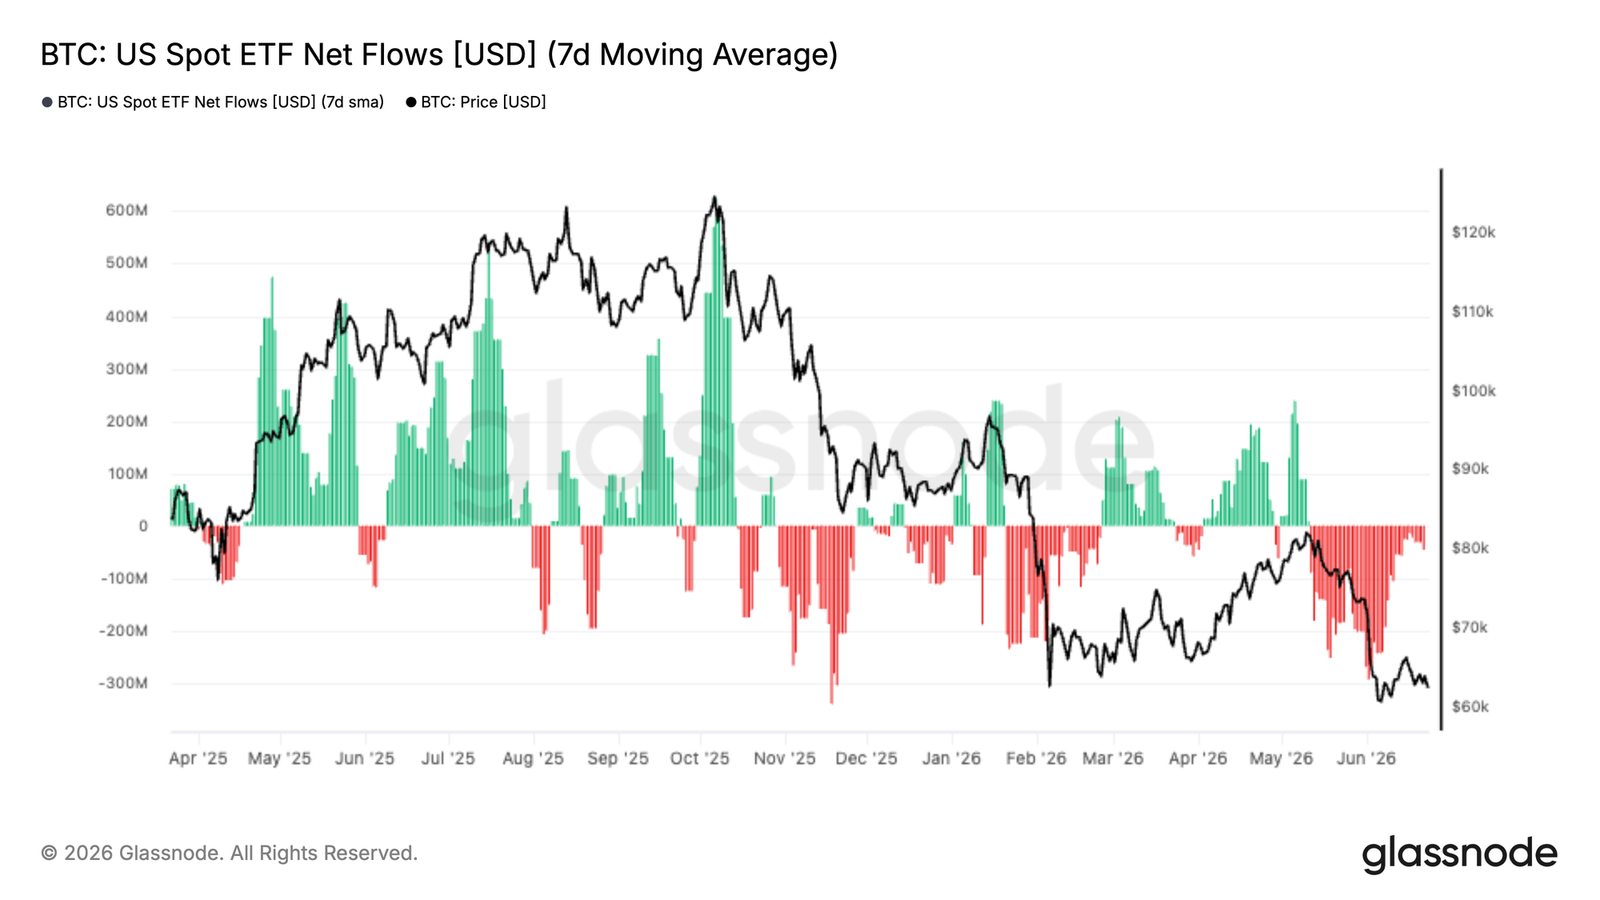
- 美国现货ETF持续净流出,7日平均净流出近每日-3亿美元,GBTC占近期赎回最大份额。
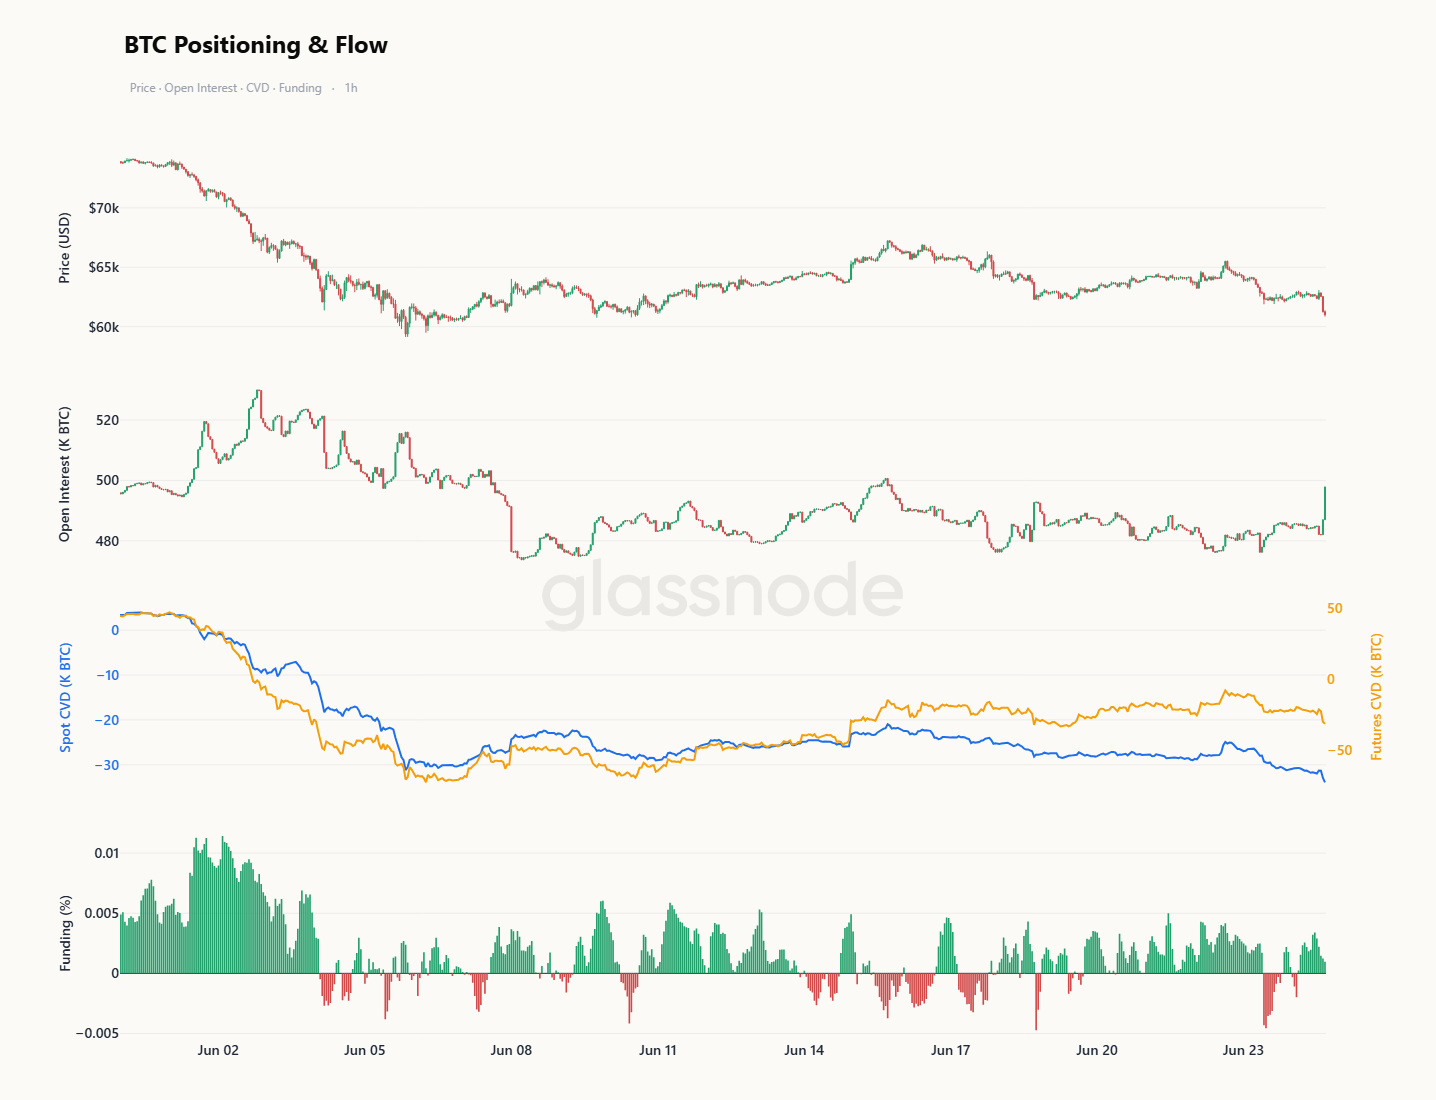
- Coinbase现货CVD显示美国买家回归,而Binance交易者仍保持防御姿态,市场结构分化。
- 期权市场中,做市商伽马仓位集中在60K-64K区间,可能抑制波动率在这一区间内;偏度上升显示下方保护需求重建。
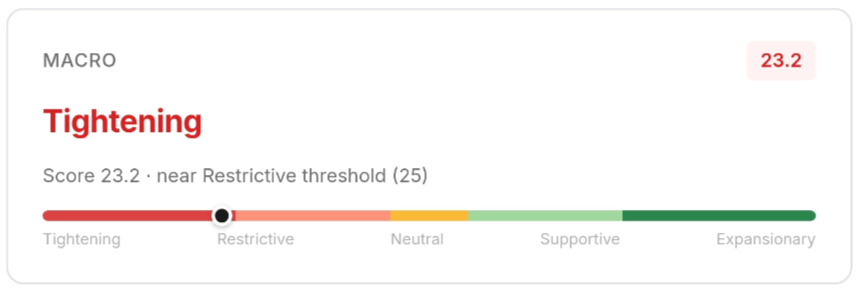
- 美元指数(DXY)重返200日均线上方,对比特币构成不利宏观信号;股市复苏(标普500上涨14%)未带动BTC。
Original Author: Glassnode
Original Translation: AididiaoJP, Foresight News
Bitcoin has dropped below $60,000, with realized losses, ETF outflows, and defensive options positioning continuing to weigh on market sentiment. Although signs of value recognition and selective accumulation are increasing, broad-based demand has yet to emerge.
Summary
- Bitcoin is currently trading at $62,300, a 19% discount to the True Market Mean Price of $77,000. The cost basis of short-term holders has dropped to $71,400, indicating that new buyers are accumulating below the cycle's average price for the first time – a constructive early step towards bottom formation. (As of writing, Bitcoin has fallen to $60,800)
- The 90-day moving average of Net Realized Profit/Loss stands at -$205 million per day, confirming the market is deeply embedded in a loss-dominant environment. The gravitational center is tilting towards the Realized Price of $53,400, rather than the True Market Mean Price.
- The dense supply cluster of short-term holders lies in the $66,800-$70,700 range, forming the most immediate overhead resistance. Until this zone is reclaimed and the path to the short-term holder cost basis is opened, the upside for short-term moves is limited.
- ETF outflows continue: Institutional demand remains weak, with GBTC accounting for the largest share of recent redemptions.
- Coinbase buyers returning: US investors are showing buying activity, while Binance traders remain defensive.
- Spot market dominates selling: Selling pressure originates from the spot market, with derivatives mainly following rather than driving the move.
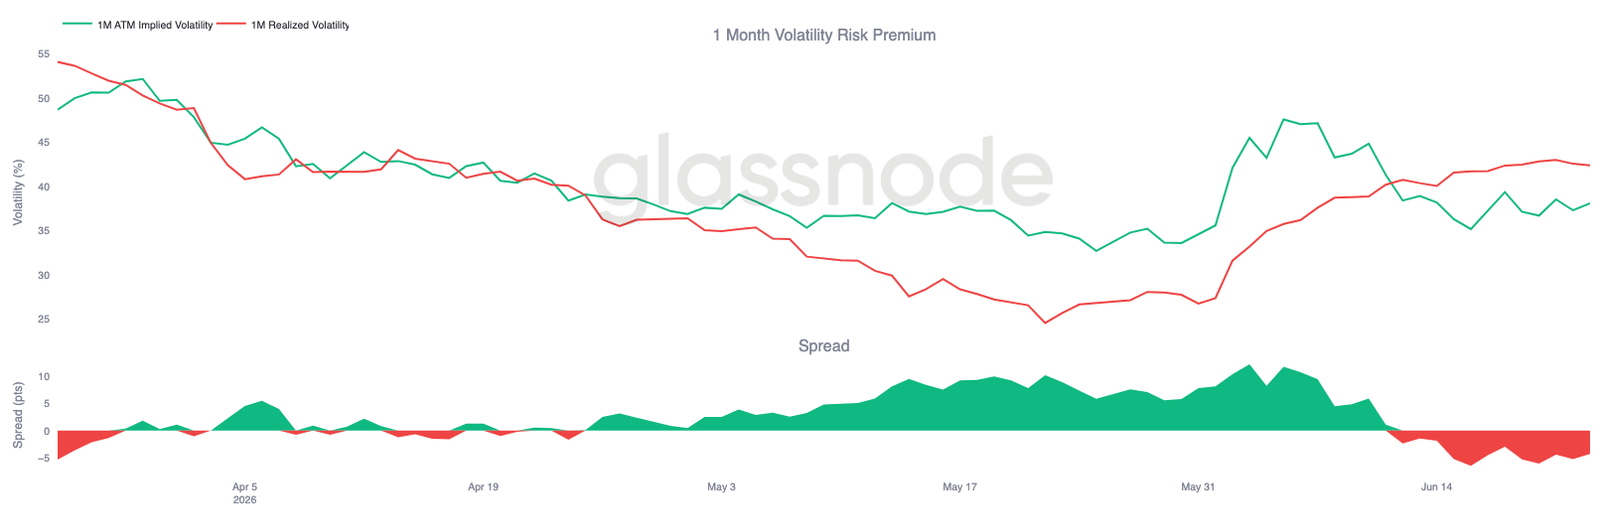
- Implied volatility stabilizes near recent lows, while realized volatility remains elevated, keeping the Volatility Risk Premium negative.
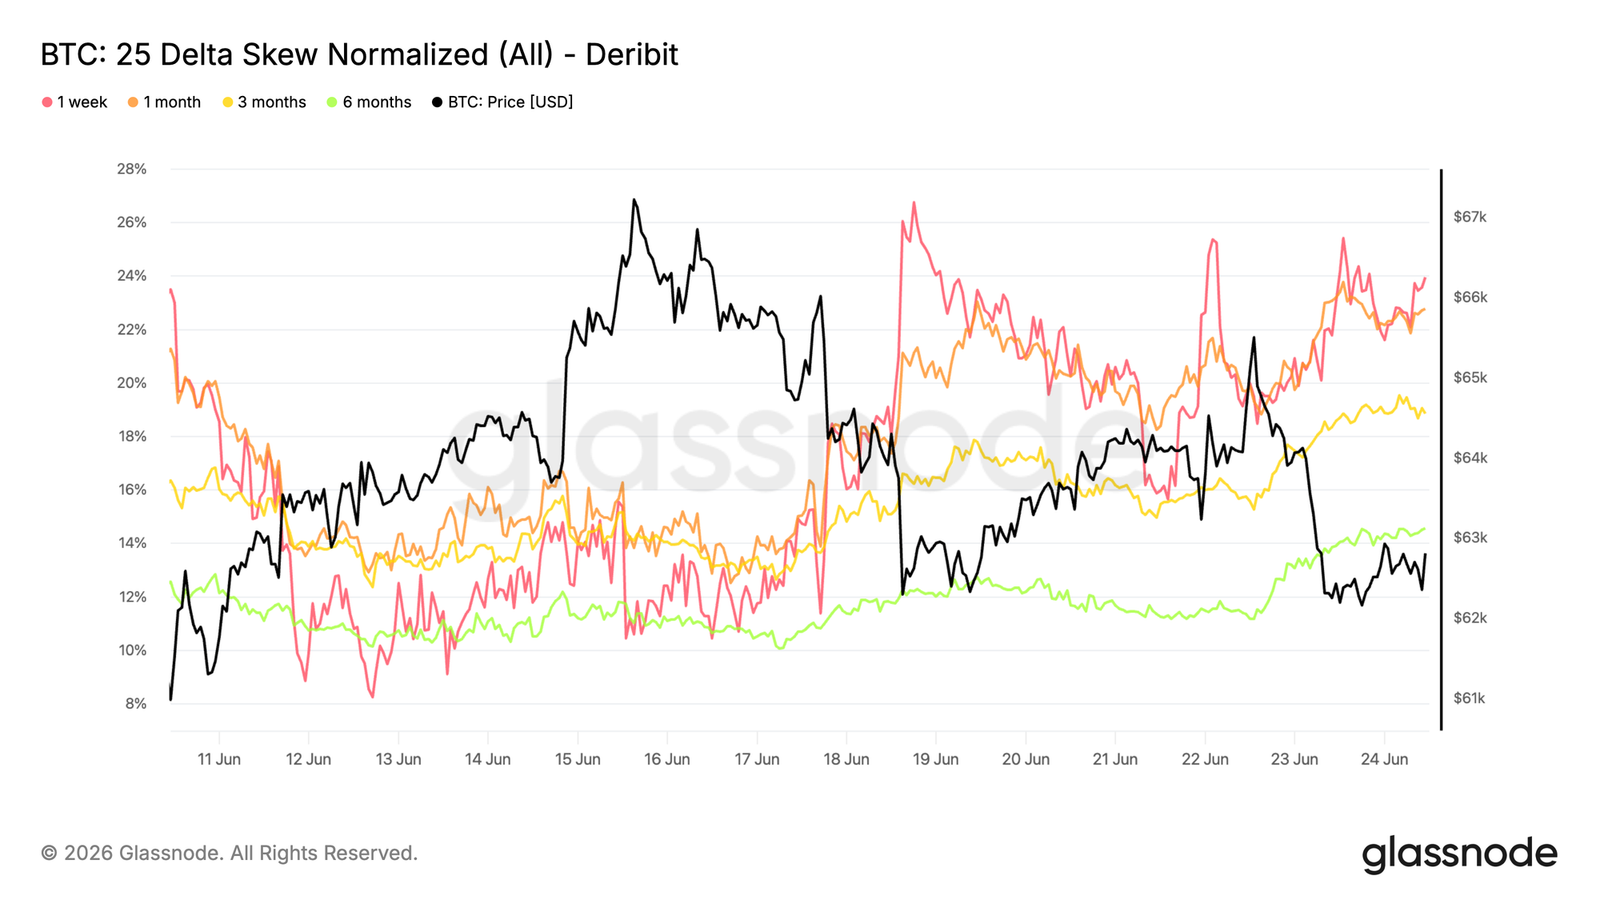
- Demand for downside protection is rebuilding across all tenors, with skew rising sharply, although overall volatility pricing remains relatively restrained.
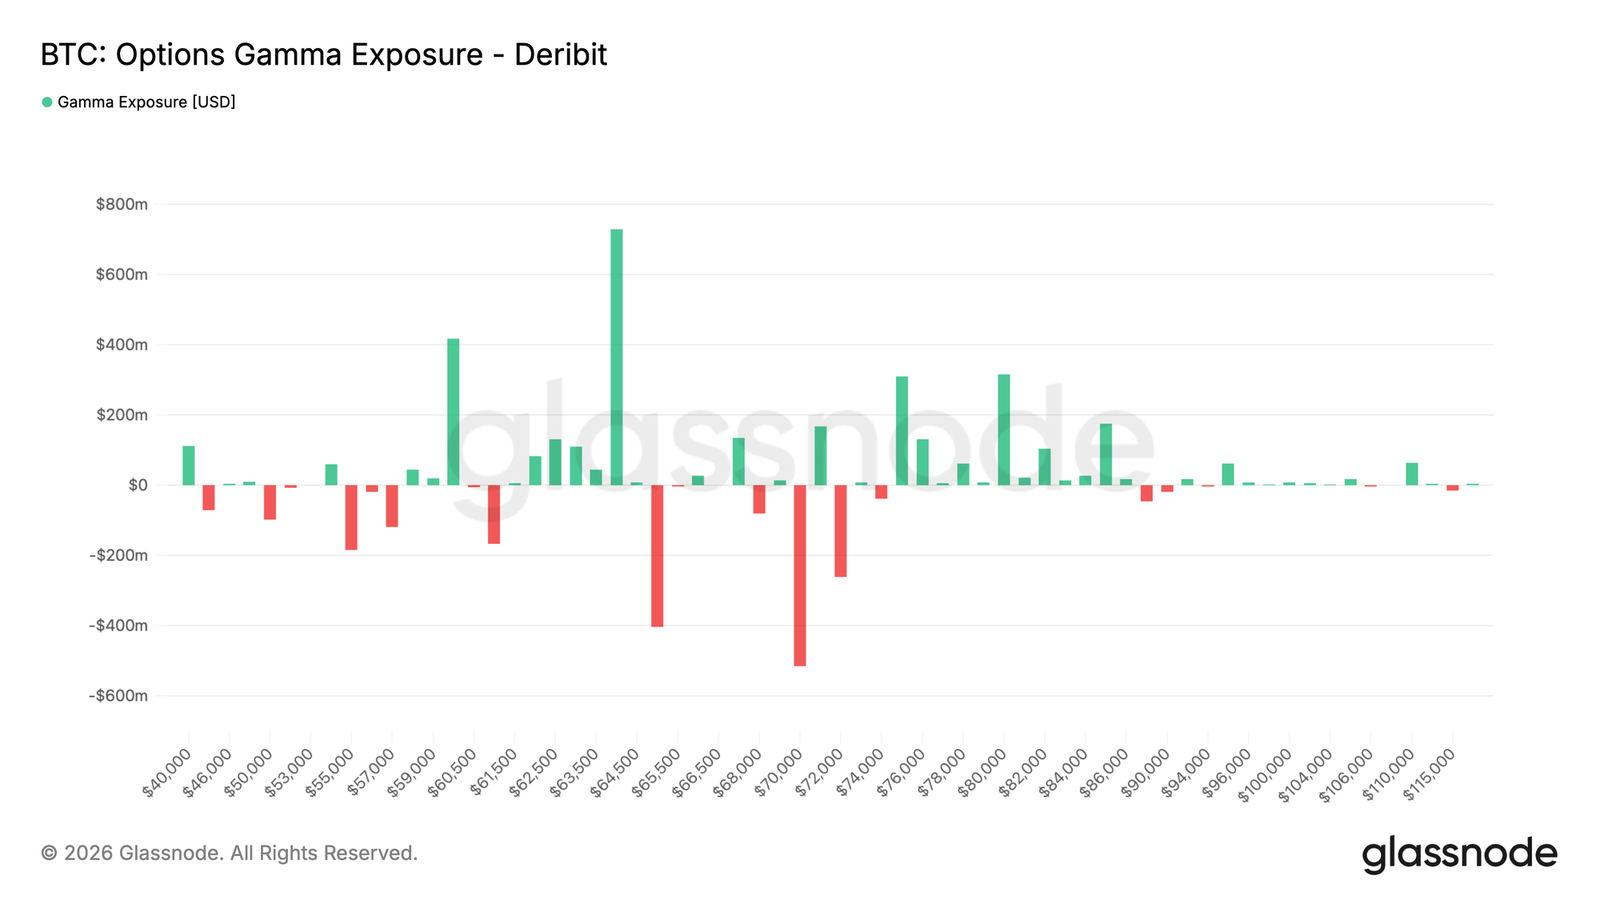
- Recent flow has shifted towards selling premium, while market maker positioning is dominated by long gamma in the 60K-64K range, helping to pin volatility around the current spot price.
Macro Insights
The US Dollar Index (DXY) has reclaimed its 200-day moving average. On June 23rd, the DXY closed at 101.37, a significant rebound from 99.24 thirty days prior, and has held above the 200-day MA of 98.72 for the first time since the "Liberation Day" shock in April. The bullish sequence did not materialize.
The 10-year US Treasury yield remains elevated around 4.50%, showing no signs of decline. The VIX rose from 16.2 mid-week to close at 19.49 on Friday – not panic levels, but the directional change warrants attention. Equities have absorbed the spring correction; the S&P 500 is at 7,365, up 14% from its April low and firmly above its own 200-day MA of 7,007.
Bitcoin has not participated in this recovery. BTC currently sits at $62,651, 18% below its 200-day MA of $76,466. The macro recovery remains an equity story, underpinned by the resilience of US corporate earnings. For Bitcoin, the renewed strength in the DXY is the dominant signal, and it is not bullish for BTC.
On-Chain Insights
Deep Discount Zone
Bitcoin's current price of $62,300 is significantly below the True Market Mean Price of $77,000. The True Market Mean Price represents the average cost basis of active non-miner investors and is a key threshold for distinguishing bull and bear markets. The current 19% discount confirms that prices remain deep in structural bear market territory.
Notably, the cost basis of short-term holders has dropped to $71,400, reflecting significant accumulation by new buyers below the True Market Mean Price. From a cyclical perspective, this is a constructive development, marking a key step in bottom formation – new capital is being deployed at prices increasingly disconnected from the overheated levels of the recent cycle.
Supply accumulated during this bear phase, having a relatively smaller unrealized loss compared to the broader cycle's hanging supply, is expected to show greater resilience to further drawdowns. If a macro-driven decline occurs in the coming weeks, the Realized Price of $53,400 is likely to serve as the reasonable lower bound for the short-to-medium-term bear range.
Gravity Pulling Towards the Lower Range
Having established the $53,400-$77,000 bear range, the next question is which end the price is more likely to gravitate towards. The Net Realized Profit/Loss indicator measures the net difference between profits and losses crystallized in the market (in USD), effectively capturing whether the dominant spending behavior is profit-taking or capitulation.
The 90-day moving average of this metric is currently -$205 million per day, confirming that loss realization has become the dominant force in the broader trend, suggesting the market's center of gravity remains tilted towards the lower end of the current range (closer to the Realized Price).
As a slow-moving average, this reading reflects a deeply embedded loss-dominant environment, not a single stress event. A recovery of this metric to neutral levels (near zero) would be a strong signal that seller exhaustion is forming, and that pre-bull market transitional conditions are beginning to emerge.
Overhead Supply Caps Short-Term Moves
Beyond the broader negative capital flow environment, the current localized concentration of short-term holder supply above the spot price is further weighing on price. The most significant cluster lies in the $66,800-$70,700 range, representing recently accumulated tokens now in a loss position, which are likely to generate selling pressure on any attempted bounce.
This zone effectively defines the most probable ceiling for short-term consolidation or relief rallies, as holders within this range, when the price approaches their purchase cost, tend to behave in a way that leans towards exiting near breakeven. A sustained reclaim of the $66,800 level would significantly alleviate overhead pressure and increase the probability of an extension towards the short-term holder cost basis of $71,400. Until then, this localized hanging supply remains an active anchor suppressing upside momentum.
Off-Chain Insights
ETF Outflows Persist
Institutional demand continued to face headwinds this week, with the 7-day average net outflow from US spot ETFs nearing -$300 million per day, marking one of the most sustained periods of capital withdrawal since the ETF launch. The magnitude and duration of the outflows suggest that traditional investors remain defensive, even with Bitcoin trading near the lower end of the recent range (~$60,000-$65,000).
Notably, previous pullbacks often attracted ETF buying, providing a crucial source of demand during weakness. The persistent redemptions this time indicate that many investors are choosing to reduce exposure rather than accumulate during the dip.
Despite the overall negative ETF flow, the distribution of redemptions is not uniform. Grayscale's GBTC continues to account for the largest share of redemptions, with outflows exceeding 16,000 BTC over the past 90 days. This suggests that the weakness is primarily driven by liquidations and portfolio rebalancing from legacy holders, rather than a unified retreat across the entire ETF sector.
Spot Buyers Beginning to Return
Spot market positioning is starting to improve after a prolonged period of aggressive selling pressure. While the overall spot CVD bias remains negative, the recent rebound shows that the intensity of net selling is easing, helping Bitcoin stabilize at the lower end of the trading range.
The most significant development is the divergence between exchanges. Coinbase's spot CVD bias has rebounded sharply and returned to positive territory, indicating that buying activity is returning to the platform typically associated with US institutional participants. Meanwhile, Binance remains in negative territory, suggesting that overseas traders continue to maintain a defensive posture.
This behavioral divergence points towards an increasingly uneven market structure. Institutional investors appear to be absorbing supply during weakness, while speculative participants remain cautious. Although the broader spot market has not yet returned to sustained accumulation, the improvement in Coinbase demand suggests that some investors have begun to view current prices as attractive entry levels.

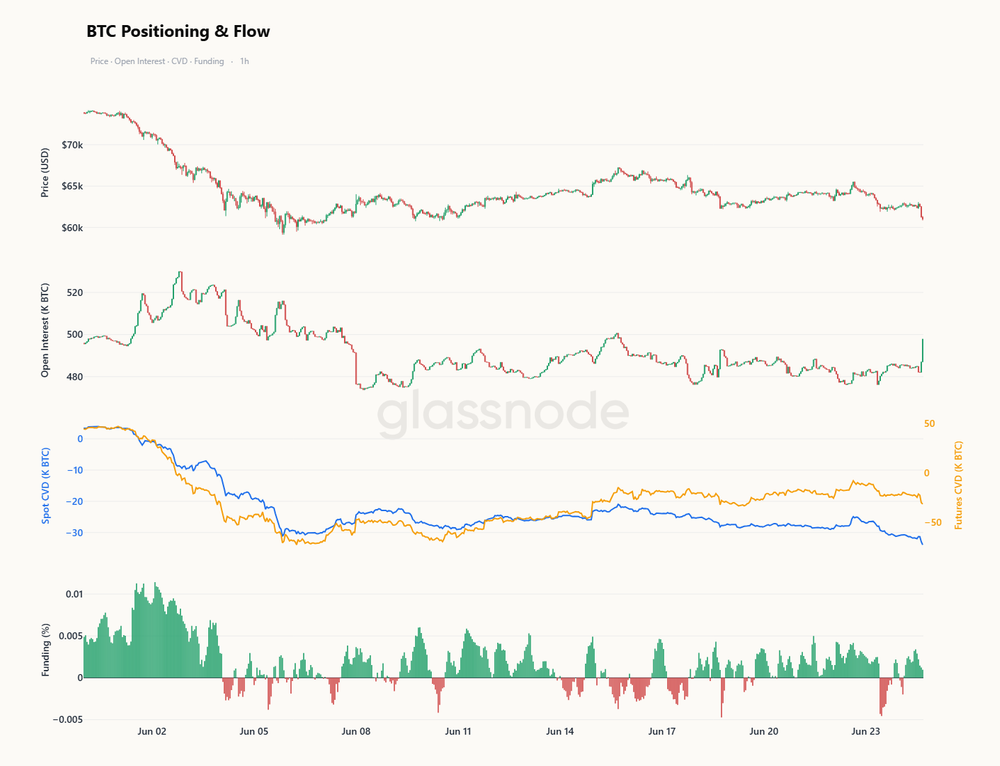
Futures Following Spot Lower
On shorter timeframes, the retest of the low $60,000s was a spot-led move. Over the past ten days, spot CVD declined much faster than futures CVD. This divergence suggests that aggressive selling pressure originated from spot venues, rather than leverage-driven liquidations. Open interest remained mostly subdued during this decline, and funding rates stubbornly stayed positive even as the price fell, indicating that perpetual longs were reluctant to capitulate, and the pressure was not stemming from derivative books.
This situation has begun to change. As Bitcoin retested the lows, open interest surged significantly, and futures CVD has now turned negative in tandem with spot CVD, indicating that leveraged participants are finally joining the move rather than fighting it. At the same time, funding rates have retreated from elevated levels, alleviating the bullish bias that was increasingly out of sync with price action.
Spot has shouldered the heavy lifting during the decline; derivatives are now following rather than leading. If open interest continues to increase while futures CVD declines and funding rates soften, it will confirm that leverage is capitulating towards the same lows that spot has already sold into – this broad participation often marks a more violent, and often more definitive, washout phase.
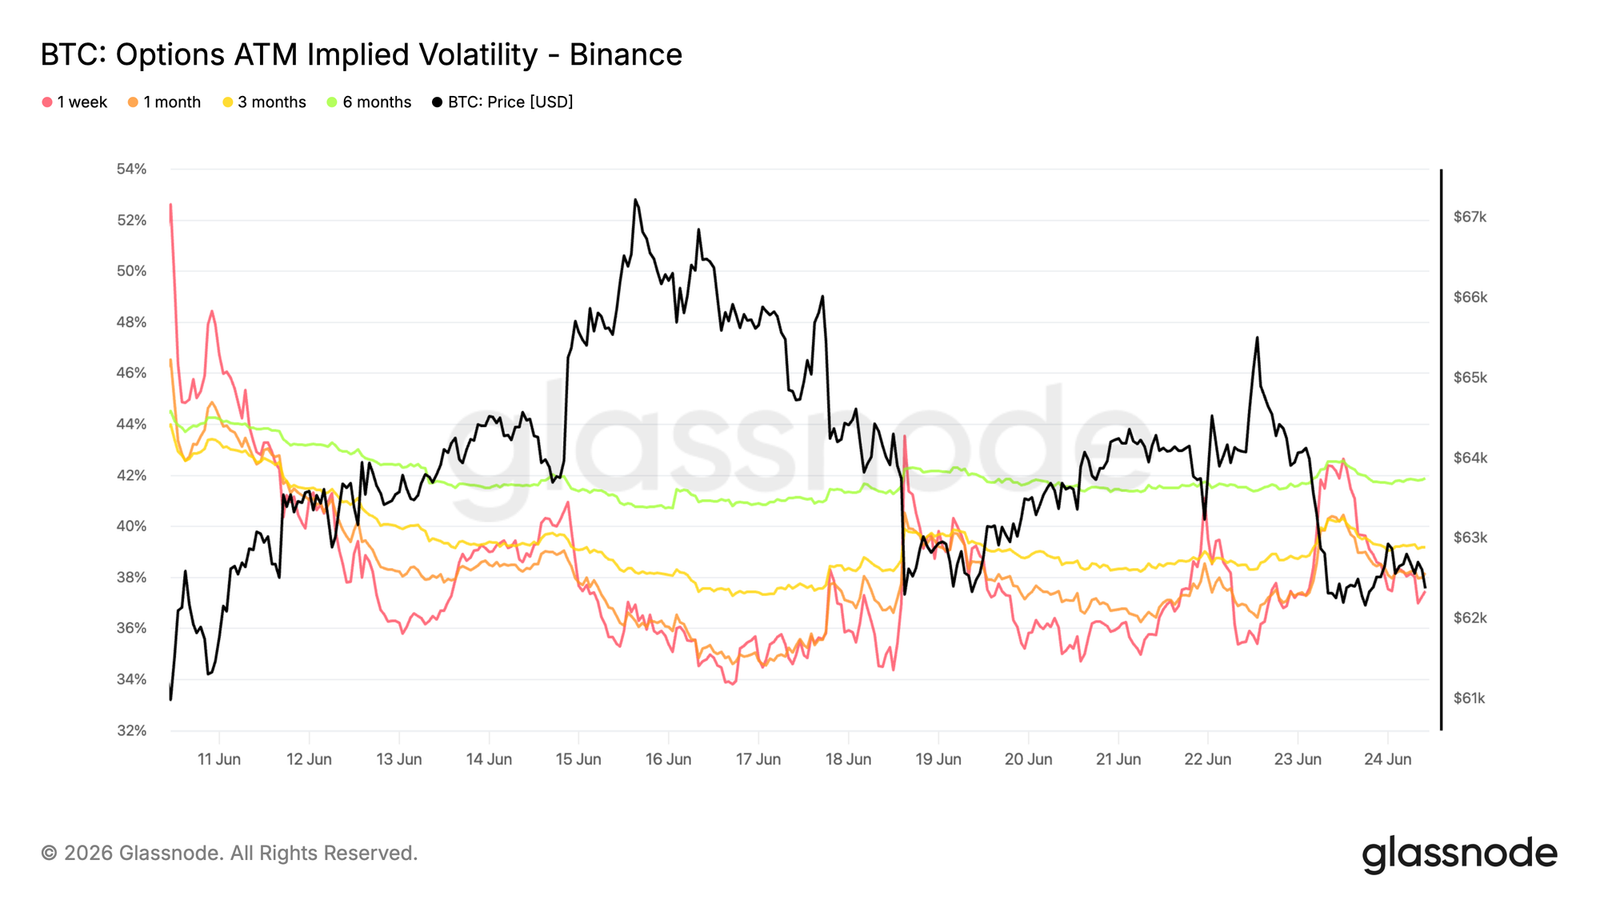
Implied Volatility Stabilizes After Recent Repricing
The options market has entered a calmer zone following the sharp repricing triggered by Bitcoin's decline to the June lows.
The front end of the curve remains the most sensitive. One-week ATM implied volatility briefly exceeded 42% during the latest sell-off before settling back near 37%. The one-month tenor declined from around 40% to 38%, while longer tenors remained relatively stable, with three-month and six-month implied volatility near 39% and 42%, respectively.
This stabilization has occurred even as Bitcoin continues to trade near major support around 60K-63K. The lack of sustained volatility buying suggests that traders are no longer aggressively repricing risk, and much of the protection premium from the recent stress period has been removed.
With implied volatility returning to a stable range, the options market appears less urgent in pricing additional short-term uncertainty.
Volatility Risk Premium Remains Negative
With implied volatility stabilizing, the relationship between implied and realized volatility remains inverted, keeping the Volatility Risk Premium (VRP) negative.
One-month implied volatility is currently around 38%, while realized volatility continues to climb to around 42%. Consequently, the VRP remains negative by approximately 4 volatility points, extending the inversion that began with the recent market sell-off.
The chart shows that even as implied volatility normalizes from its early-June peak, realized volatility has stayed elevated. In other words, the market is experiencing more actual volatility than options are currently pricing. Although the gap has narrowed slightly from its recent extremes, implied volatility has not yet rebuilt enough premium to push the spread back into positive territory.
Since realized volatility remains above implied volatility, the options market continues to price in a relatively calmer environment than what recent price action has delivered.
25 Delta Skew Rebuilding Across Tenors
Following the negative Volatility Risk Premium, the skew metric reveals how demand for downside protection is evolving as Bitcoin trades near major support.
Skew is calculated as put volatility minus call volatility; a positive value indicates that puts are trading at a premium relative to equivalent calls. Over the past week, this premium has risen across the entire curve. One-week skew increased from around 12% to 24%, and the one-month tenor rose from roughly 14% to 23%. Three-month and six-month tenors also moved higher, reaching approximately 19% and 14%, respectively.
The chart shows that despite relatively stable implied volatility levels, a broad repricing of downside protection has occurred. Traders do not appear to be paying more for volatility overall, but they are increasingly willing to pay a premium for downside hedges.
The rebuilding of protection demand across all tenors suggests that while volatility levels are stable, traders have a renewed preference for downside hedging.
Gamma Exposure Concentrated Near Current Spot
Beyond pricing and sentiment, gamma exposure helps identify the strike levels where market maker hedging is likely to have the most significant impact on market dynamics.
Recent flow shows traders becoming more comfortable selling premium. Over the past seven days, put selling accounted for the largest share of traded premium, at 31.2%. This trend has intensified over the past 24 hours, with put selling comprising 47.2%.
This shift is reflected in the gamma profile. The two largest positive gamma clusters sit at 60K and 64K, with Bitcoin currently trading between them, around 62.8K. In a long gamma zone, market maker hedging tends to suppress volatility, helping to pin spot within the range. In contrast, the nearest negative gamma exposure is at 65K, and its magnitude is significantly smaller than the positive gamma cluster at 64K.
Market maker positioning remains dominated by long gamma near current levels, creating conditions that are likely to contain volatility within the 60K-64K range.
Conclusion
Bitcoin continues to trade in a market defined by caution rather than conviction. On-chain metrics show the asset is at a deep discount relative to the average investor's cost basis, while persistent realized losses confirm that the bear market remains firmly entrenched. Concurrently, ETF outflows and defensive positioning in the options market underscore a broad lack of risk appetite among institutional and derivative participants.
However, beneath the surface, there are early signs that the environment is beginning to stabilize. Coinbase spot flow has turned constructive, the short-term holder cost basis is adjusting lower, and the recent weakness has been primarily driven by spot sellers rather than excessive leverage. While these developments do not signal an imminent reversal, they are characteristic of the early stages of a bottoming process.
For now, the market remains in a tug-of-war between sustained distribution and emerging value-driven demand, the outcome of which will define Bitcoin's next major directional move.


