
Data Decoding the BTC Cycle: Three Major Bottom Signals Flash, Q4 Could Be the Key Turning Point Window?
- Core View: Through historical cycles, on-chain data, and capital flow analysis, this article points out that while BTC's price has retraced over 52% from its June 2026 high of $126,000, current valuation indicators (such as MVRV Z-Score nearing the bottom), institutional accumulation, and easing macro risks (US-Iran ceasefire) suggest the market may be in a cyclical bottom zone, not a time for panicked exits.
- Key Elements:
- Historical Retracement Comparison: BTC's current maximum drawdown is approximately 52%, far lower than the bear market declines of 2014 (86%), 2018 (84%), and 2022 (77%), indicating market fear may be exceeding fundamental risks.
- Halving Cycle Pattern: Following the 4th halving (April 2024), a peak occurred approximately 18 months later in October 2025. According to historical patterns, the bottom could be around October 2026, aligning with the 2028 halving window.
- On-chain Undervaluation Signal: The MVRV Z-Score has dropped to around 0.27 (near historical bottoms), the market price is only 9% above the network-wide realized price (approximately $53,600), and it has touched the 200-week moving average (around $62,200) for the first time—all common features of historical macro bottoms.
- Capital Flow Divergence: Retail and ETF capital continue to see net outflows (totaling $4.4 billion from mid-May to early June), but the number of whale addresses hit a new 2026 high. Institutions like Strategy increased their positions, exchange BTC balances declined, and long-term holders control a record-high 78% of supply.
- Macro Risk Relief: The Iran war agreement was reached on June 14. Falling oil prices and fading expectations of Fed rate hikes propelled BTC to gain over 5% in a single day. Previously, high interest rates and geopolitical risks were the core factors suppressing the market.
Original by Odaily Planet Daily (@OdailyChina)
Author: jk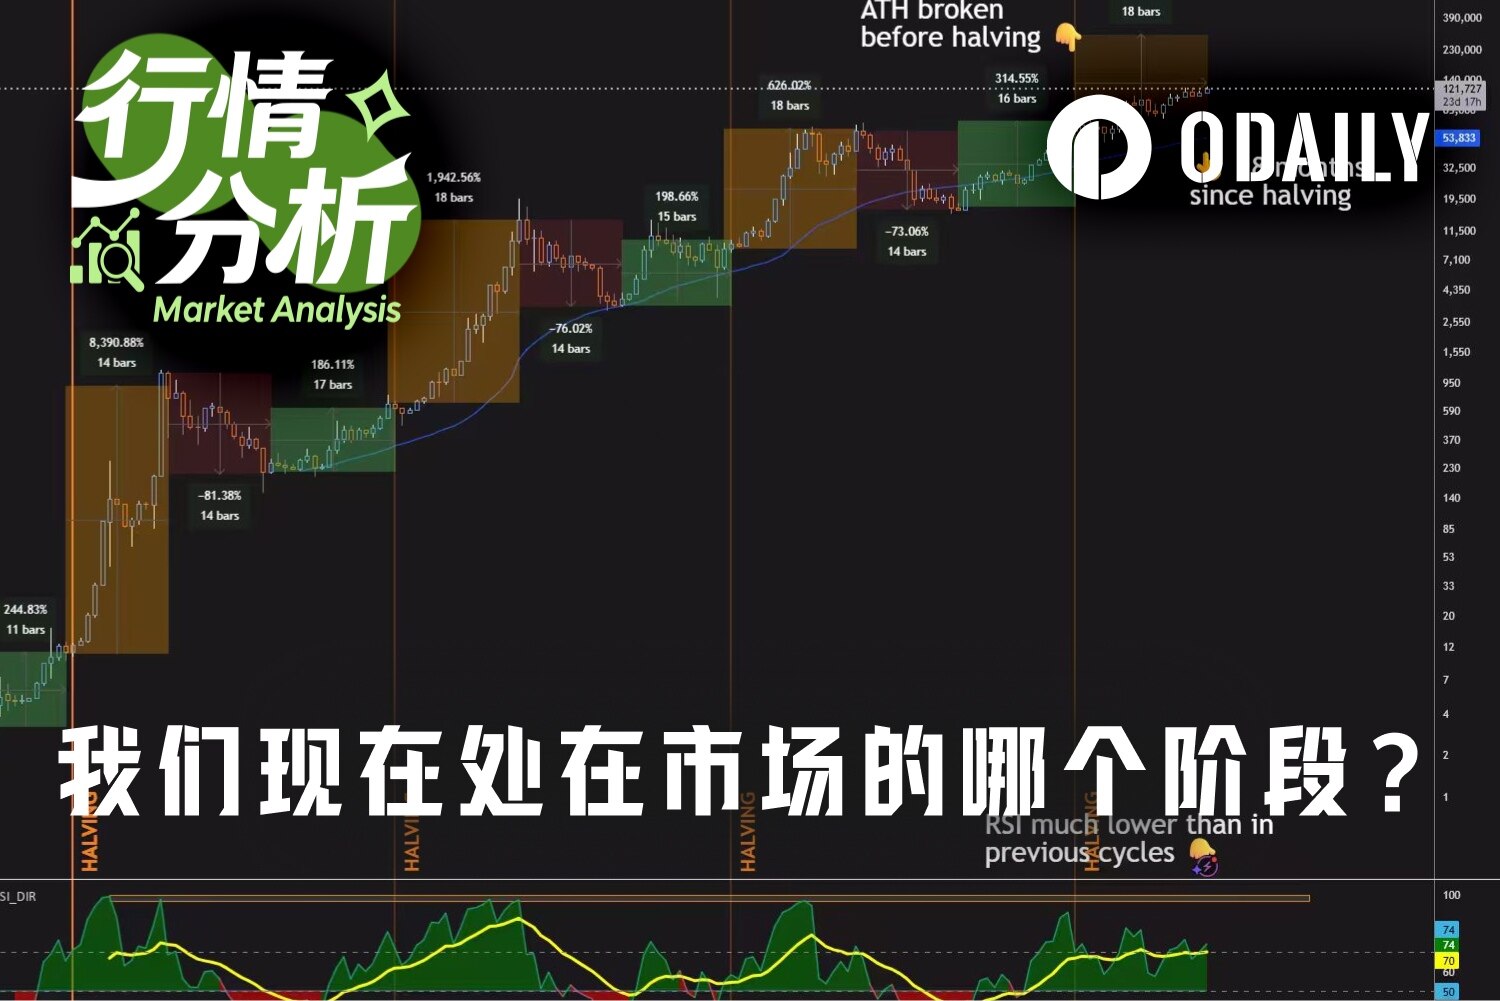
Last October, the night BTC broke through $120,000, countless people screenshot the chart and posted it on social media with the caption "Witnessing history." Just eight months later, the same group stared at the price of $59,100, updating their captions to "Will it drop further?"
From the peak of $126,198 to the low of $59,100, BTC has retraced over 52%. In early June, the crypto market Fear & Greed Index fell to 8, the lowest level since 2022.
Entering now—is it brave bottom-fishing or passive bag-holding?
In 2018, people said BTC would eventually go to zero. In 2022, they said the crypto industry was finished after FTX's collapse. By 2026, the narrative shifted to "the four-year cycle is broken," "institutional entry only leads to dumping," and "risk assets have no出路 in a high-rate era." Every time, these narratives sound most indisputable when prices are at their lowest.
However, narratives are emotional; data is neutral. Only by separating the two can the market's current position become clear. Let's take a look together: where exactly are we in the BTC cycle right now?
Where Does a 52% Decline Stand in Historical Cycles?
On October 6, 2025, BTC hit its all-time high of $126,198. From that day to the intraday low of approximately $59,100 on June 5, 2026, this retracement peaked at over 52%.
A 52% drop sounds alarming, but compared to BTC's past three complete bear markets, this figure is actually on the lower end of the historical median. The 2014 bear market fell 86% from peak to trough, 2018 fell 84%, and 2022 dropped from $69,000 to $15,479, a decline of about 77%. The current cycle's maximum drawdown so far is about 52%, significantly milder than the previous three.
This means historically, deeper declines have all recovered. While this statement might sound somewhat arbitrary, from a market confidence perspective, the fear surrounding the current price likely exceeds the actual risk corresponding to fundamentals.
This is why everyone says market confidence is more precious than gold.
Four Halvings, Three Nearly Identical Curves
Understanding the current position cannot avoid the halving cycle framework.
BTC is halved approximately every four years, reducing miner block rewards and contracting new supply. Around each halving, the past three cycles have followed highly similar bull-bear rhythms: peaking 12 to 18 months after the halving, bottoming 12 to 14 months after the peak, with the bottom typically occurring about 17 months before the next halving.
- Cycle 1: The halving was in November 2012 when BTC was only $12. About 12 months later, in November 2013, the price peaked at $1,150. The subsequent bear market lasted about 13 months, bottoming around $160 in January 2015, which was about 18 months before the next halving (July 2016).
- Cycle 2: The halving was in July 2016 at around $650. About 17 months later, in December 2017, the price peaked at $19,800. The subsequent bear market lasted about 12 months, bottoming around $3,200 in December 2018, about 17 months before the next halving (May 2020).
- Cycle 3: The halving was in May 2020 at around $8,600. About 18 months later, in November 2021, the price peaked at $69,000. The subsequent bear market lasted about 13 months, bottoming around $15,500 during the FTX crash in November 2022, about 17 months before the next halving (April 2024).
- This is Cycle 4. The halving occurred on April 19, 2024, reducing the block reward from 6.25 to 3.125 BTC, with BTC priced around $63,000. About 18 months later, BTC peaked at $126,198 on October 6, 2025, perfectly falling within the historical "12 to 18-month peak" window.
As of June 2026, it's been about 26 months since the 2024 halving and about 8 months since the October 2025 peak. According to historical patterns, bottoming takes 12 to 14 months after the peak, suggesting the bottom window could fall around October 2026, which would be exactly about 17 months before the next halving (April 2028), almost perfectly aligning with the first three cycles.
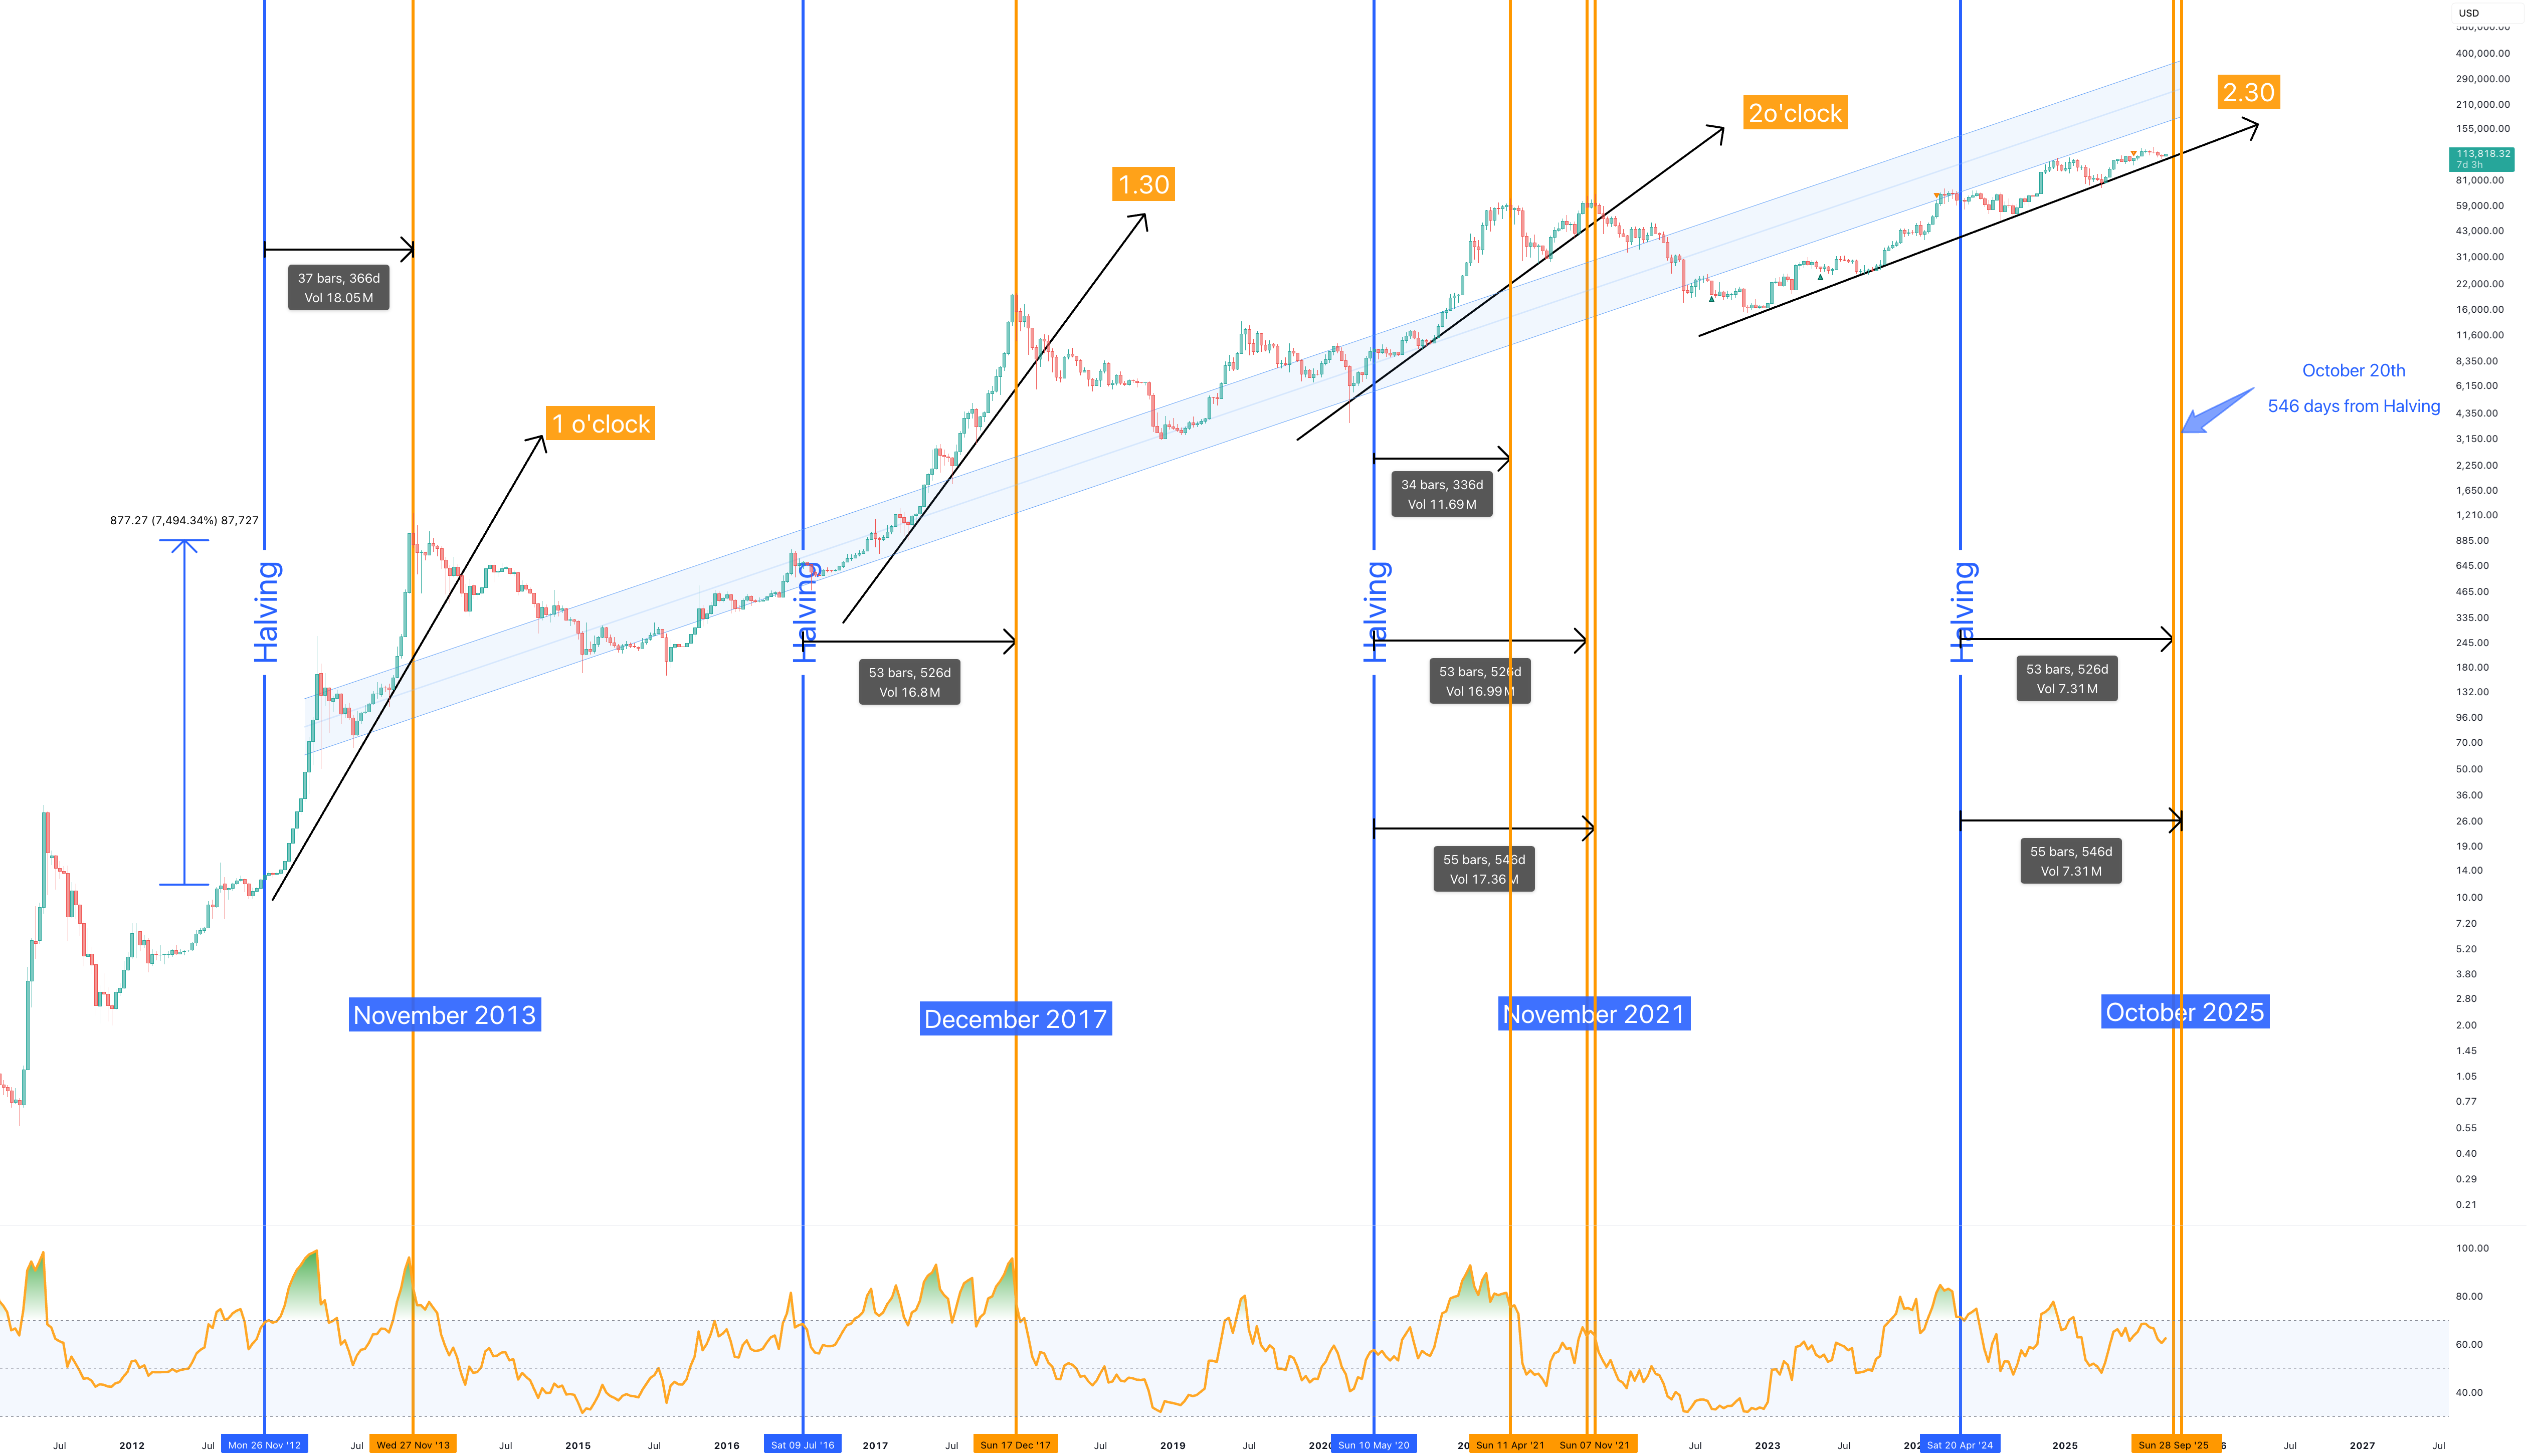
BTC Halving Timeline
From the current vantage point, the second half of 2026 looks more like a period in this cycle where reassessing risk-reward is worthwhile, rather than a time for panicked exits.
Supply contraction post-halving continues, and long-term buying from spot ETFs and institutional capital has changed BTC's market structure, which was once purely driven by retail sentiment. If historical cycles continue to play out, the fourth quarter of 2026 could be a key window for the market to move from pessimism to recovery, from deleveraging to re-accumulation. For investors bullish on BTC's long-term value, short-term pullbacks might actually offer more attractive opportunities for phased accumulation. As the bottom range gradually approaches, market confidence is likely to reconverge, and the foundation for the next upward cycle may be quietly forming during this phase.
On-Chain Data: Three Low Signals Flashing Simultaneously
Beyond price charts, on-chain data provides a more fundamental valuation reference.
- Indicator 1: MVRV Z-Score. This measures the deviation between the current market price and the average cost basis of all network holders. Historically, a Z-Score above 7 indicates severe overvaluation near a top; dropping to near 0 or below corresponds to a deep undervalued zone. When BTC peaked in October 2025, the Z-Score was around 5 to 6. According to MacroMicro data from June 9, the current Z-Score is approximately 0.27, approaching the boundary of historical bottom zones.
- Indicator 2: Network Realized Price, the weighted average cost basis of all circulating BTC based on their last on-chain move. CryptoQuant Research Head Julio Moreno noted on June 10 that this value is currently around $53,600. Based on the current market price of $62,000, the market price is only about 9% above the network cost basis, an extremely rare low premium historically. In the past three cycles, major bottoms formed near or slightly below the Realized Price, briefly breaking below in November 2022.
- Indicator 3: 200-Week Moving Average (WMA). This line represents the average price over the past nearly four years, currently around $62,200. On June 4, 2026, BTC touched this line for the first time in this cycle. The three bear market bottoms of 2015, 2018, and 2020 all occurred precisely near this line. 2022 was the only exception, where the price broke below and stayed under the line for about 16 months, ending with the FTX crash.
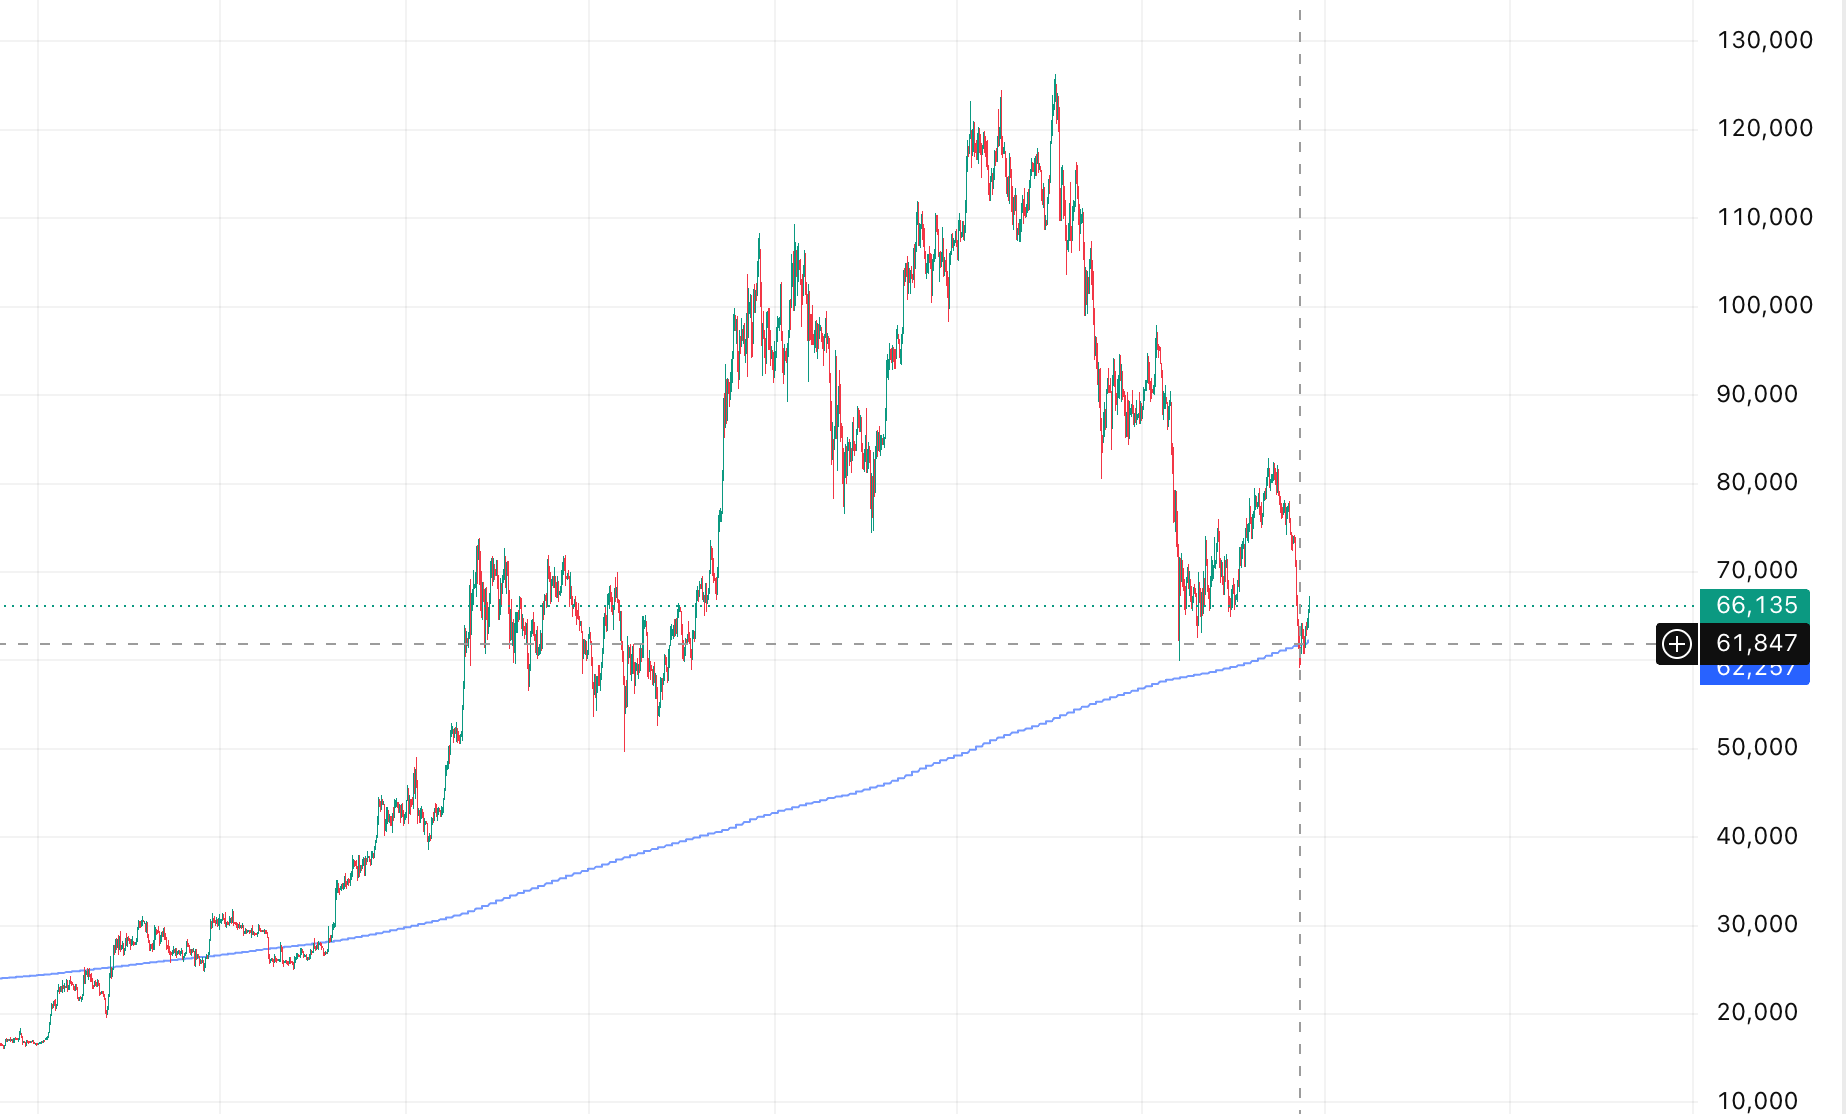
200-Week Moving Average Price. Source: TradingView
Capital Flow: Retail Exit, Whales Enter
Beyond the low signals at the valuation level, the structure of capital flows also shows some bottoming characteristics.
On the ETF front, from mid-May to early June, U.S. spot Bitcoin ETFs saw net outflows for 13 consecutive trading days, totaling approximately $4.4 billion, or about 59,400 BTC. This is the longest continuous outflow period since the ETFs launched. BlackRock's IBIT saw a weekly outflow of about $980 million, a record low. This reflects panicked redemptions from short-term capital and retail investors.
Simultaneously, a counter-directional move occurred on-chain. The number of whale addresses holding 100+ BTC hit a new high in 2026, reaching approximately 20,229. In the first five months of 2026, net whale buying volume already matched the total for the entire year of 2025. Strategy (formerly MicroStrategy) sold 32 BTC in late May to pay preferred stock dividends—its first sale in four years—sparking concerns about a strategic shift. However, two weeks later, on June 8, the company bought 1,550 BTC at an average price of $65,332, bringing its total holdings to 845,256. Michael Saylor described this as "a good time to add exposure."
On exchanges, BTC balances have been steadily declining over the past few months, with coins moving from exchange wallets to long-term holders and institutional cold storage. Currently, long-term holders (holding for over 155 days) control about 78% of the circulating supply, one of the highest proportions in history.
Macro: The Biggest Uncertainty, Just Half Removed
The core macro logic suppressing BTC over the past few months primarily stems from two lines: high interest rates and the Iran conflict.
In early 2026, the US and Israel launched military strikes against Iran, leading to a partial blockade of the Strait of Hormuz. The IEA characterized this as the largest supply disruption in global oil market history, sending international oil prices surging to $105-$120 per barrel. Inflation rebounded as a result, with the US CPI hitting 4.2% in May, far exceeding the 2% policy target. The federal funds rate was held steady in the 3.50%-3.75% range, and the market priced in about a 79% probability of "zero rate cuts" in 2026. The US Dollar Index strengthened to around 99-100. The dual pressure of high rates and risk aversion meant that despite global liquidity expanding, it struggled to flow into the crypto market.
However, on the night of June 14, U.S. President Trump announced the completion of a US-Iran agreement. Iran's Supreme National Security Council then issued a statement in the early hours of June 15, formally confirming a ceasefire memorandum of understanding. The official signing ceremony is scheduled for June 19 in Switzerland, and the Strait of Hormuz is set to reopen.
The market reaction was immediate and sharp. WTI crude oil fell over 4% on the day to around $80.25/barrel, while Brent crude dropped to about $83.51. BTC jumped from around $61,500 before the announcement to above $65,000, a single-day gain of over 5%—the largest single-day rebound in the past three months—accompanied by increased volume. Futures for the three major U.S. stock indices rose over 300 points, and Asian markets also rallied.
Following the agreement, Deutsche Bank stated that it expects the risk of a Fed rate hike to recede in the short term, but due to persistent inflation, labor market resilience, and the possibility that the neutral rate is higher than expected, a rate hike in 2027 still remains a possibility. The Fed's path will specifically depend on the debut of its new chairperson, Kevin Warsh.
Conclusion: It's a Bottom, and Also When Confidence is Lowest
When BTC was above $120,000, everyone was willing to believe it would go higher. But when it falls back to around $60,000, and on-chain valuations, cycle positioning, long-term holder ratios, and macro variables all start pointing towards a bottom zone, that's precisely when the market lacks the most confidence.
Yet, investing is never accomplished when emotions are most comfortable. Historically, every BTC major bottom has been accompanied by questions of "this time is different," and also by widespread doubt about the industry, the cycle, and the asset itself. The only difference is that some see this doubt as a reason to exit, while others see it as an opportunity to reprice risk-reward.
Current BTC levels certainly don't mean it can't fall further, nor does it guarantee this is the absolute bottom. However, when looking through a longer lens, separating short-term panic from the long-term structure, this zone is no longer suitable to define as "chasing highs." Instead, it more closely resembles a window for phased accumulation requiring patience, discipline, and conviction.
Market confidence is more precious than gold. Because gold can only hedge against inflation, whereas confidence can navigate through cycles. For those who still believe in BTC's long-term value, in scarcity, and that global liquidity will eventually return to risk assets, the most important question for the second half of 2026 might not be "will it fall further," but rather, "when the market starts to believe again, will you already be there?"
What will you choose?


