
How far is the current US stock bull market from the historical peak of past bubbles?
- Core View: Goldman Sachs' latest assessment shows that the current level of euphoria in the US stock market has risen to the 86th historical percentile, approaching but not yet reaching the peaks of the 2000 internet bubble and the 2021 bull market. The bull run still has room, but risks are accumulating.
- Key Elements:
- The S&P 500 index has surged 15% in the past two months, with its return/volatility ratio nearing 4, marking its strongest rebound in over 50 years.
- This rally is primarily supported by a significant upward revision of recent earnings expectations, rather than emotional speculation. The fundamentals are relatively solid.
- Goldman Sachs' comprehensive assessment framework indicates market euphoria is at the 86th percentile, lower than in 2000 (100th percentile) and 2021 (95th percentile).
- Speculative trading, bullish options volume, and retail margin balances are all on an upward trend but have not yet reached historical peak levels.
- The four major risk signals (speculative frenzy, deteriorating growth, stock issuance, Fed tightening) have not been fully triggered, but each is closer to its threshold than it was several months ago.
- Reviving IPO activity, pressured corporate profit margins, and an increased probability of rate hikes reflected in the interest rate market are potential risk points.
Original author: Zhao Ying
Original source: Wall Street CN
A recent assessment by Goldman Sachs' chief US equity strategist shows that current market euphoria has risen to the 86th percentile historically, approaching but not yet reaching the extreme levels seen at the peak of the 2000 dot-com bubble and the 2021 bull market top.
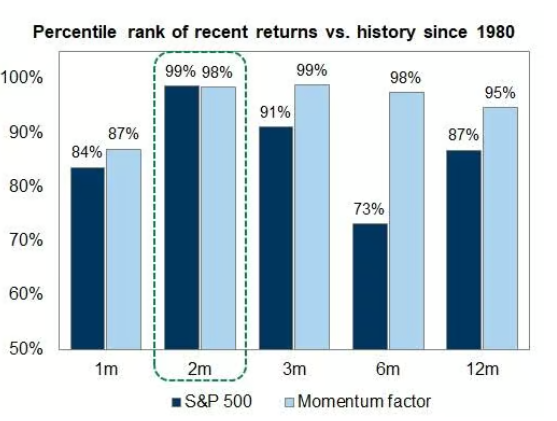
In the past two months, the S&P 500 Index surged 15% before Friday's pullback, placing this rally in the 99th percentile among historical data since 1980. In his latest report, Goldman Sachs Chief US Equity Strategist Ben Snider pointed out that although none of the four major historical bull market peak signals—speculative frenzy, deteriorating growth, massive equity issuance, and Fed tightening—are fully triggered yet, each one is closer to its threshold than it was a few months ago.
For the market, this assessment implies the current bull run still has room to run, but risks are building. Snider explicitly stated "we're not there yet," while warning that the market does not need to reach extreme investor euphoria to decline, and history does not necessarily have to repeat itself in this cycle.
The Rally's Ferocity: Strongest Volatility-Adjusted Rebound in 50 Years
The speed of this rebound has already left its mark on history. According to Goldman Sachs data, the S&P 500 rose 15% in about two months, with a return/volatility ratio relative to realized volatility approaching 4, the highest level in over 50 years.
Artificial intelligence is the core theme driving this market rally. AI concept stocks, momentum factors, and the broader market index have all risen in tandem, creating a high degree of resonance.
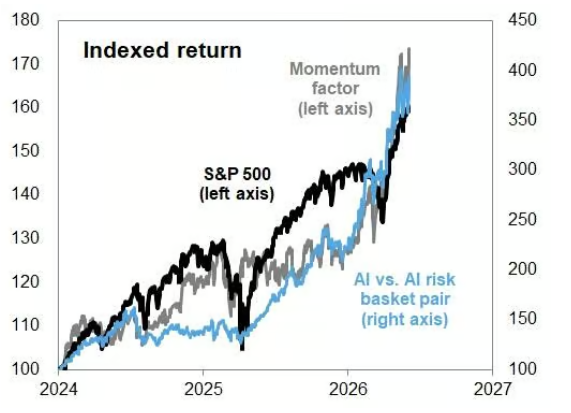
Snider noted that unlike previous similar momentum-driven rallies (such as late 1999 and late 2021), this uptrend has been primarily supported by significant upward revisions in near-term earnings expectations rather than pure sentiment bubbles, giving this rally a more solid fundamental foundation to a certain extent.
Euphoria Indicator: 86th Percentile, Below Two Historical Peaks
To quantify current market sentiment, Snider constructed a comprehensive assessment framework covering four categories with a total of nine indicators. Historical data shows that at the peak of the 2000 dot-com bubble, the median ranking of these indicators reached the 100th percentile; at the 2021 bull market peak, it was at the 95th percentile. The current reading stands at the 86th percentile—above the historical average but still clearly lagging behind the two previous extreme peaks.
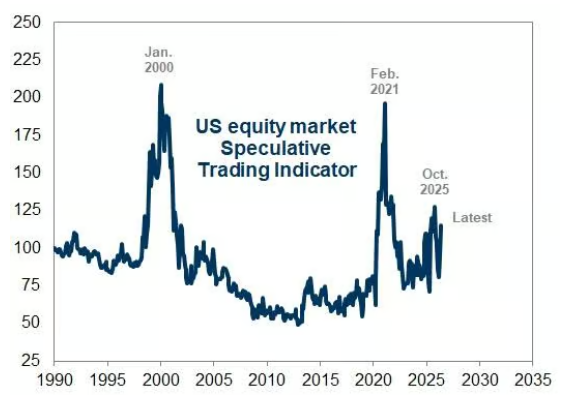
Specifically, Goldman Sachs' speculative trading indicators have risen recently but remain below late 2021 levels and far below the peaks of 2000 and 2021. Among various speculative trading activities, trading volumes in high-valuation stocks have notably expanded recently, while trading activity in loss-making stocks has been relatively modest. Additionally, both bullish option trading volume and retail margin balances are trending upward, indicating investor sentiment is heating up.
Notably, the market breadth of this rally is extremely narrow, but has not yet reached the extreme concentration levels seen during the dot-com bubble.
Four Risk Signals: Not Yet Triggered, But Distance is Closing
Goldman Sachs' analytical framework attributes the end of historically high-valuation, high-concentration bull markets to four factors: speculative frenzy, deteriorating growth prospects, an extreme surge in equity issuance, and Fed policy tightening. Snider pointed out that while none of these four conditions fully matches the current environment, each one is closer to the warning line than at the start of the year.
IPO activity is warming up, placing pressure on the equity issuance side; rising input costs are compressing corporate profit margins, posing a potential threat to growth prospects; interest rate market pricing has begun to reflect a higher probability of Fed rate hikes, although Goldman Sachs economists believe actual rate hikes are unlikely.
Snider also emphasized that market declines do not require extreme investor euphoria as a prerequisite, and the euphoric characteristics seen at past bull market peaks may not necessarily reappear in the same form this cycle. This means that even if current indicators have not yet reached historical extremes, investors should not view them as a sufficient guarantee of safety margin.
In summary, Goldman Sachs' assessment offers a cautious but not pessimistic conclusion: the euphoria level of the current bull market is "getting increasingly closer" to the historical peak zone, but has not yet arrived. The key support for this judgment is that the current rally still has improved earnings expectations as fundamental backing, rather than being purely sentiment-driven. However, as momentum factors remain strong, market concentration remains high, and some risk signals quietly escalate, Snider's report essentially serves as a reminder to investors: the window is still open, but it is slowly narrowing.


