
Bitcoin's Weak Bounce Fails to Mask Correction Trend, HYPE Top Signal Warrants Caution Against Short-Term Risks | Special Analysis
- Core Thesis: Bitcoin's technical structure has weakened this week, with limited short-term rebound potential. The key focus is whether resistance at $75,000–$76,000 can be broken. HYPE's seven-wave rally may have topped out; monitor the effectiveness of support at $62.5–$64.57.
- Key Factors:
- Bitcoin's daily chart has broken below the mid-line of its ascending channel, indicating an overall structural weakening. The current move is a weak rebound within a short-term descending channel, targeting the channel's upper trendline (approximately $75,000–$76,000).
- The hourly (4-hour) timeframe shows a 10-wave corrective structure containing two descending consolidation zones. If the rebound faces selling pressure around $75,000–$76,000, it is highly likely to continue declining and test support at $69,500–$70,500.
- Strategy for this week: For medium-term positions, consider initiating short orders after the rebound encounters resistance in the $75,000–$76,000 zone, with initial position sizing below 30%. For short-term trades, a 30% position can be used for range-bound trading (buying low and selling high) within the designated area.
- HYPE has formed a seven-wave upward structure (including an ascending consolidation zone) on the 4-hour chart. The momentum of the 46–47 segment is waning. This has already triggered the top warning signal from the spread trading model, suggesting a high probability of "momentum divergence".
- If HYPE's price effectively breaks below the $62.5–$64.57 support zone, it would confirm a short-term top signal. The correction could then escalate to the daily timeframe level, with a downside target of $54–$56.3.
- Last week's verification: A short-term Bitcoin short trade was successfully executed. Based on model signals, a position was opened at $77,449 and closed at $73,519, realizing a profit of 5.07%.
Core This Week: Bitcoin's daily structure has weakened. Can a short-term rebound effectively break through the upper trendline of the descending channel? Has HYPE's seven-wave rally reached its end? Starting from a multi-timeframe structural analysis, this report systematically reviews the current market formation and formulates mid-term and short-term trading strategies for the week.
Summary of Core Trading Views for This Week:
• Analysis of BTC's multi-timeframe structural formation. (Detailed in Part 1)
• BTC price forecast for this week and mid/short-term trading strategies. (Detailed in Part 2)
• Analysis of HYPE's hourly-level structural formation. (Detailed in Part 3)
• HYPE price forecast for this week and short-term trading strategies. (Detailed in Part 4)
Market Validation of Last Week's Trading Strategy and Core Views:
• BTC Short-term Trade Outcome: Executed one short-term short trade last week (1x leverage), successfully generating a profit of approximately 5.07%. (Detailed in Table 1)
• Market Validation of BTC Price Forecast: Last week's article pointed out that Bitcoin continues its consolidation pattern of oscillating downward, with the short-term strategy favoring 'shorting on bounces.' Current market action has validated our previous assessment.
1. Analysis of Bitcoin's Multi-Timeframe Structural Formation
1.1 BTC Daily-Level Structural Formation Analysis
Bitcoin - Daily K-line Chart:
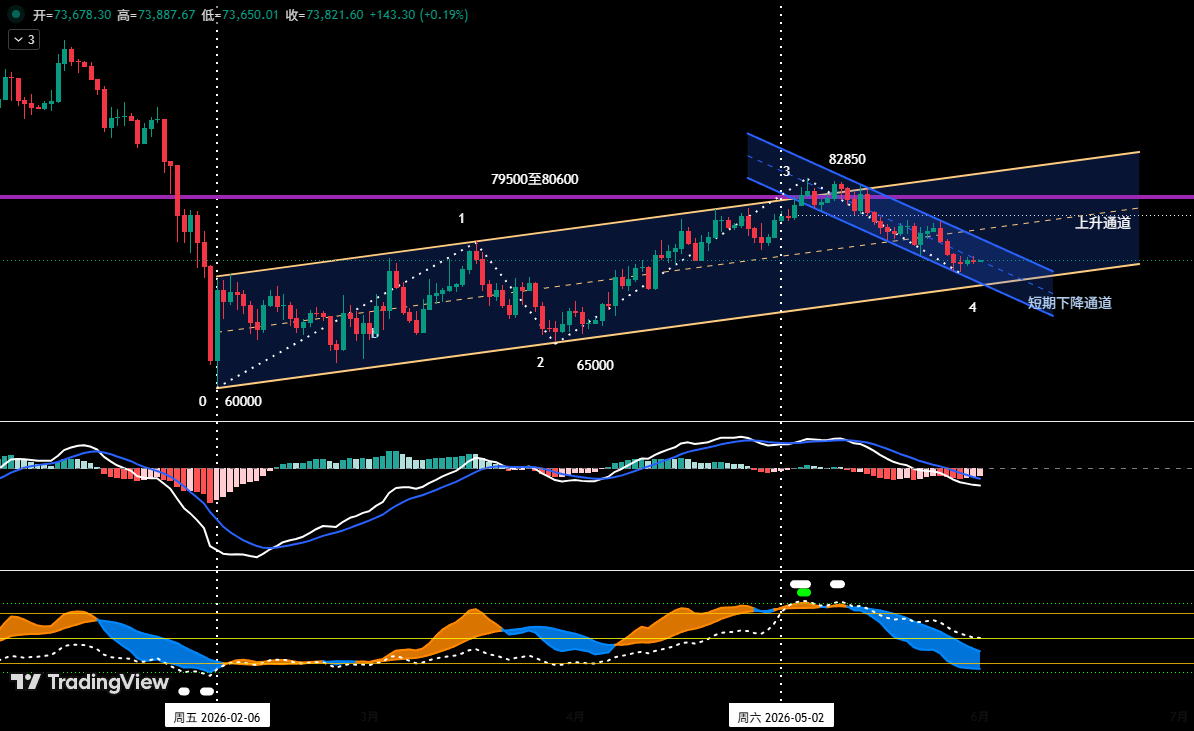
Figure 1
• Ascending Channel (Yellow): As shown in Figure 1, since the low on Feb 6, 2026, Bitcoin has oscillated upward within an ascending channel. (Lower Trendline: connecting the lows of Feb 6 and Mar 29; Upper Trendline: a line parallel to the lower trendline drawn through the high of Mar 17)
• Short-term Descending Channel (Blue): After hitting a high of $82,850 on May 6, Bitcoin entered a short-term descending channel. (Upper Trendline: connecting the two bounce highs of May 14 and May 26; Lower Trendline: connecting the two correction lows of May 7 and May 23)
• According to the Ascending Channel (Yellow), the price has lost the channel's midpoint and is seeking stronger support at the lower trendline.
• According to the Short-term Descending Channel (Blue), the price found temporary support at the channel's lower trendline (approx. $72,500) and is currently in a weak rebound cycle targeting the channel's upper trendline.
Overall Assessment: From a technical structure perspective, Bitcoin is influenced by both long and short-term channels. The current rebound is primarily a correction of short-term oversold conditions, targeting the upper trendline of the short-term descending channel (Blue). However, as the price has already broken below the midpoint of the ascending channel (Yellow), the overall technical structure has weakened. It is expected that after the rebound concludes, the price will likely resume its previous downward trend and further test the support strength of the ascending channel's lower trendline.
1.2 In-depth Analysis of BTC Hourly-Level Structural Formation: (Using 4-hour analysis timeframe)
Bitcoin - 4-hour K-line Chart
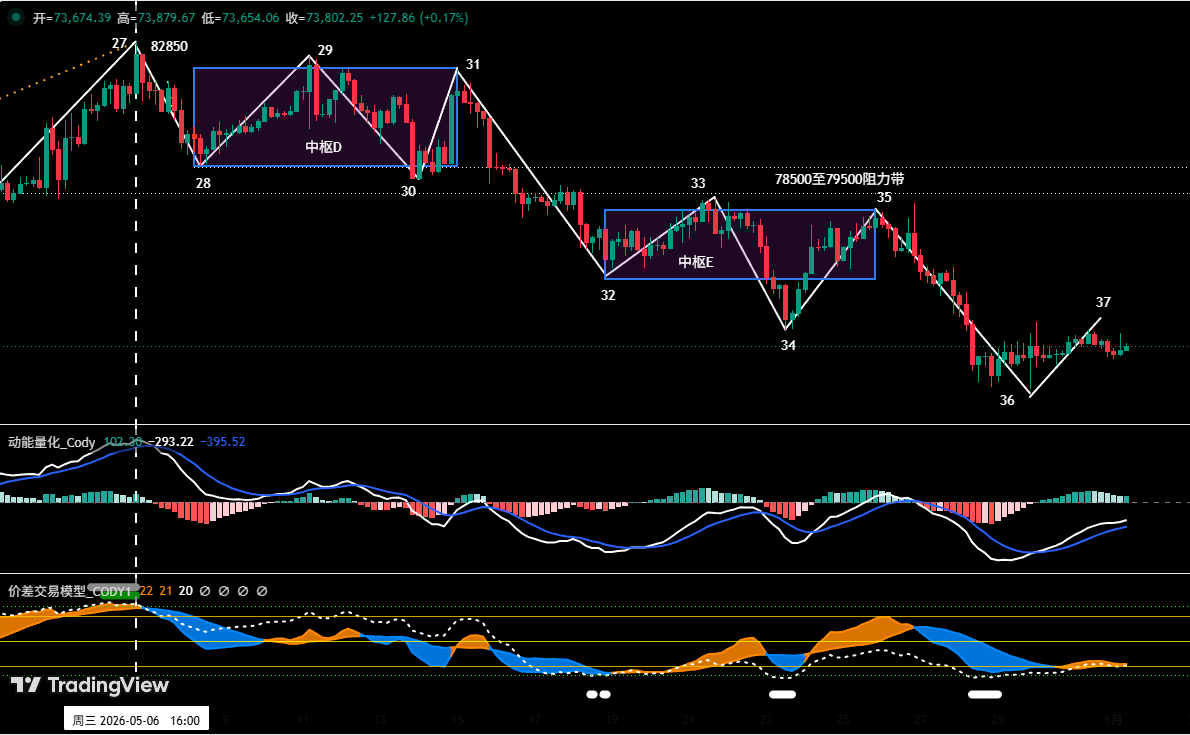
Figure 2
① As shown in Figure 2, since the adjustment began from the May 6 high of $82,850, the 4-hour chart reveals a ten-wave corrective structure, from the '27-28 segment' to the '36-37 segment'. This structure also includes two descending consolidation zones:
• Consolidation Zone D: Formed by the overlapping of segments 28-29, 29-30, and 30-31.
• Consolidation Zone E: Formed by the overlapping of segments 32-33, 33-34, and 34-35.
② Based on the 4-hour structural formation, the '36-37 segment' rebound is currently underway. If the price meets resistance in the $75,000 to $76,000 range and fails to break out effectively, the market will likely continue its previous oscillating downward trend and test the support zone around $69,500 to $70,500.
2. Bitcoin Price Forecast and Trading Strategy for This Week
2.1 BTC Price Forecast for This Week:
Core View: Focus on the outcome of the test between bulls and bears on the $75,000 to $76,000 resistance zone and the $69,500 to $70,500 support zone.
2.2 Key Resistance Levels:
• First Resistance Zone: $75,000 to $76,000 (Near the lower edge of Consolidation Zone E)
• Second Resistance Zone: $78,500 to $79,500 (Near the upper and lower edges of both Consolidation Zones)
2.3 Key Support Levels:
• First Support Level: $69,500 to $70,500 (Previous key support zone)
• Second Support Level: Around $65,000 (Previous key support zone)
2.4 Trading Strategy for This Week (Excluding Unexpected News Impact)
① Mid-term Strategy:
Bitcoin - Daily K-line Chart: (Position Monitoring Model)
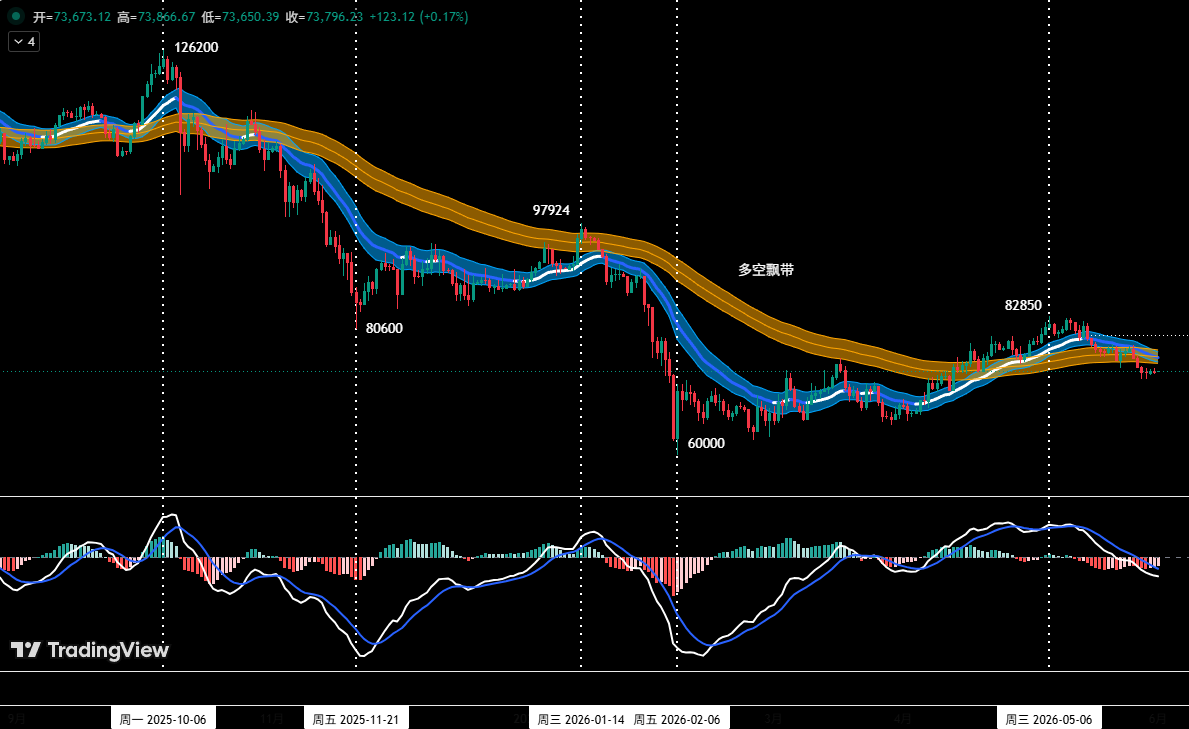
Figure 3
Position Monitoring Model: As shown in Figure 3, the price has fallen below the 'Bull-Bear Channel,' entering a technically weak area. This week's focus is on the outcome of its retest of the Bull-Bear Channel (approx. $75,000 to $76,000). If the price stalls and shows signs of rejection upon retesting this level, a mid-term short position will be initiated. To control risk, the initial position should be limited to 30% of total capital; an additional 30% (total ~60%) can be added after the price decisively breaks below the lower trendline of the ascending channel (Yellow).
② Short-term Strategy: Utilize 30% of the position, set stop-losses, and look for 'spread' trading opportunities based on support and resistance levels. (Use the 30-min / 60-min chart as the operating timeframe).
③ To dynamically adapt to complex market developments, two specific operational plans (Plan A/B) have been prepared in advance for short-term execution.
• Plan A: Short on bounces, rejection at resistance.
• Entry: If the price faces rejection upon rallying to the $75,000 to $76,000 zone, confirmed by a top signal from the quantitative model, enter a short position not exceeding 30% of capital.
• Risk Management: Initial stop-loss set above $77,000.
• Exit: Gradually cover the short position to take profit when the price nears key support levels, confirmed by model signals.
• Plan B: Short on follow-through, effective breakdown of support.
• Entry: If the price breaks below the $69,500 to $70,500 support zone decisively, confirmed by a top signal from the model, enter a short position not exceeding 30% of capital.
• Risk Management: Initial stop-loss set above $72,000.
• Exit: Gradually cover the short position to take profit as the price falls towards key support levels, confirmed by model signals.
3. Analysis of HYPE's Hourly-Level Structural Formation:
HYPE - 4-hour K-line Chart
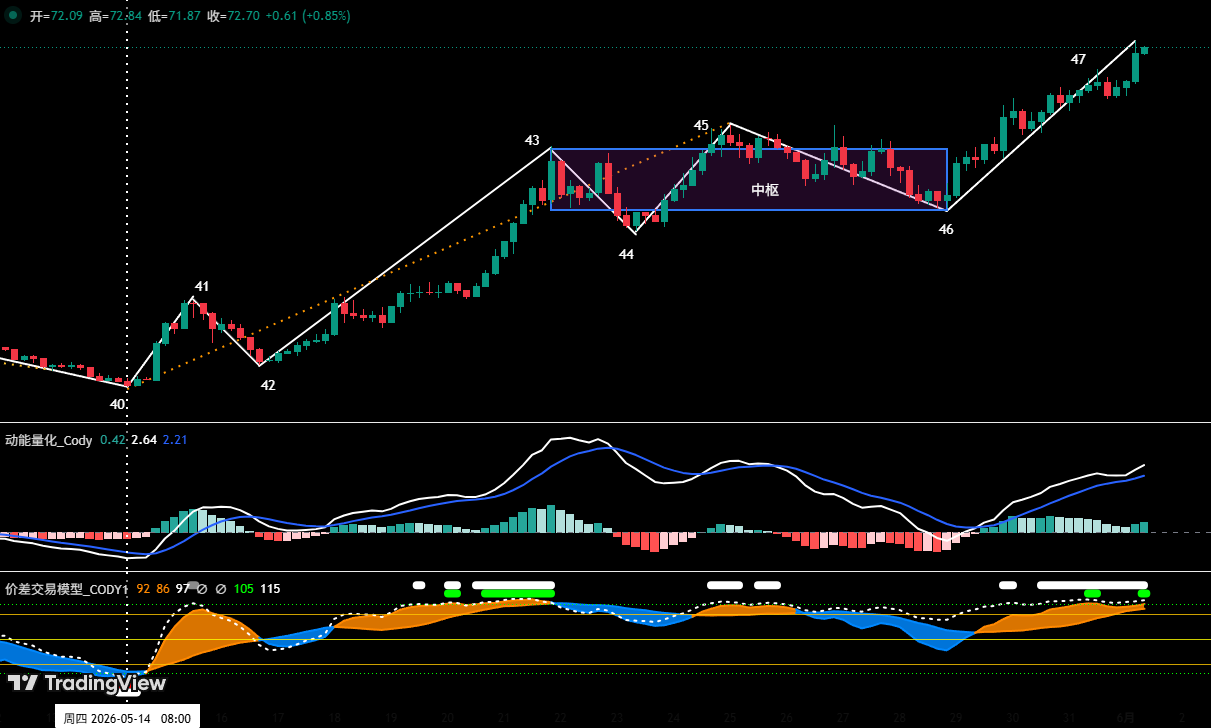
Figure 4
1、As shown in Figure 4, on the 4-hour timeframe, since the rally from the May 14 low of $38.14, HYPE has clearly formed a seven-wave structure including an 'ascending consolidation zone' (waves 40-41 to 46-47). The three overlapping segments 43-44, 44-45, and 45-46 form this 'ascending consolidation zone'.
2、Last week's review warned: With endpoint 45 showing bearish momentum divergence, combined with a top warning signal from the 'Spread Trading Model', the two signals formed a resonance, indicating a high probability of a short-term top. The market confirmed this: price adjusted from endpoint 45 ($64.75) to endpoint 46 ($56.30), a maximum decline of 13.05%.
3、Currently, comparing the departure segment of the consolidation zone (46-47) with the entry segment (42-43), its upward momentum appears weak, suggesting a high probability of potential 'momentum divergence'.
4、Analysis from our proprietary 'Spread Trading Model' shows that 'Endpoint 47' has triggered a strong top warning signal (Red Dot + White Dot).
5、In summary, if 'Endpoint 47' forms a top signal and the 'momentum divergence' signal remains valid, the probability of this becoming the phase endpoint of the rally since 'Endpoint 40' increases significantly. Future price action requires close attention to the outcome of a potential pullback test on the key zone of $62.5 to $64.57.
4. HYPE Price Forecast and Short-term Trading Strategy for This Week
4.1 HYPE Price Forecast for This Week:
Core HYPE View for This Week:
• Observe whether 'momentum divergence' is confirmed when 'Endpoint 47' emits a clear topping signal.
• If this phenomenon occurs and the price subsequently breaks below the $62.5 to $64.57 support zone effectively, 'Endpoint 47' can be considered the conclusion of the rally that started from the May 14 low.
4.2 HYPE Short-term Trading Strategy for This Week: (Buy on support)
This week's HYPE short-term trading should follow a 'shop for bargains at lows, avoid chasing rallies' strategy. The core objective is to observe the outcome of the price's test on the $62.5 to $64.75 zone:
Strategy 1: Test Long on Support Zone Stabilization
If the price corrects into this zone and shows signs of stabilization, simultaneously confirmed by bottom signals from both proprietary models, consider a small test long position. The position must be limited to 30% of capital, strictly adhering to stop-loss rules.
Strategy 2: Support Failure Escalates to Larger Degree Correction
If the price breaks below this zone effectively, the short-term correction will escalate to a larger degree (e.g., daily-level) correction, extending its duration and magnitude. The initial downside target would be the $54 to $56.3 zone.
5. Bitcoin Trade Review
5.1 Short-term Trade Review: (See Table 1)
Strictly adhering to the operational plan and executing based on signals from our proprietary 'Spread Trading Model' and 'Momentum Quantitative Model', we completed one short trade last week, yielding a profit of 5.07%.
① Bitcoin Short-term Trade Details Summary: (Leverage * 1x)
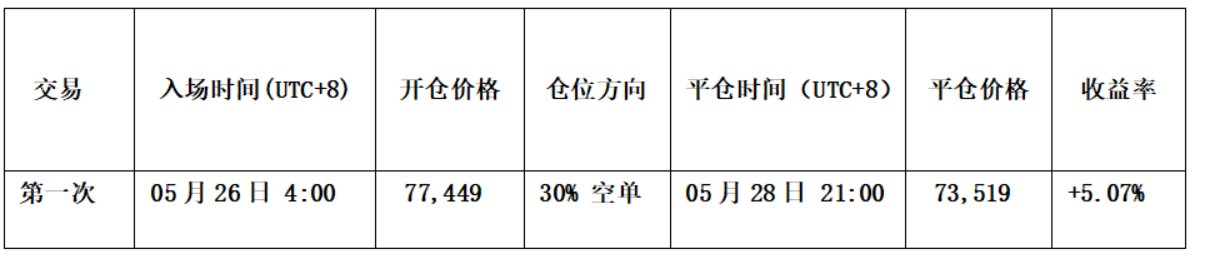
Table 1
② Short-term Trade Review: (See Figure 5)
• Entry Strategy:
a. Price encountered resistance near $78,000, forming a 'top divergence' bearish K-line pattern;
b. The 'Spread Trading Model' triggered a top warning signal (White Dot);
c. The 'Momentum Quantitative Model' issued a bearish momentum divergence signal.
Consequently, we entered a 30% short position at $77,449.
• Exit Strategy:
a. Price showed signs of stabilization near $73,000, forming a 'bottom divergence' K-line pattern;
b. The 'Spread Trading Model' triggered a strong bottom warning signal (Red Dot + White Dot), forming a bottom resonance signal with the 'Momentum Quantitative Model'.
Consequently, we covered the entire short position near $73,519.
• Summary: This trade successfully generated a profit of approximately 5.07%.
BTC - 60-min K-line Chart: (Momentum Quantitative Model + Spread Trading Model)
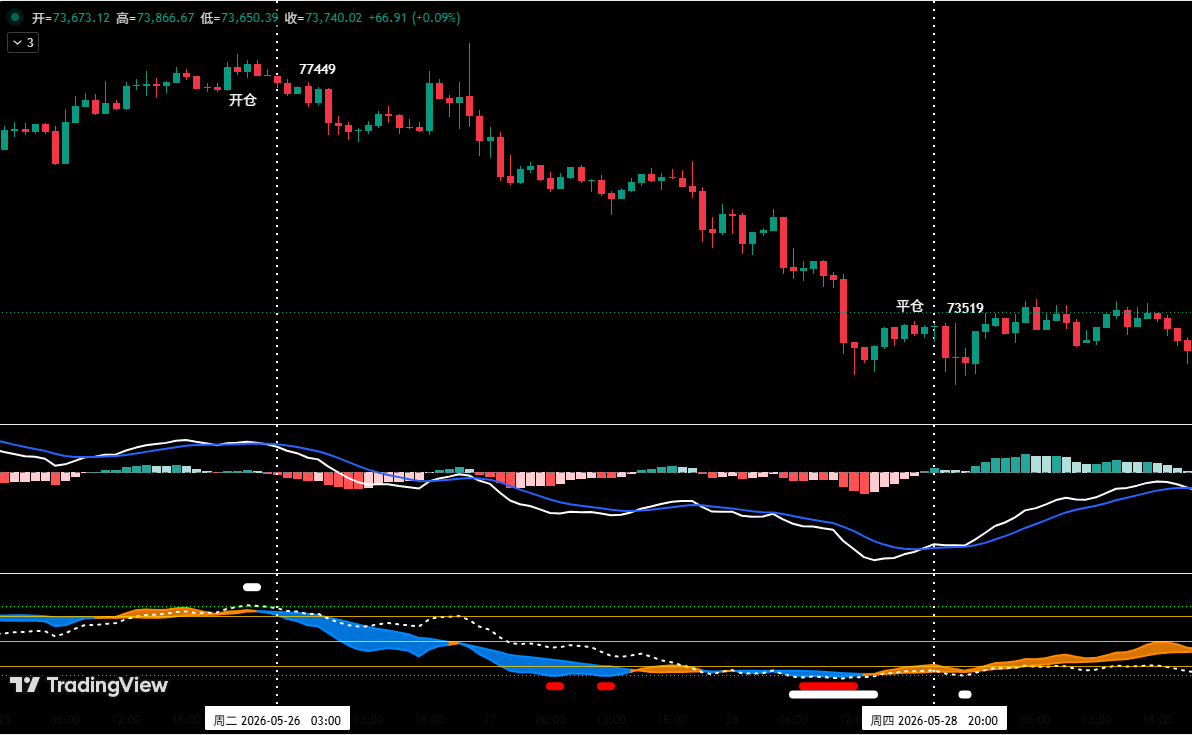
Figure 5 (Short-term Trade Illustration)
6. Special Notes:
1. Upon Entry: Immediately set the initial stop-loss.
2. When profit reaches 1%: Move the stop-loss to the entry cost price (breakeven point) to secure capital.
3. When profit reaches 2%: Move the stop-loss to the 1% profit level.
4. Continuous Tracking: For every subsequent 1% increase in profit, move the stop-loss up by 1% to dynamically protect and lock in gains.
Financial markets change rapidly. All market analysis and trading strategies require dynamic adjustment. All views, analytical models, and trading strategies in this article are derived from personal technical analysis and serve solely as a personal trading journal. They do not constitute any investment advice or operational basis. Markets involve risk, and investment requires caution. Please do not make decisions based solely on this.


