






BTC has been rejected three times at the $80,000 mark, while HYPE has shown a signal for consecutive new highs | Sponsored Analysis


- Core Viewpoint: This week, focus on Bitcoin's battle in the resistance zone of $78,500 to $79,500 and the support zone of $73,500 to $75,000. For HYPE, be wary of a short-term top formed by hourly-level momentum exhaustion. The strategy suggests shorting on rallies or going long on dips.
- Key Elements:
- Bitcoin's daily chart has maintained a complete upward channel since February 6th. The current price has pulled back from the channel's upper rail at $82,850 to the middle rail. If it fails to stabilize, the subsequent move could test the lower rail.
- The 4-hour chart shows Bitcoin in an 8-wave corrective structure. If the rebound in waves 34-35 encounters resistance in the $78,500 to $79,500 area, it will continue to consolidate and test the support level of $73,500 to $75,000.
- Since its low of $38.14 on May 14th, HYPE has been rebounding. In its five-wave uptrend on the 4-hour chart, a "price spread trading model" top warning and "momentum quantification model" bullish momentum divergence have appeared near the 45 level.
- If waves 42-45 of HYPE form a short-term top and it finds a foothold after pulling back to the $47.5 to $50 range, light long positions can be taken, with position size controlled below 30% and stop-losses set.
- Last week's short-term BTC short trade successfully realized a 2.78% return, opened at $77,782 and closed at $75,616, based on the convergence of the model's top and bottom signals.
- The medium-term strategy remains on the sidelines. Short-term, use 30% of the position for spreads between support and resistance levels, and use dynamic stop-losses to protect capital and profits.
This week, we continue with our consistent structured analytical framework, focusing on Bitcoin and HYPE. We will deconstruct the current trends from a multi-cycle perspective, analyze the battle between bulls and bears at key resistance and support levels, and formulate specific executable operational plans based on this analysis.
Last week's short position operation successfully yielded a 2.78% gain, once again validating the "signal-driven, discipline-bound" trading logic. However, a single profitable trade never guarantees the directional analysis is correct – the market always holds possibilities beyond our forecasts.
The core variable this week remains the contest between the 78,500 – 79,500 USD resistance zone and the 73,500 – 75,000 USD support zone. The outcome will be left for the market to decide.
Summary of Core Trading Views for This Week:
• Analysis of BTC's multi-cycle trend structure. (Detailed in Part 1)
• BTC price forecast for this week and medium/short-term trading strategies. (Detailed in Part 2)
• Analysis of HYPE's hourly-level trend structure. (Detailed in Part 3)
• HYPE price forecast for this week and short-term trading strategy. (Detailed in Part 4)
Market Validation of Last Week's Trading Strategy and Core Views:
• BTC Short-term Trading Results: Bitcoin completed one short-term short position operation last week (1x leverage), successfully realizing a gain of approximately 2.78%. (Detailed in Table 1)
• Market Validation of BTC Price Forecast: In our article last week, we pointed out that if the price effectively breaks below the 78,500 – 79,500 USD support zone, it would test the support near the 75,000 USD level. The current market movement has validated our previous forecast.
I. Analysis of Bitcoin's Multi-Cycle Trend Structure
1. Analysis of BTC Daily Level Trend Structure
Bitcoin _ Daily K-line Chart:
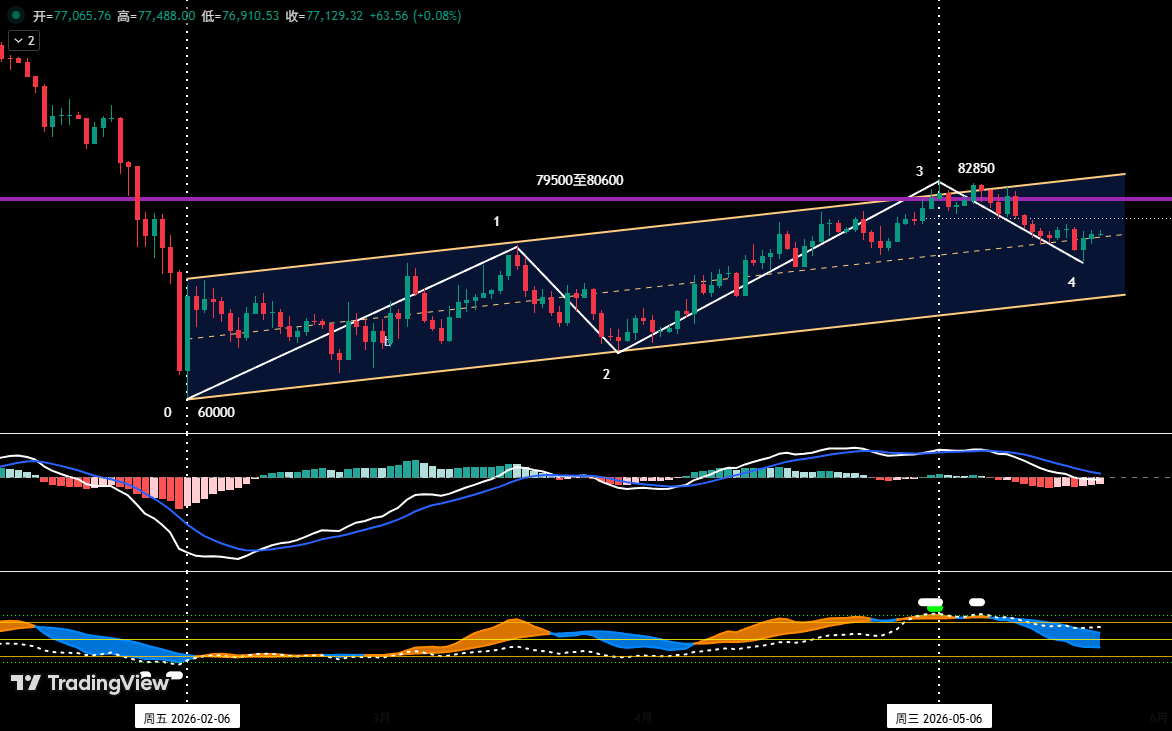
Figure 1
• As shown in (Figure 1), since establishing a cyclical low near $60,000 on February 6, 2026, Bitcoin's daily chart has built and maintained a clearly structured ascending channel: Its lower trendline connects the lows of February 6 and March 29, while the upper trendline is drawn parallel to the lower trendline through the high of March 17.
• In our April 27th weekly review, we pointed out: "The current price is facing dual resistance from the channel's upper trendline and the $79,500 to $80,600 resistance zone, making a breakout appear difficult". Subsequent market movement validated this assessment. After nearly 20 days of struggle between bulls and bears, although the price reached a new rally high of $82,850 on May 6, it failed to effectively break through this zone's resistance, and the price subsequently began to oscillate downwards.
• Observing the current structure, the price has corrected back from near the channel's upper trendline to the middle area of the channel.If the price cannot find effective support near the middle trendline and resume its upward momentum, the probability of it subsequently seeking support at the lower trendline is increasing.
2. In-depth Analysis of BTC Hourly Level Trend Structure
Bitcoin _ 4-hour K-line Chart
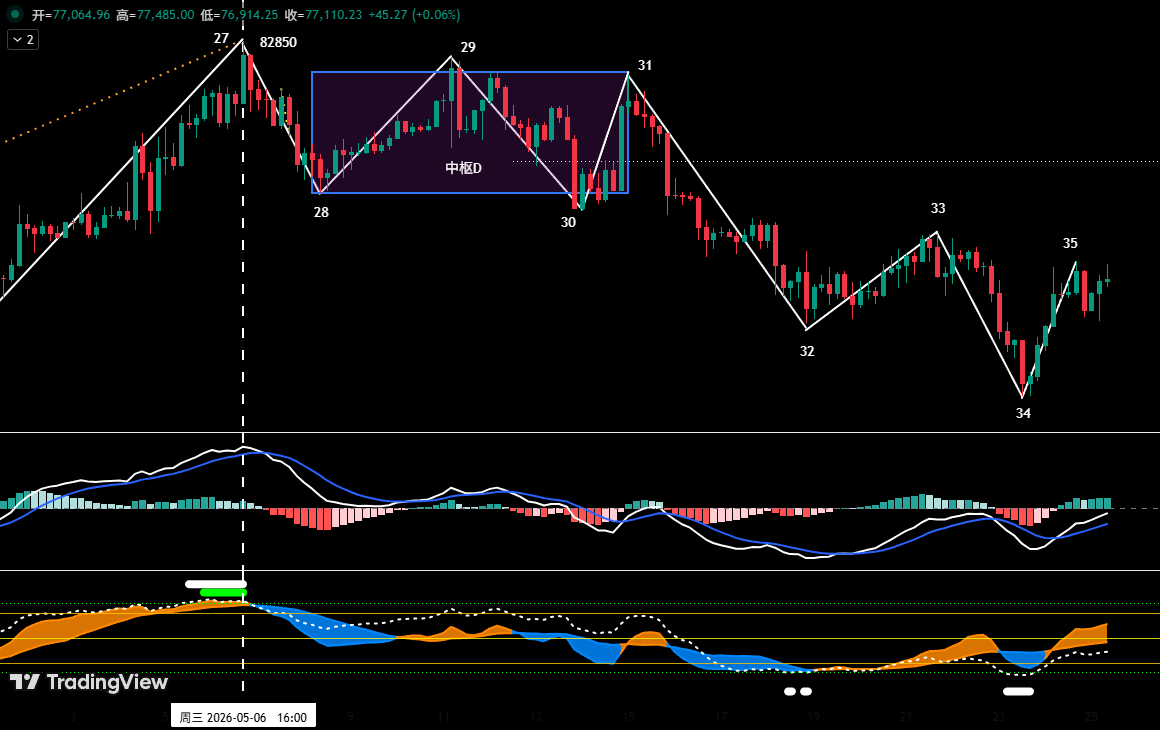
Figure 2
As shown in (Figure 2), the adjustment from the May 6 high of $82,850 has continued until now;
• On the 4-hour chart, this can be subdivided into an 8-segment adjustment structure from "Segment 27-28" to "Segment 34-35". Central D: Segments 28-29, 29-30, and 30-31 overlap each other, forming Central D.
• From the perspective of the 4-hour structure, Segment 34-35 is about to rebound towards the $78,500 – $79,500 zone. If the price encounters resistance and falls back upon reaching this zone without forming an effective breakout, the market will likely continue its current oscillating adjustment pattern and could test the core support zone of $73,500 – $75,000 again.
II. Bitcoin Price Forecast for This Week and Trading Strategy
1. BTC Price Trend Forecast for This Week:
This Week's Core View: Focus on the outcome of the battle between bulls and bears for the $78,500 – $79,500 resistance zone and the $73,500 – $75,000 support zone.
2. Core Resistance Levels:
• First Resistance Zone: $78,500 – $79,500 (Near the upper/lower bounds of two centers)
• Second Resistance Zone: $83,500 – $84,500 (Previous high-volume consolidation zone for bulls and bears)
3. Core Support Levels:
• First Support Level: $73,500 – $75,000 Zone (Previous important support level)
• Second Support Level: $69,500 – $70,500 Zone (Previous important support level)
4. This Week's Trading Strategy (Excluding unexpected news impact)
①, Mid-term Strategy:
Bitcoin _ Daily K-line Chart: (Position Monitoring Model)
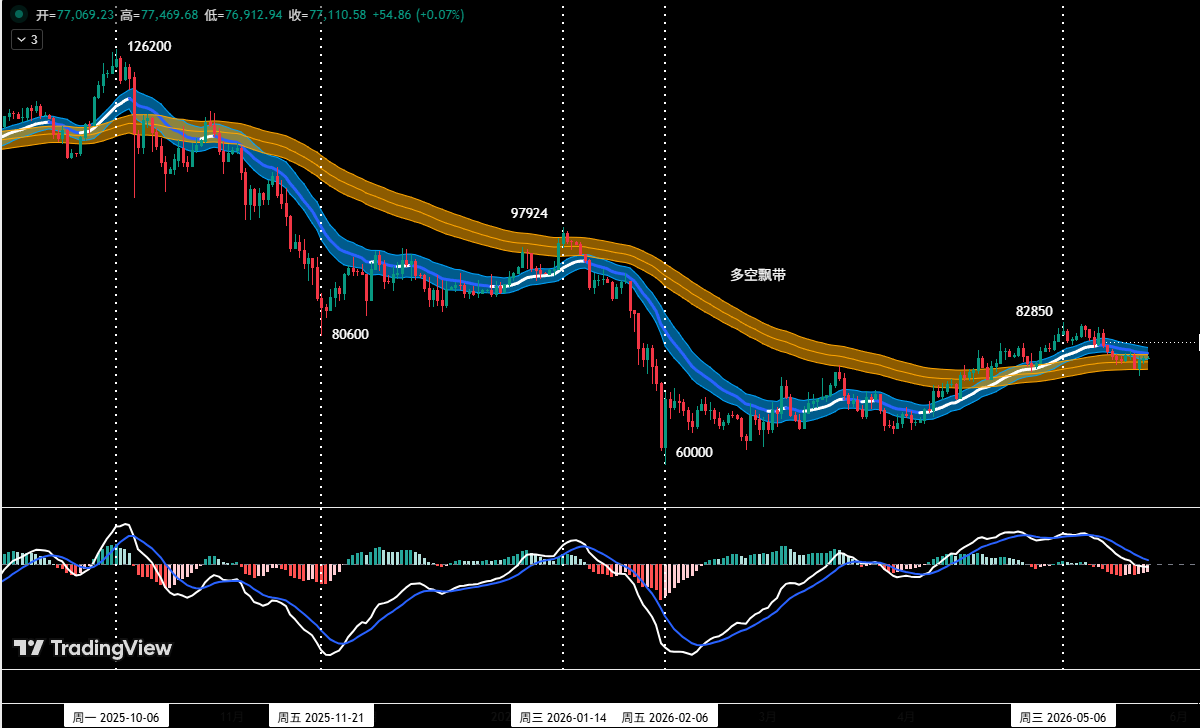
Figure 3
Position Monitoring Model: As shown in (Figure 3), based on trading rules, the medium-term market direction is not clear. This week, the mid-term strategy is to remain on the sidelines and observe.
②, Short-term Strategy: Use 30% of the position, set a stop-loss, and look for "spread" trading opportunities based on support and resistance levels. (Using 30-minute/60-minute charts as the operating cycle).
③, To dynamically respond to complex market developments in short-term trading, we have prepared two specific operational plans, A/B, in advance.
• Plan A: Resistance on rebound, short on rallies.
• Entry: If the price rebounds to the $78,500 – $79,500 zone and encounters resistance, combined with a top signal from the quantitative model, establish a short position of up to 30%.
• Risk Control: Set initial stop-loss above $80,600.
• Exit: When the price adjusts near important support levels, combined with model signals, gradually close the position to take profits.
• Plan B: Effective breakdown of support, short on follow-through.
• Entry: If the price effectively breaks below the $73,500 – $75,000 support zone, combined with a top signal from the model, establish a short position of up to 30%.
• Risk Control: Set initial stop-loss above $76,500.
• Exit: When the price drops near important support levels, combined with model signals, gradually close the position to take profits.
III. Analysis of HYPE Trend Structure
HYPE_4-hour K-line Chart
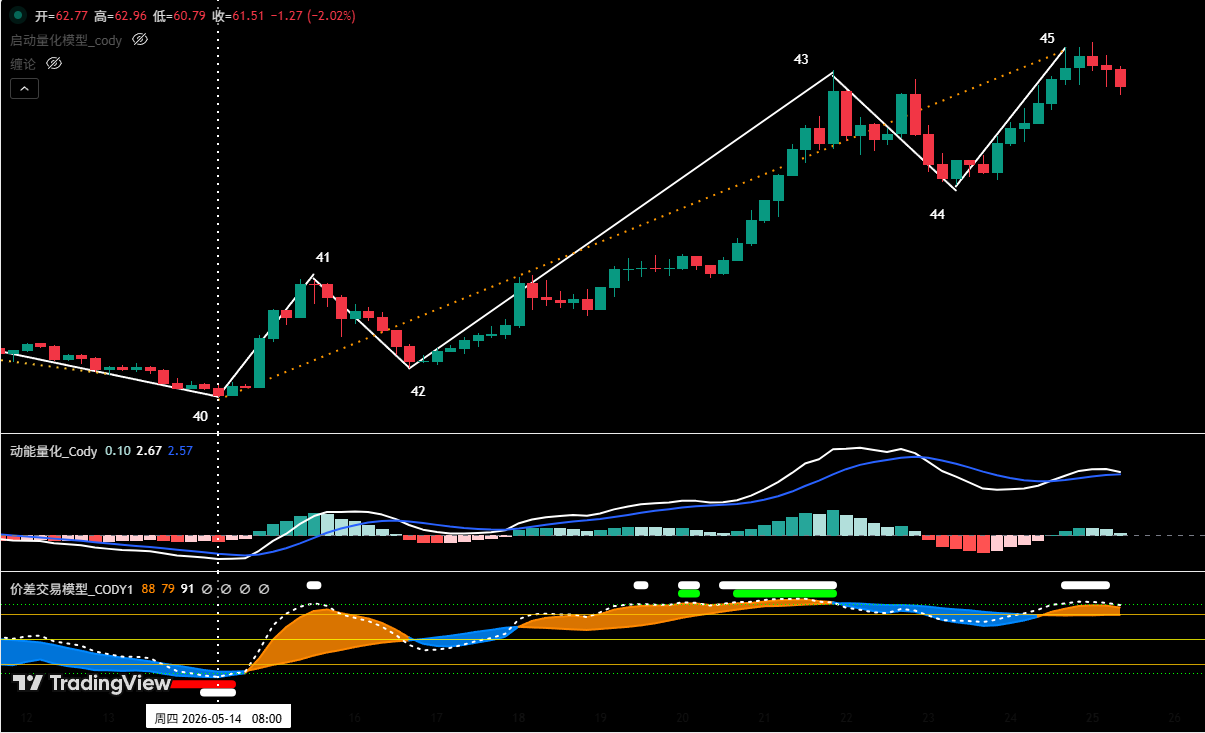
Figure 4
1. As shown in (Figure 4), the upward trend of HYPE, starting from the low of $38.14 on May 14, can be divided into a five-segment structure on the 4-hour chart: 40-41, 41-42, 42-43, 43-44, 44-45.
2. Our proprietary "Spread Trading Model" indicates that near endpoint 45, a top warning signal (white dot) has been triggered.
3. According to the "Momentum Quantification Model," the upward segment (44-45) has shown weakening upward momentum near the $65 level.
4. If the price forms a momentum top divergence at "Endpoint 45", and this coincides with the top warning signal from the "Spread Trading Model" – creating a resonance effect – the probability of the price establishing a short-term high at this point increases significantly.
IV. HYPE Price Forecast for This Week and Short-term Trading Strategy
1. HYPE Price Trend Forecast for This Week:
Core Views on HYPE for This Week:
• Observe whether "Endpoint 45" can form a short-term high since the rally began on May 14.
• If a short-term high is formed, look for a long entry opportunity when the price pulls back to a key support zone (e.g., $47.5 to $50) and shows clear signs of stabilization.
2. HYPE Short-term Trading Strategy for this week: (Long on Support)
Currently, adhere to the strategy of "Avoid chasing rallies; go long on dips." If the price corrects to the $47.5 to $50 zone, stabilizes, shows signs of stabilization triggered by the bottom signals from our two models, consider a small long position. The position size must be kept below 30%, and stop-loss discipline must be strictly followed.
V. Trade Review
1. Short-term Trade Review: (See Table 1)
We strictly followed the operational plan based on the trading signals generated by our proprietary "Spread Trading Model" and "Momentum Quantification Model," completing one short-term operation (short position) last week, resulting in a profit of 2.78%.
①, Bitcoin Short-term Trade Details Summary: (Leverage*1x)
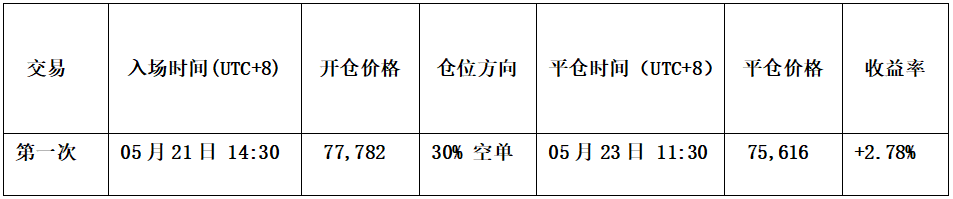
Table 1
②, Short-term Trade Review: (See Figure 6)
• Entry Strategy:
a. When the price rebounded near $78,500, encountered resistance, and formed a bearish "top divergence" signal on the K-line;
b. The "Spread Trading Model" triggered a top warning signal (white dot), and the "Momentum Quantification Model" formed a momentum top divergence signal.
Therefore, we established a 30% short position at $77,782.
• Exit Strategy:
a. When the price fell near $75,000 and stabilized, forming a "bottom divergence" signal on the K-line;
b. The "Spread Trading Model" triggered a strong bottom warning signal (red dot + white dot), which resonated with the bottom signal from the "Momentum Quantification Model."
Therefore, we closed all positions near $75,616.
• Summary: This trade successfully yielded a profit of approximately 2.78%.
BTC_30-minute K-line Chart: (Momentum Quantification Model + Spread Trading Model)
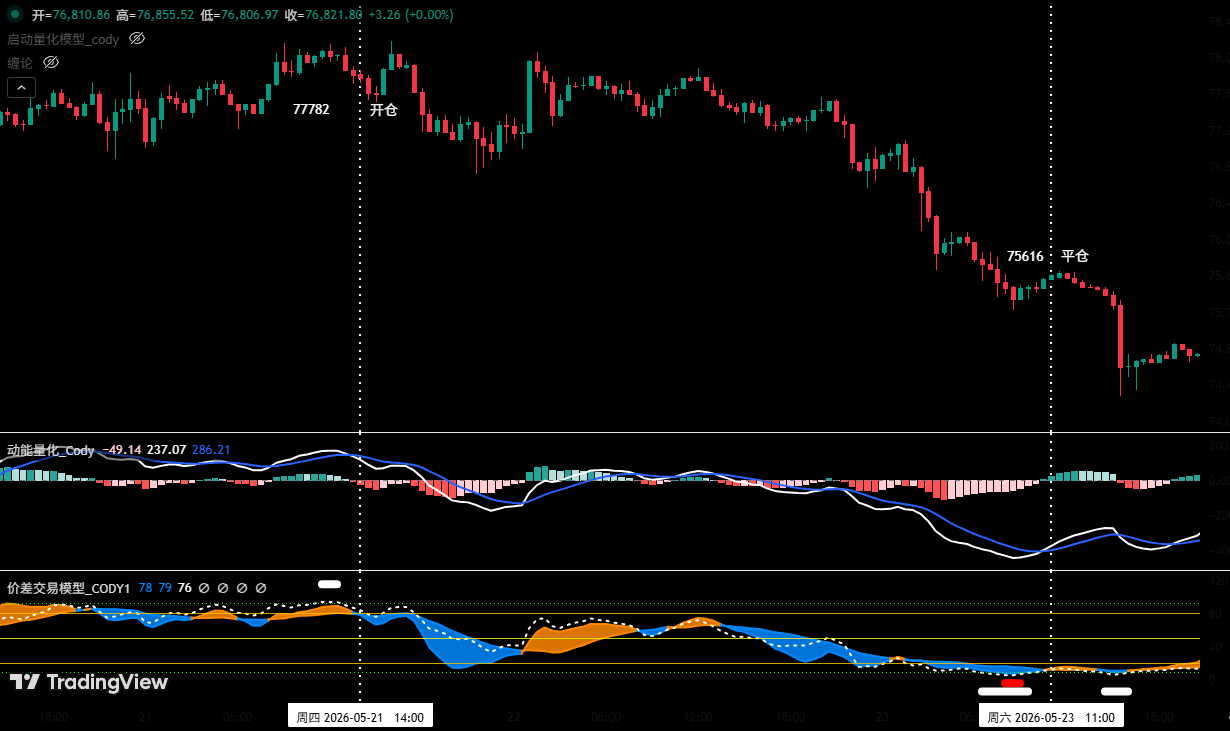
Figure 5 (Short-term Trade Illustration)
VI. Special Reminders:
1. Upon entering a trade: Immediately set an initial stop-loss.
2. When profit reaches 1%: Move the stop-loss to the entry cost (breakeven point) to ensure capital safety.
3. When profit reaches 2%: Move the stop-loss to the 1% profit level.
4. Continuous Tracking: For every additional 1% gain in price thereafter, move the stop-loss up by the same 1% to dynamically protect and secure profits.
The financial market changes rapidly; all market analysis and trading strategies require dynamic adjustment. All views, analytical models, and operational strategies mentioned in this article are based on personal technical analysis, intended solely as a personal trading log, and do not constitute any investment advice or operational basis. The market carries risks, and investment should be made cautiously. Please do not make decisions based on this.


