
浅谈以太坊估值框架:ETH如何纳入超级资产类别?
原文作者:Michael Nadeau
原文来源:The DeFi Report
原文编译:DeFi 之道
本周,我们将分享我们当前对第 1 层区块链估值框架的看法,重点是以太坊。涵盖的主题:
代币作为资本形成的工具
ETH 如何纳入超级资产类别框架
链上财务和贴现现金流(Discounted cash flow)分析
ETH 作为数字商品和价值存储
我们最喜欢监控的 KPI 指标

为什么代币有用
我们之前已经详细介绍了代币基础知识。如果你有兴趣,可以在此处找到有关代币经济学 101 的更多信息。
为了给本报告做个铺垫,我想简要地重申一下为什么我们认为代币是一个强大的引导和资本形成工具。如果你对此已经很熟悉,则可以跳过本节。
简单地说,当需要在广大公众中以无需许可的方式激励某些行为时,代币是最有用的。代币可以帮助协调活动以实现一个共享的、广泛的、去中心化的目标。
以以太坊为例,其目标是创建一个世界计算机或开放数据网络,它可以利用智能合约、点对点交互和用户控制的数据为基于互联网的新商业模式提供动力。
为了以开源方式引导它的存在——没有个人或实体控制对数据网络的访问(或编辑权限),以太坊发行了一种代币,并对区块链进行编程以奖励早期贡献者。借鉴比特币的成功,这创造了必要的激励来帮助协调全球个人贡献者和服务提供商的行为——开发者、验证者、节点运营商、矿工等。
超级资产类别框架
在传统金融中,我们通常将金融资产分为 3 个超级资产类别:
1.资本资产:直接产生现金流的资产。债券、房地产和股票都属于这一类别。
2.可消费/可转化资产(Consumable/Transformable Assets ): 可以消费或转化的资产,并具有经济价值但不直接产生现金流的资产。例如玉米、石油或贵金属等商品。
3.价值存储或货币资产:不提供收入流并且也不能被消费或转换的资产。例如货币、贵金属(货币溢价)、艺术品和收藏品。
像 ETH 这样的第 1 层加密资产如何适应这个框架?事实上,ETH 具有所有三个超级资产类别的特征。
资本资产:以太坊产生现金流——由验证者/区块生产者通过用户交易获取,收益只能通过持有原生代币并将其抵押到智能合约中获取。
*请注意,持有 ETH 本身并不能使人获得收益——就像支付股息的股票或债券那样。必须质押他们的 ETH——验证交易并向网络提供服务——才能获得收益。
可消费/可转换资产:以太坊也具有商品的特征。随着越来越多的人使用网络,ETH 被“消耗”。此功能是通过销毁机制进行编程的,该机制的功能类似于随着对区块空间需求的增加而自动回购股票。就像你需要汽油来操作车辆和机械一样,你也需要一些 ETH 来使用以太坊数据库或构建在它之上的任何应用程序。你支付的大约 70-85% ETH 将被“销毁”并从流通中移除。这就是为什么有人说 ETH 就像“数字石油”。它具有使其功能像数字商品一样的特点。
价值储存/货币资产:价值储存/货币资产的感知价值取决于汇率和市场参与者的看法。例如,如果人们认为美元在未来几年的通货膨胀率将高于正常水平,他们可能希望持有黄金而不是美元。或者如果他们认为美国是一个更稳定的经济体,他们可能会持有美元而不是欧元。
人们可能会根据市场对这些物品价值的看法来持有收藏品或奢侈品艺术品。一般来说,价值存储资产需要独特且稀缺。由于以太坊(网络)的效用在未来几年可能会增加,而 ETH(资产)的供应量会减少,因此一些市场参与者将 ETH 视为一种价值储存手段。
链上金融
以太坊出售区块空间,这就是产品。它的区块空间有需求,因为它在区块链上和周围构建了一个由开发人员、节点、验证器、数据预言机、用户和企业组成的网络。开放数据库的功能与智能合约相结合,允许点对点交互和新的、基于互联网的商业模式的形成。
想在 Aave 上贷款或在 Uniswap 上交易?你将需要为区块空间付费。想要铸造或购买 NFT?想将一些 USDC 发送给家人?想玩基于以太坊的游戏吗?你都需要一些区块空间。
每笔交易——记录数据(不仅仅是金融)——都必须支付区块空间费用。用户使用原生代币 ETH 为区块空间付费。以太坊是一个技术平台,我们可以像看待亚马逊或苹果的 iPhone 一样来看待它。除了销售硬件外,Apple 的 iPhone 还通过开发人员构建应用程序并将其上架 App Store 来赚钱。因此,如果开发者在以太坊平台上建立人们想要使用的有趣的新业务,那么为该平台提供动力的加密资产 ETH 应该会产生经济价值。
让我们使用一个简单的链上财务报表框架来分解这一点:
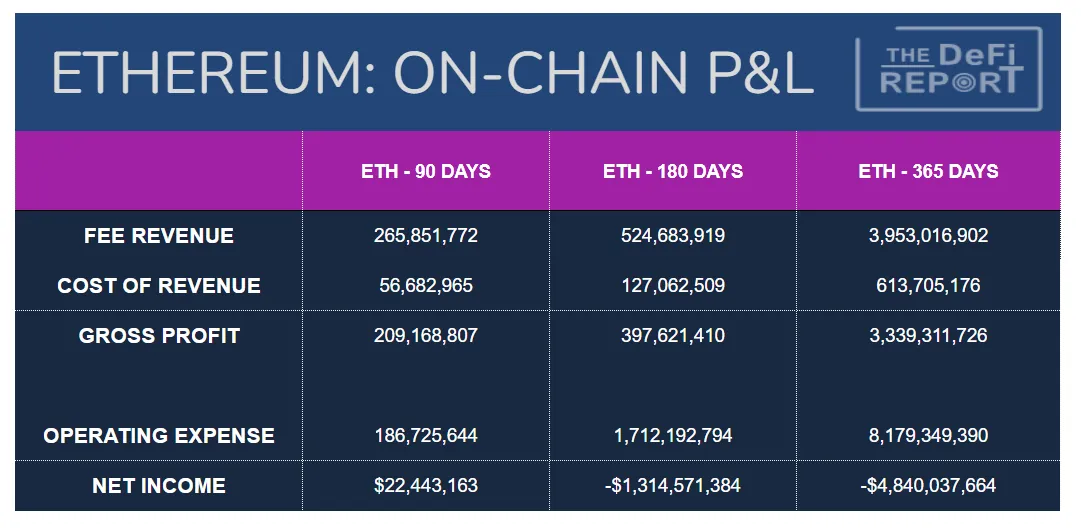
数据:Token Terminal
费用收入(Fee Revenue):指在此期间出售的区块空间的总美元价值。
收入成本:指支付给全球服务提供商(验证者)的费用的美元价值。去年,大约 15% 的费用支付给了验证者——这相当于目前验证者的收益率约为 5.1% 。
毛利润:指产生的总费用减去支付给服务提供商/验证者的金额。这也是 ETH 销毁的美元总额——我们应该将其视为股票回购,使 ETH 的被动持有者受益。稍后会详细介绍。
运营费用:这是支付给全球服务提供商/验证者的区块补贴(或协议通货膨胀)的美元价值。我们可以将这个项目视为以太坊的安全预算。合并后它减少了 90% 。*我们会注意到区块链在这里实际上并没有“支付”任何东西。我们应该把它看成更像是一家初创公司发行额外的股权,稀释现有股东。
净收入:毛利润与营业费用之间的差额。这扣除了总网络费用收入减去费用的百分比和支付给服务提供商/验证者的区块补贴。当这个数字是正数时,它表示被销毁的 ETH(由于交易量)多于支付给验证者的网络安全费用。
重要说明:理论上可以“销毁”或从流通中移除的 ETH 数量没有限制,因为它与交易量直接相关。更多的交易(对区块空间的需求)= 更多的 ETH 被销毁并从市场上移除。但是,可以发行的 ETH 数量是有限制的。它由以太坊基金会的前瞻性指导决定,并取决于锁定在质押/验证器智能合约中的 ETH 数量。如今,由于 13.8% 的流通 ETH 锁定在质押合约中,该网络的通货膨胀率约为 1700 ETH/天。
该平台铸造新的 ETH 并将其支付给验证交易和保护网络的验证者——运营费用/代币激励。只要对区块空间的需求超过安全预算,网络就可以被视为有利可图——因为循环供应量将会下降(有利于被动持有者)。同时,验证者(活跃持有者)将从交易费用中获得可观的收益。
我们可以看到,尽管加密货币经历了深度熊市,但上个季度就是这种情况。在浏览损益表时,你可能想知道为什么区块链在过去 6 个月和 12 个月内相对不盈利。
我们可以将盈利能力的转变归因于 9 月 16 日发生的合并。下面我们可以观察合并以来 ETH 的净新发行量。
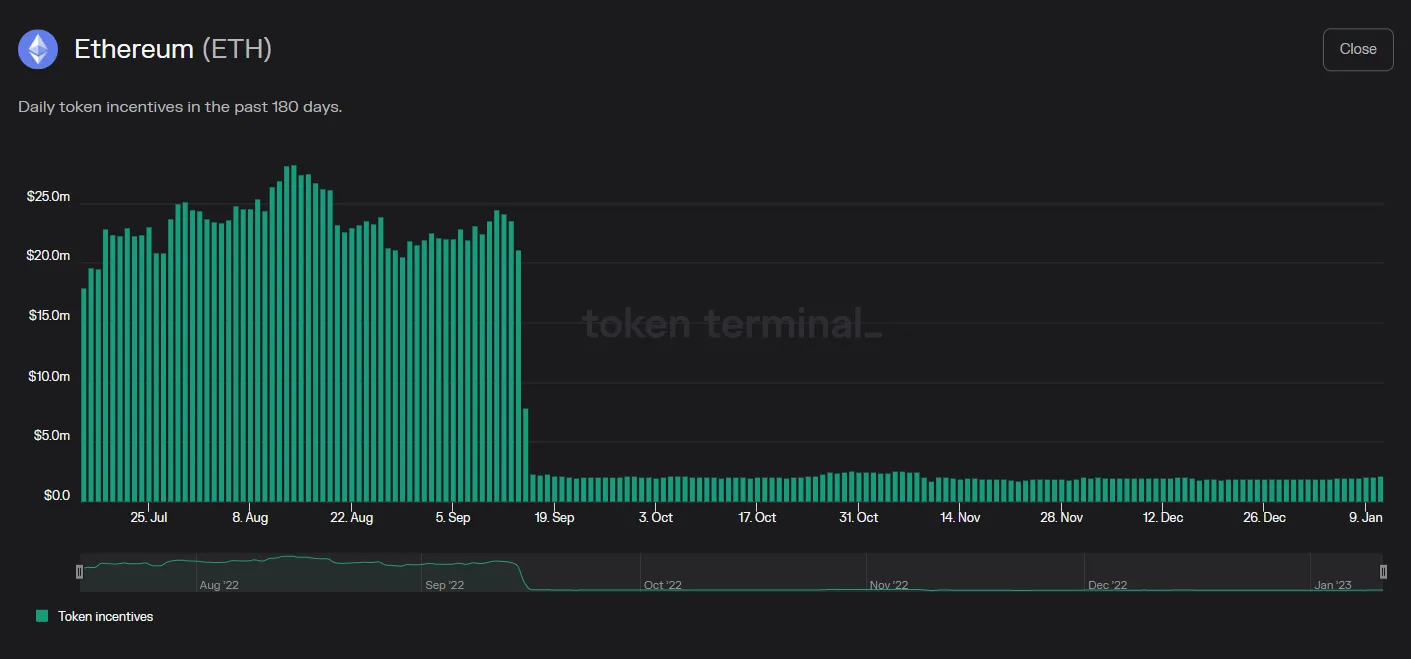
数据来源:Token Terminal
以太坊基金会对其矿工的报酬过高!这张图直观地表明了这一点。如前所述,自从网络转为权益证明(PoS)后,以太坊将其安全费用削减了大约 90% 。
资本资产估值
由于 ETH 具有投机性和波动性——从市场价值和使用的角度来看,我们运行了两种不同的贴现现金流。
a.2022 年交易费用总额,年均增长率为 25% ,贴现率为 12% ,期限为 20 年。这使我们的市值达到 4160 亿美元或 3459 美元/代币完全稀释。请记住,这些是熊市数据,因为与 2021 年相比, 2022 年的费用下降了 58% 。这里是一个简单的 DCF 计算。
b.2021 年交易费用总额,年均增长率为 25% 。如果我们保持其他一切不变并推断 2021 年的年收入,我们将获得 9660 亿美元的市值或 8022 美元/代币。这给了我们一个使用牛市数据进行估值的想法。这里是一个简单的 DCF 计算。
以太坊有可能作为具有许多其他用例的全球金融的结算层。因此,可寻址市场非常大。从这个角度来看, 1 万亿美元的市值似乎是合理的。
请注意,我们使用了相当保守的 25% 的年均费用增长率。过去 5 年,以太坊手续费收入的实际复合年增长率为 146% ,其中包括 2022 年 58% 的显著下降。
这些计算是估值分析的起点,请不要将其作为投资建议。期限、贴现率和平均增长率可以根据各种情景分析的需要进行调整。使用总交易费用作为我们的起点也可能有错误的假设。最后,可能需要对 ETH 的被动持有者(非质押者)和质押者/验证者进行单独分析。
收入/收益倍数
因为以太坊是一个去中心化的网络,它的费用是由其分布式的服务提供商/验证者承担的。这些费用本质上是质押的对价,即质押的 ETH 的美元价值。正如我们在链上财务部分所指出的,网络费用也可以被视为协议通货膨胀/网络为激励验证者参与而支付的费用。一些分析师认为网络费用是分散的,因此不应包含在收益倍数分析或贴现现金流量分析中。在这种情况下,总收入将被视为收益。
从这个角度来看,如果我们将过去几年的收入乘以倍数,并将它们与今天的市值进行比较,我们将得到:
2021 年: 17 倍的收入倍数或价格/销售额比率
2022 年: 41 倍的收入倍数或价格/销售额比率
这些数字可能被视为具有吸引力,因为一家高增长的科技公司可能会看到更高的收益倍数。特斯拉是一个极端的例子,在 2021 年的牛市期间市盈率超过 200 倍。亚马逊目前的市盈率为 86 倍,目前比其峰值股价下跌 45% 。
每日流量
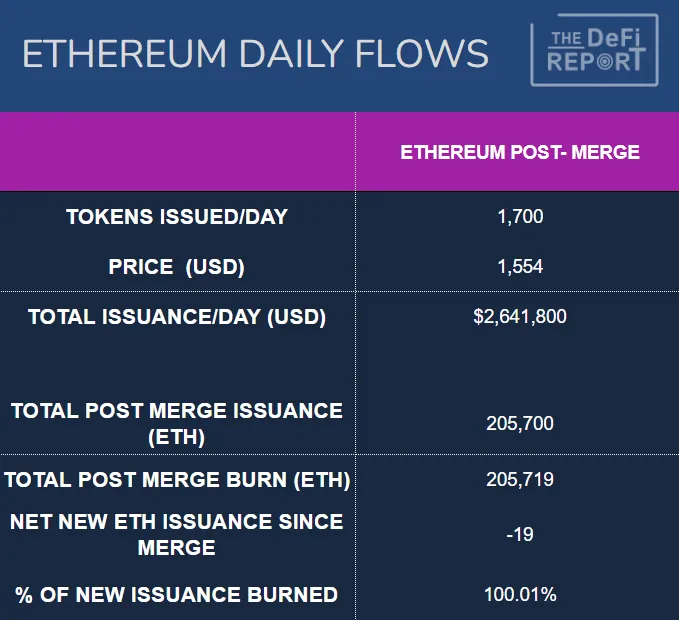
数据:Etherscan
上图是 9.16.22 - 1.15.23 合并后的数据。我们想强调自合并以来流量的巨大变化。在合并之前,当以太坊基金会疯狂地过度支付其矿工时,该网络每天发行约 13, 500 个新的 ETH。使用今天的 ETH 市场价格,每天新增供应量约为 2092.5 万美元。此外,矿工有运营成本(硬件 + 电力),因此出售了大约 80% 的奖励。
合并后,我们每天发行约 1700 个新的 ETH,几乎减少了 90% !这个数字根据质押的 ETH 总量略有波动。请记住,验证者没有运营费用。因此, 80% 的自动新供应卖压消失了。
最后,目前有 1800 万个 ETH 锁定在 DeFi 应用程序中,将这一数额加到质押合约中锁定的 1600 万 ETH 中,我们大约有 28% 的流通供应量锁定在智能合约中并赚取收益。我们可以将其视为“非流动性循环供应”。
要点:在合并之前,市场必须吸收大约 16, 000, 000 美元的每日保证抛售压力。这种抛售压力今天基本消失了。事实上,在 ETH 被销毁多于发行的日子里,需要结构性的“资金外流”来防止价格上涨。我们处于熊市,但快速浏览一下 Etherscan 就会发现,在 2023 年迄今为止的 14 天里,发行量有 11 天是净通缩的。
我们可以观察到近期市场活动的流量变化。以太坊在 2022 年 6 月(合并前)大幅抛售,跌至 900 美元左右的底部。11 月,我们又一次投降与 FTX 崩盘(合并后)有关——当时比特币带领大盘跌至新低。然而,以太坊坚守阵地。它没有创下新低。事实上,它的底部比 6 月的低点高出约 27% 。我们认为这是由于 2022 年 9 月 16 日合并导致的流量结构性变化。
商品估价
ETH 具有类似商品的特性,因为你需要 ETH 才能使用区块链。就像你需要石油或天然气来为你的汽车提供动力或为房屋供暖一样。ETH 的不同之处在于它对可以创建的数量有上限(或以太坊基金会的远期指导),它没有限制可以销毁(或燃烧)多少。
以太坊基金会的关键是找到一个平衡点,即 ETH 消费超过 ETH 创建,但不会导致交易成本过高。毕竟,如果油价上涨太快,人们就会停止公路旅行。或者他们寻求其他旅行选择。就以太坊而言,用户可能会转向其他区块链。我们认为成本/交易会随着时间的推移而下降(由于第 2 层解决方案),但随着更多的采用和用例,交易量将会增加。由于 L2 上的交易最终在以太坊 L1 上批量结算,这应该会导致低费用但通货紧缩的代币供应——这将是两全其美的。
ETH 的商品价值很难预测。它基于对供应/需求的推测。我们基于以太坊基金会关于 ETH 抵押率和新发行的透明政策或前瞻性指导,了解供应情况。
需求取决于开发者们在做什么。当更容易使用稳定币进行支付时,当游戏很有趣并允许用户通过 NFT 拥有游戏内资产时,当世界上最大的品牌发行 NFT 并增加消费者忠诚度的体验时,当社交媒体允许用户控制他们的内容时,当钱包和 DeFi 应用程序易于使用,引入了 KYC/AML 池并为智能合约审计创建了标准时,用户就会到来。我们认为这将会发生,因为开放网络、卓越的以用户为中心的商业模式和用户控制的数据带来的好处。
价值储存/货币资产
ETH 是以太坊生态系统中的一种交换媒介,它是驱动区块链的油脂。也就是说,当一种资产被用作交换媒介时,例如法定货币,它通常不能作为一种很好的价值储存手段。然而,根据本报告中概述的 ETH 代币供需结构,我们认为市场可能会为 ETH 赋予货币溢价。
ETH 作为价值储存手段的货币溢价最终可能归结于它所实现的网络效应、新用例以及竞争性第 1 层生态系统中对区块空间的需求。让我们记住,从用户的角度来看,在区块链变得不经济之前,ETH 的价格只能涨到这么高。
关键数据点
在我们监测以太坊与其他区块链的长期生存能力时,有许多数据点需要跟踪。以下指标在此阶段提供了最多的信号:
开发者数量和开发者增长
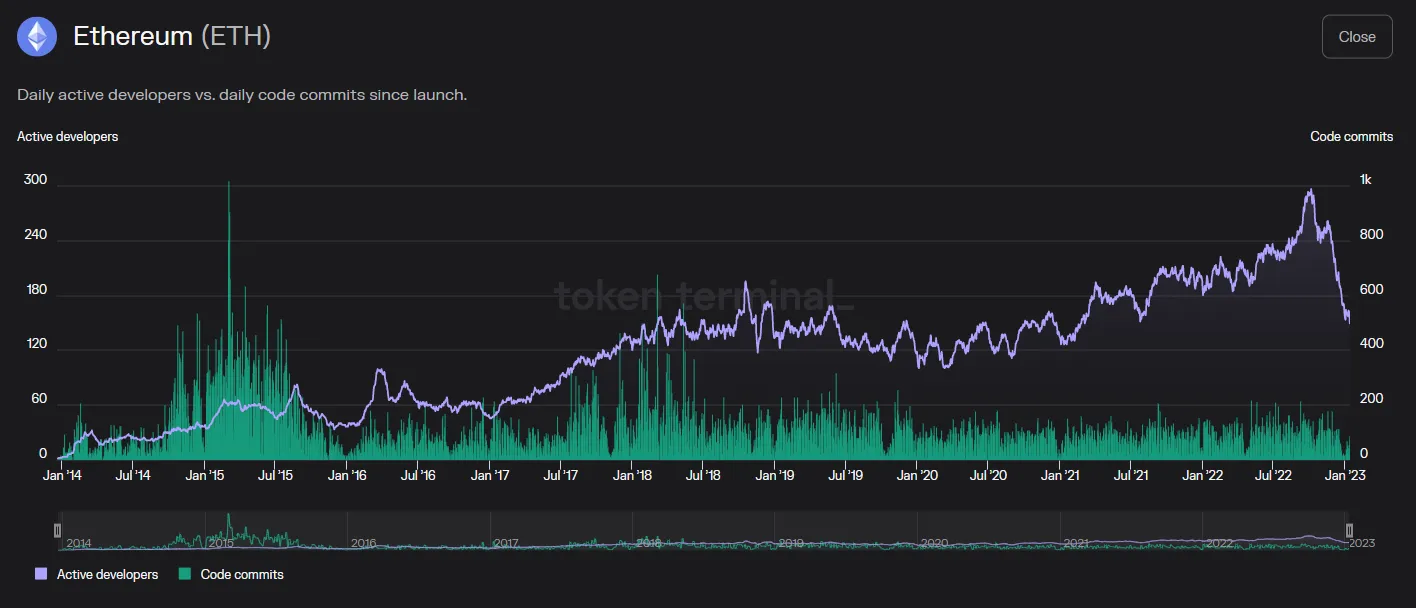
数据来源:Token Terminal
在过去 6 年中,以太坊开发人员的复合年增长率为 32% 。我们正在监测最近的下降情况,但认为这主要是季节性的。有趣的是,代码提交数年来一直持平,比早年有所下降。这是由于可组合的开源代码的力量——每个问题被解决一次,允许其他的在上面构建——有点像乐高积木相互链接。
活跃用户数量和用户增长
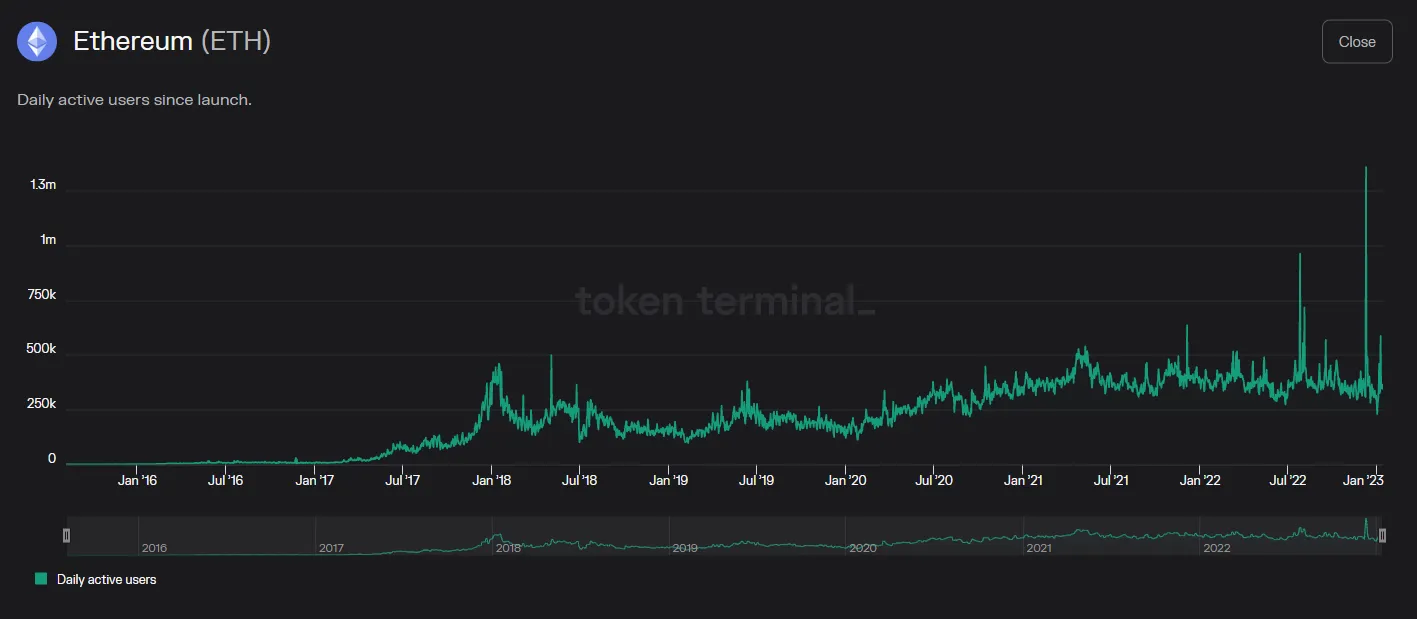
数据来源:Token Terminal
日活跃用户目前在 40 万左右,并且增长相当稳定。自 2016 年以来,用户的复合年增长率为 92.9% ,自 2017 年以来为 38% 。与 2021 年相比, 2022 年的用户数下降了约 3% 。
网络交易和交易增长
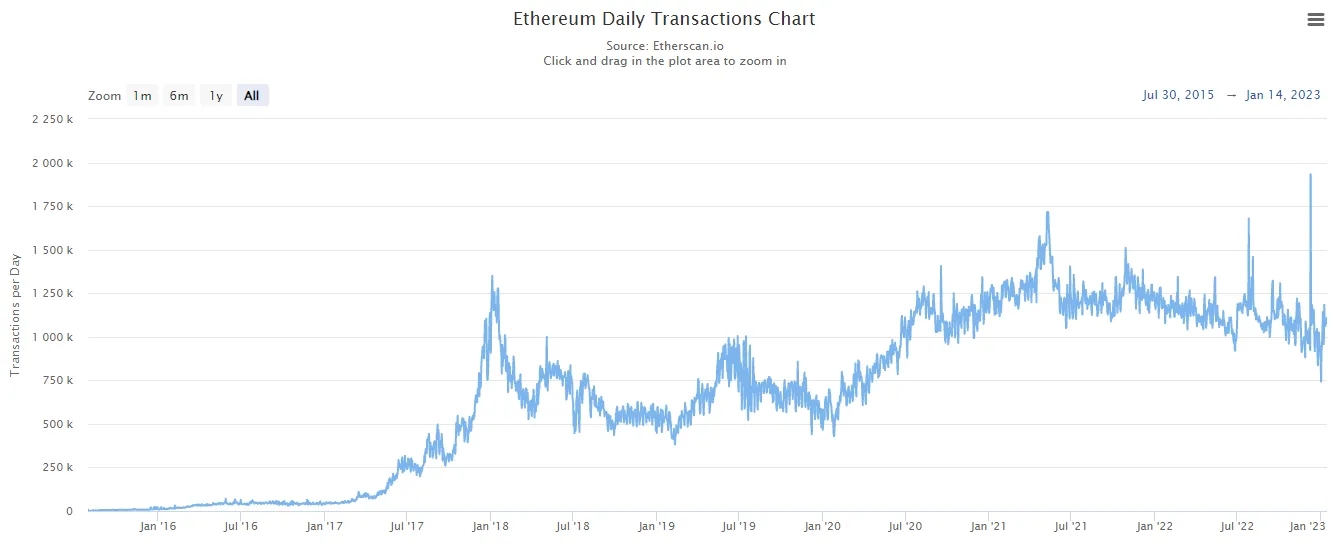
数据来源:Etherscan
尽管价格下跌,但去年的交易量仍保持良好。今年该网络下降了 12% 。话虽如此,过去 6 年的复合年增长率为 76% ,过去 5 年的复合年增长率为 32% 。随着第 2 层扩展,我们开始看到基础层的交易增长开始趋于平稳。
收入
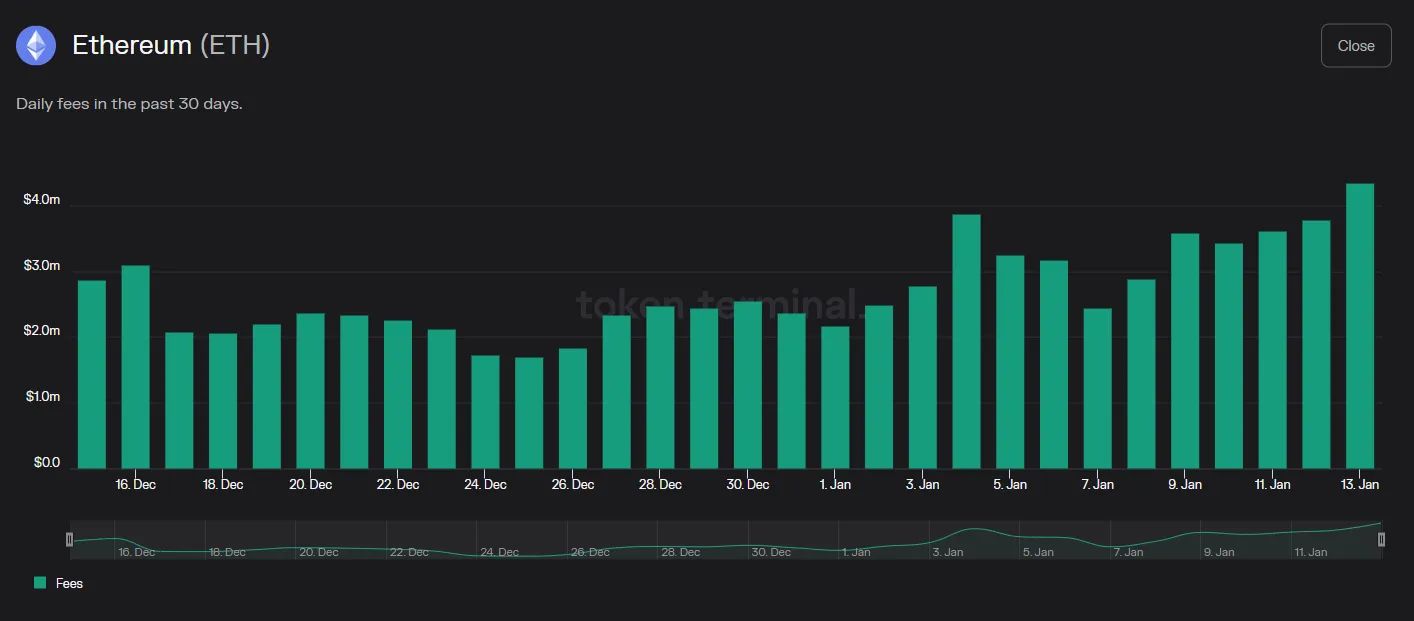
数据来源:Token Terminal
以太坊的收入数据仍然保持强劲。在过去 30 天里,该网络的日均销售额约为 260 万美元。过去 6 年的复合年增长率为 454% 。如果我们从较为活跃的 2017 年开始, 5 年期间的复合年增长率为 146% ——即使 2022 年与 2021 年相比下降了 58% 。
总价值锁定(TVL)也是我们关注的一个指标。然而,TVL 与加密资产价格挂钩并且波动很大。它也可以像我们去年在 Solana 上看到的那样被操纵。在 TVL 中,我们主要关注区块链的原生资产被锁定的数量。这大约是 ETH(DeFi + staking)的 26 %,目前 TVL 总额为 270 亿美元——比任何其他区块链高出几个数量级。
最重要的是,因为它与区块链的采用相关,仍处于早期阶段。因此,我们需要扎根于跟踪开发人员活动以及由此产生的新项目、新用例和第 2 层扩展解决方案产生的网络活动。随着网络效应的形成,我们可以通过跟踪 KPI 来预测和监控相对强度和单位经济效益。简而言之,目前以太坊是第 1 层智能合约平台中网络效应最强的。


