


Seven-stage adjustment complete, divergence emerging: How far is Bitcoin from a daily turning point | Guest Analysis


- Core View: Bitcoin's daily Wave ⅰ adjustment has run for 34 trading days, approaching the $79,000 mark. The seven-stage adjustment on the 4-hour timeframe shows clear divergence, the first turning window is about to open, and the conditions for the adjustment's conclusion are accumulating. For HYPE, whether the $75 bull-bear divide holds or is lost will directly determine the short-term direction.
- Key Elements:
- BTC entered a descending channel from the $87,399 high, with the Wave ⅰ adjustment lasting 34 trading days and a maximum drawdown of 9.36%. The previous judgment of "termination on October 15" was not validated.
- The seven-stage adjustment on the 4-hour timeframe is complete, with volume-price divergence between the exit segment and the entry segment. If the pullback does not break below endpoint 7, the probability of the daily adjustment concluding increases significantly.
- BTC's core support is at $78,000–$79,000, with resistance at $82,500–$84,500. Stay flat on the sidelines for medium-term positioning; use 30% position for short-term spread trading.
- HYPE's weekly momentum indicators show no top divergence, but the volume bar area is noticeably smaller than the previous segment, indicating volume-price divergence—the two dimensions are not in resonance.
- HYPE's $75 level was briefly pierced and quickly pulled back. Weekly volume divergence and 4-hour bottom divergence coexist. If it stabilizes, wide-range consolidation follows; if it breaks down, a test of the long-term ascending trendline is likely.
- HYPE's 4-hour endpoint 96 breaking below endpoint 94 shows limited magnitude with shrinking volume, resembling a "bear trap" pattern, suggesting rebound demand exists.
Last week, Bitcoin's rebound only reached near the upper boundary of the descending channel before falling back sharply. Our earlier judgment that "wave ⅰ of the correction ended on October 15" was not validated by the market. Currently, wave ⅰ on the daily chart has been correcting for 34 trading days, with the price approaching the $79,000 mark, and the first inflection window is about to open. On the 4-hour timeframe, the seven-segment correction has been completed, and a clear divergence has appeared between the departure segment and the entry segment, with the conditions for the correction's end accumulating.
As for HYPE, the $75 long-short dividing line withstood a brief puncture followed by a rapid pullback. Weekly volume divergence and 4-hour bottom divergence exist simultaneously, and whether this threshold holds will directly determine the short-term direction.
This week, centering on the core question of "where the correction endpoint lies," we will break down the structures of BTC and HYPE layer by layer and provide corresponding operational plans.
Summary of This Week's Core Trading Views:
• Bitcoin daily-level trend structure analysis (see Part 1 for details)
• Bitcoin hourly-level trend structure analysis (see Part 2 for details)
• Bitcoin this week's market forecast and medium/short-term trading strategies (see Part 3 for details)
• HYPE weekly-level trend structure analysis (see Part 4 for details)
• HYPE hourly-level trend structure analysis (see Part 5 for details)
• HYPE this week's market forecast and short-term trading strategies (see Part 6 for details)
1. Bitcoin Daily-Level Trend Structure Analysis
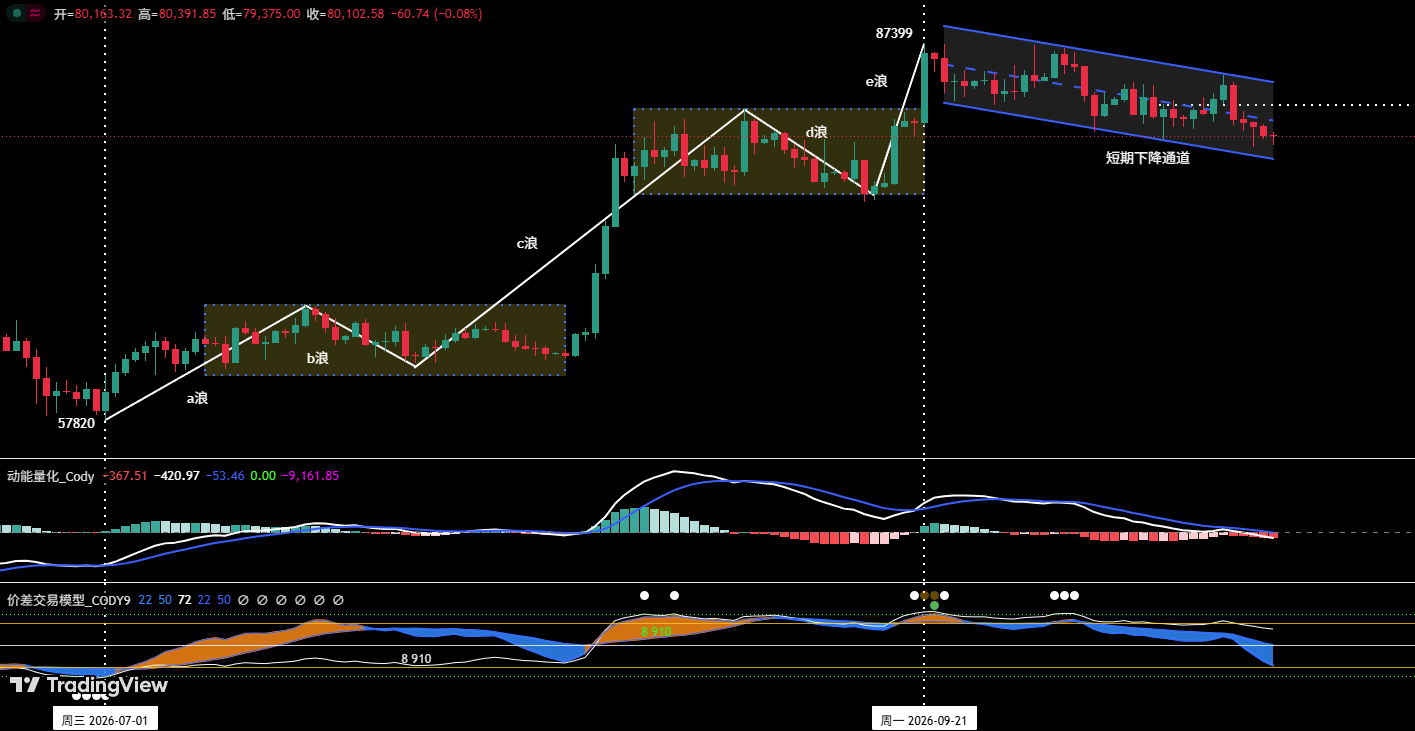
Figure 1: Bitcoin Daily Candlestick Chart
1. Composition of the Descending Channel
As shown in Figure 1, after BTC peaked at $87,399 on September 21, the price did not experience a unilateral sharp decline but was instead compressed into a descending channel, oscillating downward. The lower boundary of this channel is formed by connecting the two interim lows on September 24 and October 15; the upper boundary is constructed based on the October 5 high, drawn as a straight line parallel to the lower boundary.
2. Daily Correction Three-Wave Framework: Wave ⅰ Not Yet Complete, Wave ⅱ Not Yet Started
①. Wave ⅰ (corrective wave): September 21 to present
• Starting point: $87,399
• Has run for 34 trading days (still ongoing)
• Maximum decline within the range: 9.36%
②. In our previous issue, we predicted a high probability that wave ⅰ of the correction would end at the October 15 low. However, judging from last week's actual price action, the rebound only touched near the upper boundary of the descending channel before falling back significantly, with both the rebound duration and magnitude limited. Accordingly, we revise our judgment: wave ⅰ of the correction is expected to be not yet over, and wave ⅱ of the rebound has not yet begun.
3. Approaching the Inflection Window.
Wave ⅰ has been correcting for 34 trading days, and the price has approached the $79,000 mark. Based on the correction cycle, the first inflection window is about to open, so selling or chasing declines at this position is not advisable.
2. Bitcoin Hourly-Level Trend Structure Analysis
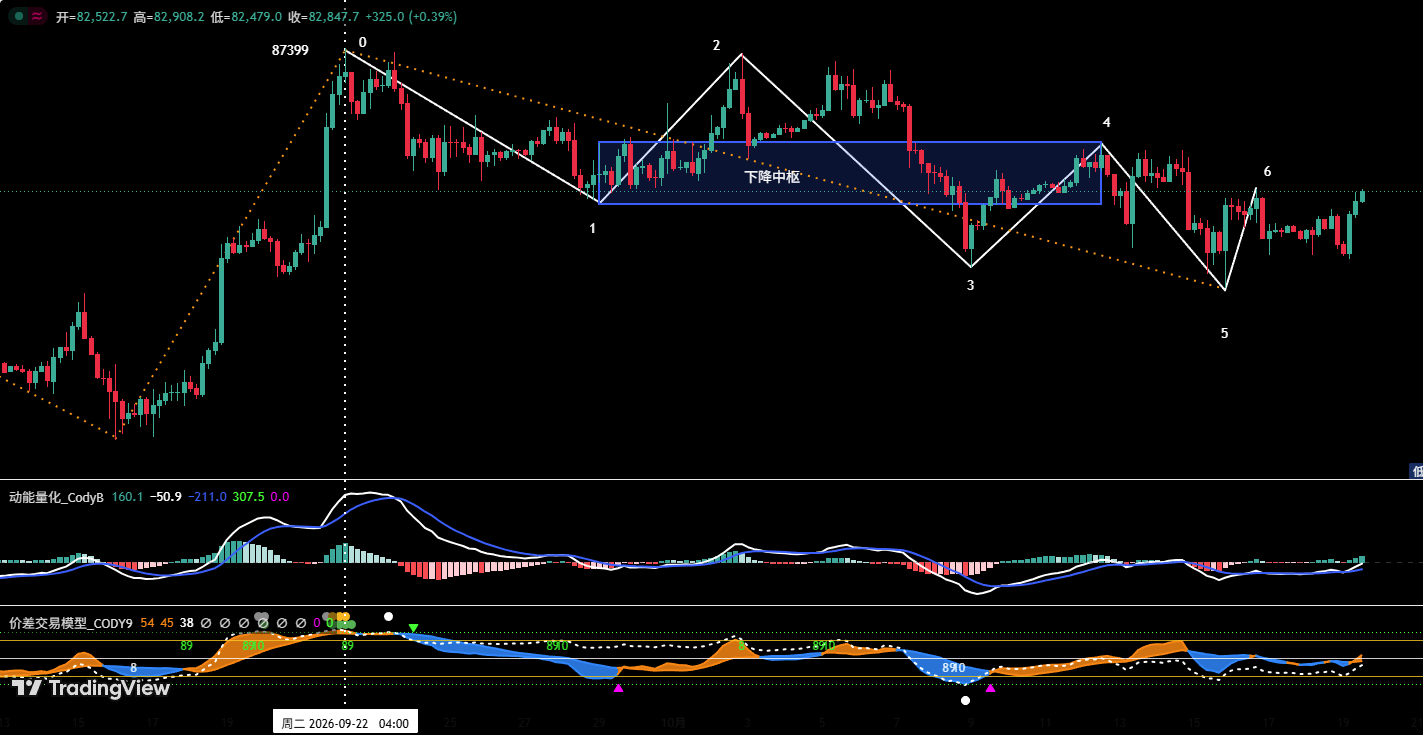
Figure 2: Bitcoin 4-Hour Candlestick Chart
As shown in Figure 2: Using the Chan Theory framework, we provide a detailed analysis of BTC's 4-hour-level trend structure:
1. Panorama of the Seven-Segment Correction
①. The daily correction that began from the September 21 high of $87,399 (Endpoint 0) can be divided on the 4-hour chart into a seven-segment correction structure from (0-1) to (6-7).
②. Construction of the Descending Pivot
• Based on the overlap of the five segments from (1-2) to (5-6), a descending pivot is formed.
• Pivot upper boundary: approximately $84,361; lower boundary: approximately $82,556
• Pivot entry segment (0-1), pivot departure segment (6-7)
2. Subsequent Scenario Projection
The market is currently running the (6-7) departure segment. Comparing it with the pivot entry segment, a clear divergence is present in the volume-price relationship. Accordingly, if the departure segment terminates and subsequent pullbacks do not break below Endpoint 7, the probability that the daily correction ends at Endpoint 7 is significant. Otherwise, the market may continue to probe lower.
3. Termination Expectation
In the Chan Theory framework, after a five-segment correction is completed, the probability of a relatively strong rebound is typically very high. The current price has already formed a seven-segment structure, indicating a more thorough correction and more complete release of selling pressure, which implies a higher probability of the correction ending.
3. Bitcoin This Week's Market Forecast and Trading Strategies
1. BTC This Week's Market Trend Forecast
Core view for this week: Focus on the termination point of the daily correction.
2. Core Resistance Levels
• First resistance zone: $82,500–$84,500 area (previous important level)
• Second resistance zone: $87,500 area (previous important level)
3. Core Support Levels
• First support level: $78,000–$79,000 area (previous important support level)
• Second support level: $74,500–$76,000 area (previous important support level)
• Third support level: $69,100–$70,500 area (previous important support level)
4. This Week's Trading Strategies (Excluding the Impact of Breaking News)
①. Medium-term strategy:
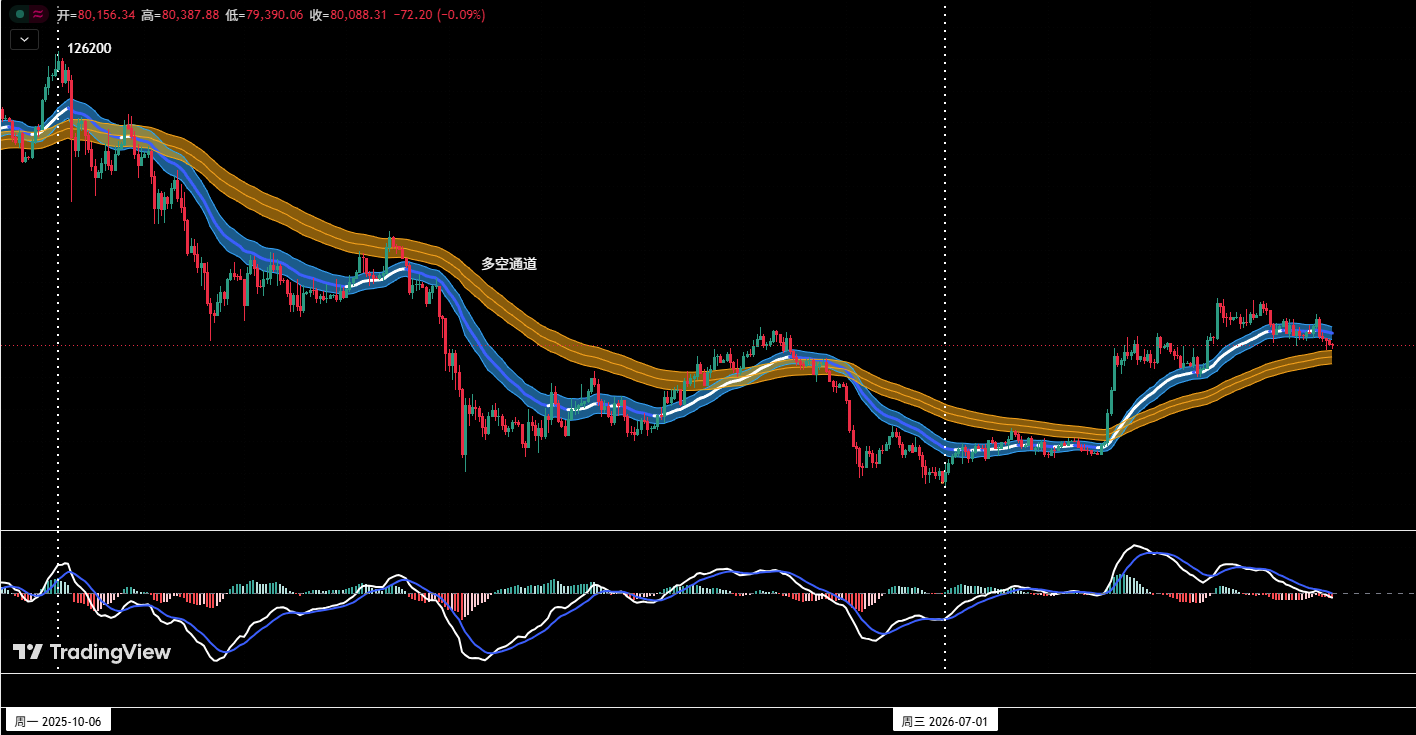
Figure 3: Bitcoin _ Daily Candlestick Chart: (Position Monitoring Model)
Position Monitoring Model: As shown in Figure 3, the price has broken through the "long-short channel"; it is currently in the pullback confirmation phase. Therefore, the current medium-term strategy is to stay in cash and observe.
②. Short-term strategy: Use 30% of position, set stop-loss points, and seek "price spread" opportunities based on support and resistance levels. (Use 30-minute/60-minute as the operating timeframe).
③. In short-term operations, to dynamically adapt to complex market developments, we have prepared A/B operational plans in advance.
• Plan A: Light long position in strong support zone.
• Entry: If this week the price corrects to the $78,000–$79,000 area and shows a clear stabilization pattern, with the quantitative model simultaneously issuing a bottom signal, a light long position may be established, with position size controlled within 30%.
• Risk control: Set an initial stop-loss level.
• Exit: When the rebound reaches near important resistance levels combined with model signals, positions may be closed in batches to take profits.
• Plan B: Light short position at strong resistance.
• Entry: If the price rises to the $85,500–$86,500 area and shows a clear rejection and pullback pattern, with the quantitative model simultaneously issuing a top signal, a light short position may be established, with position size controlled within 30%.
• Risk control: Set an initial stop-loss level.
• Exit: When the price corrects to near important support levels combined with model signals, positions may be closed in batches to take profits.
4. HYPE Weekly-Level Trend Structure Analysis
In the previous issue, this column explicitly pointed out: The core observation point for HYPE last week was the outcome of the battle between bulls and bears near $75. If this level is effectively lost, the current correction may escalate to the weekly level; not only would the correction duration be extended, but it could also probe the long-term uptrend line support.
After a week of trading, what changes have occurred in the market? Why can $75 become the long-short dividing line? With these questions in mind, we will now conduct an in-depth analysis from the weekly level.
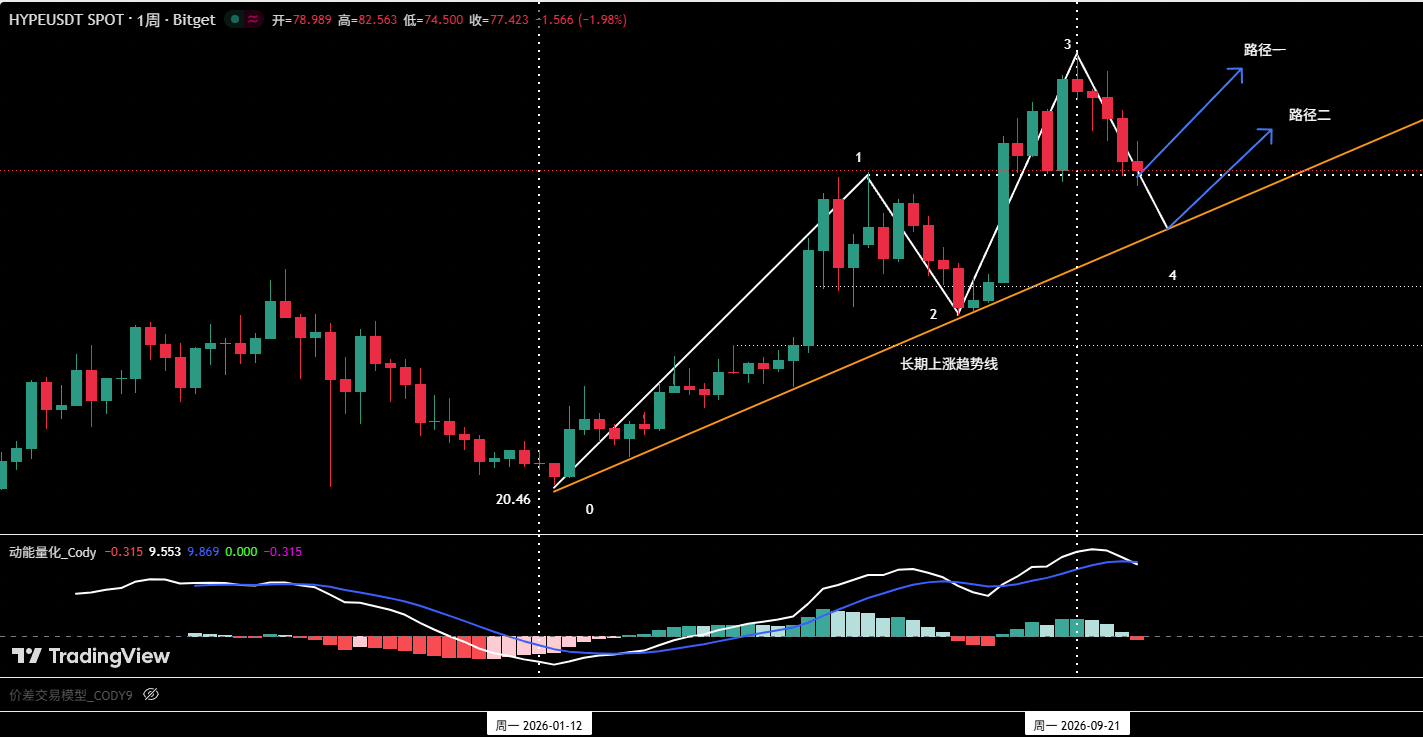
Figure 4: HYPE Weekly Candlestick Chart
As shown in Figure 4, the uptrend that HYPE launched from the January 21 low of $20.46 presents a clear wave structure on the weekly level: (0-1), (1-2), (2-3) form a three-segment advance, and the current price is running in the (3-4) correction segment.
1. No Divergence in the Momentum Dimension
The self-built "Momentum Quantitative Model" shows that, comparing Endpoint 3 with Endpoint 1, the price has made a new high, and the momentum indicator line (white line) in the model has also simultaneously made a new high, indicating that in this dimension, momentum has not formed a top divergence signal.
2. Divergence in the Volume Dimension
Similarly, comparing Endpoint 3 with Endpoint 1, the price made a new high, but the model shows that the volume bars (green bars) corresponding to the 2-3 advance segment are significantly smaller in area than those of the 0-1 segment, meaning this upward move exhibits volume divergence in the volume-price relationship.
3. Trend Scenario Projection
Overall, the momentum and volume dimensions have not formed a resonance. Currently, Endpoint 4 has once again corrected to the key support level of $75, and this level is also the position of the previous high (Endpoint 1). Two subsequent scenarios exist:
Path 1 (Stabilization): If the price effectively stabilizes near $75, HYPE will most likely maintain a broad consolidation pattern above $75 in the short term, regrouping upward volume through consolidation.
Path 2 (Breakdown): If the $75 support level is effectively lost, meaning the price breaks below the strong support at Endpoint 1, the price may probe the long-term uptrend line (the extension of the line connecting Endpoint 0 and Endpoint 2), and this correction cycle is expected to last at least two more weeks.
In summary, bulls and bears will battle fiercely at this position, and whether this threshold holds will directly determine the short-term price trend.
5. HYPE Hourly-Level Trend Structure Analysis
Following the previous issue's weekly review projection of two operating modes for HYPE at the hourly level, the current trend happens to be at the intersection of the two paths, making it worthwhile to push the analysis one step further.
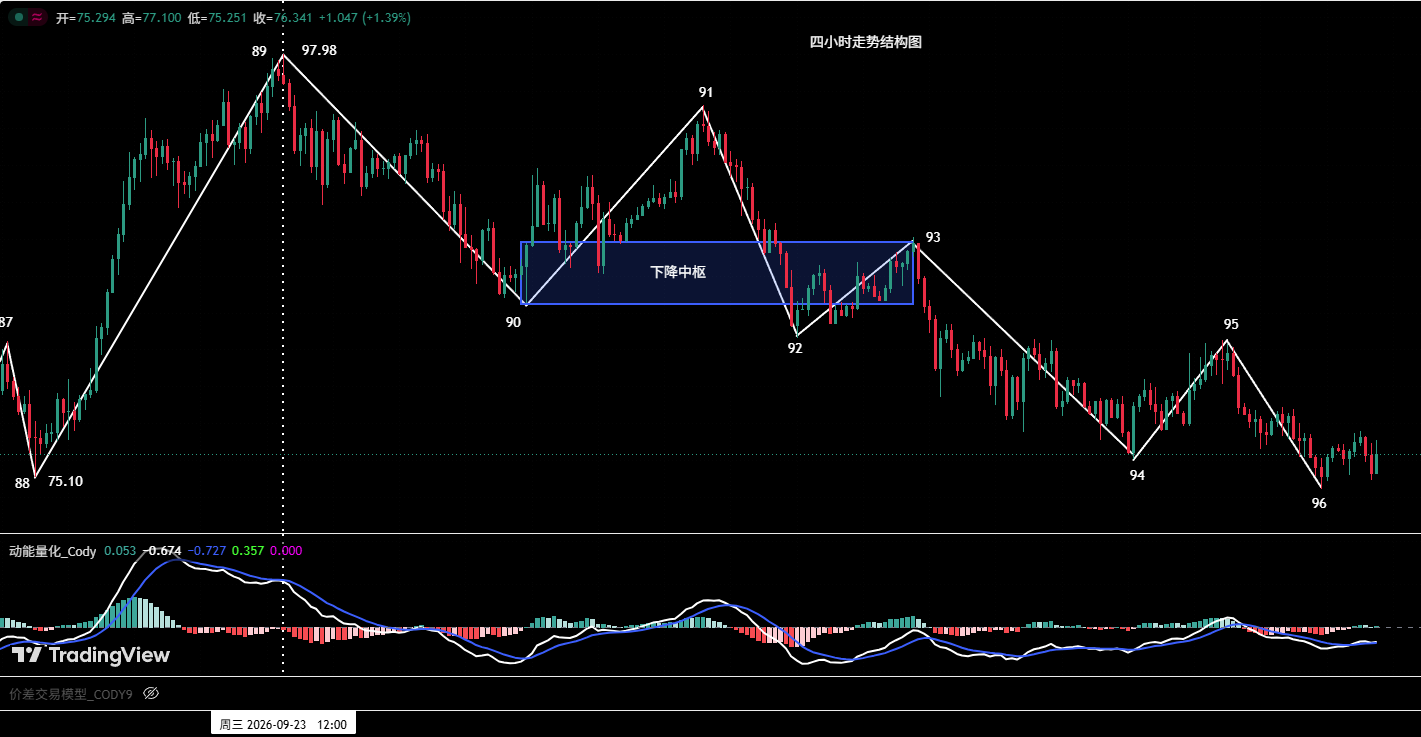
Figure 5: HYPE 4-Hour Candlestick Chart
1. Structural Positioning: What Signal Does Endpoint 96 Breaking Below Endpoint 94 Convey
As shown in Figure 5, after the pivot departure segment (93-94) terminated near $76, the rebound of (94-95) can be regarded as a pullback toward the pivot, while the pullback confirmation segment of (95-96) broke below Endpoint 94. This structure itself carries two implications:
First, the correction since $97.98 has not yet ended, and the hourly level remains in an extension of the downward structure. Second, the extent by which Endpoint 96 broke below Endpoint 94 is extremely limited and is accompanied by shrinking volume, making it closer to a "bear trap" pattern.
2. Divergence Is Not a Conclusion, Only a Tilt in Probability
Comparing the (93-94) segment with the (95-96) segment, bottom divergence and bottom divergence in volume appear simultaneously in momentum and volume, making it the most noteworthy signal at present. This means there is demand for a decent rebound at the 4-hour level, the quality of which depends on whether the rebound segment can recover the overhead supply-dense zone with volume and whether the pullback confirmation phase no longer breaks below Endpoint 96.
3. Treat $75 as the Long-Short Dividing Line, Not a Standalone Support
The significance of $75 goes beyond "strong support." Last week the price briefly punctured it and quickly pulled back, indicating fierce competition between active buyers and stop-loss sellers at this position, so it should be regarded as the long-short dividing line.
• If, after a short-term rebound, the price retests the $75 support without breaking it and a stabilization signal appears on the 4-hour level, the correction can be considered terminated.
• If the 4-hour closing price effectively breaks below the $75 support level, the correction structure will continue, and lower support levels will be sought.
6. HYPE This Week's Market Forecast and Short-Term Trading Strategies
1. HYPE This Week's Market Trend Forecast
①. Core Resistance Levels:
• First resistance level: $80–$82 area
• Second resistance level: $88–$90 area
• Third resistance level: $95–$100 area
②. Core Support Levels:
• First support level: $75–$77 area (strong support)
• Second support level: $68–$70 area
③. Core View for This Week:
This week, focus on whether the price can produce a strong rebound with the help of the $75 strong support, and whether subsequent pullbacks no longer break below last week's low.
2. HYPE This Week's Short-Term Trading Strategies
①. Light long on stabilization (without breaking strong support):
If the price stabilizes above $75 and continues to rise, those in cash may consider a light long position, with position size controlled within 30%, targeting the first resistance level of $80–$82 area, with a stop-loss set and strictly executed.
②. Stay on the sidelines after a breakdown:
If the price effectively breaks below the $75 support level, the strong support is lost, and it is recommended to stay in cash and observe temporarily, waiting for a clear direction before acting.
7. Special Notes
1. When opening a position: Immediately set an initial stop-loss level.
2. When profit reaches 1%: Move the stop-loss to the entry cost price (breakeven point) to ensure capital safety.
3. When profit reaches 2%: Move the stop-loss to the 1% profit level.
4. Continuous tracking: Thereafter, for every additional 1% profit in the price, move the stop-loss up by 1% accordingly, dynamically protecting and locking in gains.
Financial markets change rapidly, and all market analyses and trading strategies require dynamic adjustment. All views, analytical models, and trading strategies involved in this article are derived from personal technical analysis and are for personal trading journal purposes only. They do not constitute any investment advice or basis for action. Markets carry risks, and investment requires caution. Please do not make decisions based on this article.





