






ETF Outflows Continue, Strategy's Weekly Buying Hits Lowest Level of the Year: MSCI Decision This Week


- Key Takeaway: After Bitcoin fell below $81,000 on October 13 and rebounded above $83,000, the bounce was driven by leveraged liquidations and short covering, while ETF outflows persisted and institutional spot demand has yet to show confirmed re-entry. The real test lies in whether MSCI removes Strategy from its indices.
- Key Elements:
- During Asian trading hours, Bitcoin dropped below $81,000 before recovering above $83,000. Meanwhile, South Korea's KOSPI closed down 5.46%, with Samsung Electronics and SK Hynix plunging roughly 7% to 10% intraday.
- Approximately $800 million was liquidated across the crypto market within 24 hours, with longs accounting for about 86%. Open interest declined in tandem, consistent with deleveraging rather than fresh capital inflows.
- From October 5 to 9, U.S. spot Bitcoin ETFs saw net outflows of approximately $681 million—the largest weekly outflow since June—with FBTC leading losses at about $380 million.
- Strategy purchased only 250 BTC during the same period (average price $86,194), while spending approximately $192.4 million on preferred stock STRC buybacks—nearly nine times the amount spent on Bitcoin purchases.
- Saylor stated that Bitcoin has bottomed slightly below $60,000 and will return above $100,000, projecting 20% to 30% annualized growth over the coming years.
- MSCI's screening results for "non-operating companies" will be announced no later than October 16. Strategy, Metaplanet, and others could be removed from global investable indices. JPMorgan previously estimated approximately $2.8 billion in potential passive selling pressure.
- September CPI (released October 14) and the MSCI result serve as tests of the upper and lower boundaries of the $81,000–$84,000 range, with actual passive selling not taking effect until the November index rebalancing.
TL;DR
- During the Asian session on October 13, Bitcoin fell below $81,000 before recovering above $83,000. Over the same period, South Korea's KOSPI closed down 5.46%, with Samsung Electronics and SK Hynix plunging roughly 7% to 10% intraday. The crypto market saw about $800 million in liquidations over 24 hours, with longs accounting for roughly 86%.
- The rebound was primarily driven by leverage unwinding and short covering. U.S. spot Bitcoin ETFs saw about $681 million in net outflows the prior week, and Strategy bought only 250 BTC that same week, indicating institutional spot demand has yet to confirm a return.
- Saylor said Bitcoin has bottomed just below $60,000 and will return above $100,000, while MSCI's "non-operating company" screening results are due no later than October 16 and could remove Strategy from global indexes.
- Related tickers: BTC, MSTR, IBIT/FBTC
During the Asian trading session on October 13, Bitcoin briefly fell below $81,000 before recovering above $83,000 within hours. Over the same period, South Korea's KOSPI closed down 5.46%, with Samsung Electronics and SK Hynix plunging roughly 7% and 9% to 10% intraday, respectively. The crypto market was quick to frame this divergence between price and Asian tech stocks as a "decoupling."
But zooming out over a week, the picture is not so consistent. From October 5 to 9, U.S. spot Bitcoin ETFs recorded about $681 million in cumulative net outflows, the largest weekly outflow since June, with Fidelity's FBTC leading the decline at about $380 million. Prices held firm between $83,000 and $84,000, yet capital was exiting over the same period.
Net outflows from spot ETFs mean holders are redeeming shares for cash, forcing funds to sell their Bitcoin to meet redemptions. It is the yardstick for determining whether price and capital flows are in sync. Perpetual contract liquidations, by contrast, occur when leveraged accounts betting on direction have insufficient margin and are forcibly closed out, amplifying price volatility without bringing in new spot buying.
A Rebound Fueled by Liquidation and Short Covering
In the early hours of October 13, Bitcoin first fell below $81,000, while the KOSPI plunged on a valuation pullback in chip stocks. Contract data showed roughly $800 million in liquidations over the surrounding 24 hours, with longs accounting for about 86%, while open interest (total contract positions) declined in tandem—consistent with deleveraging rather than an influx of new capital.
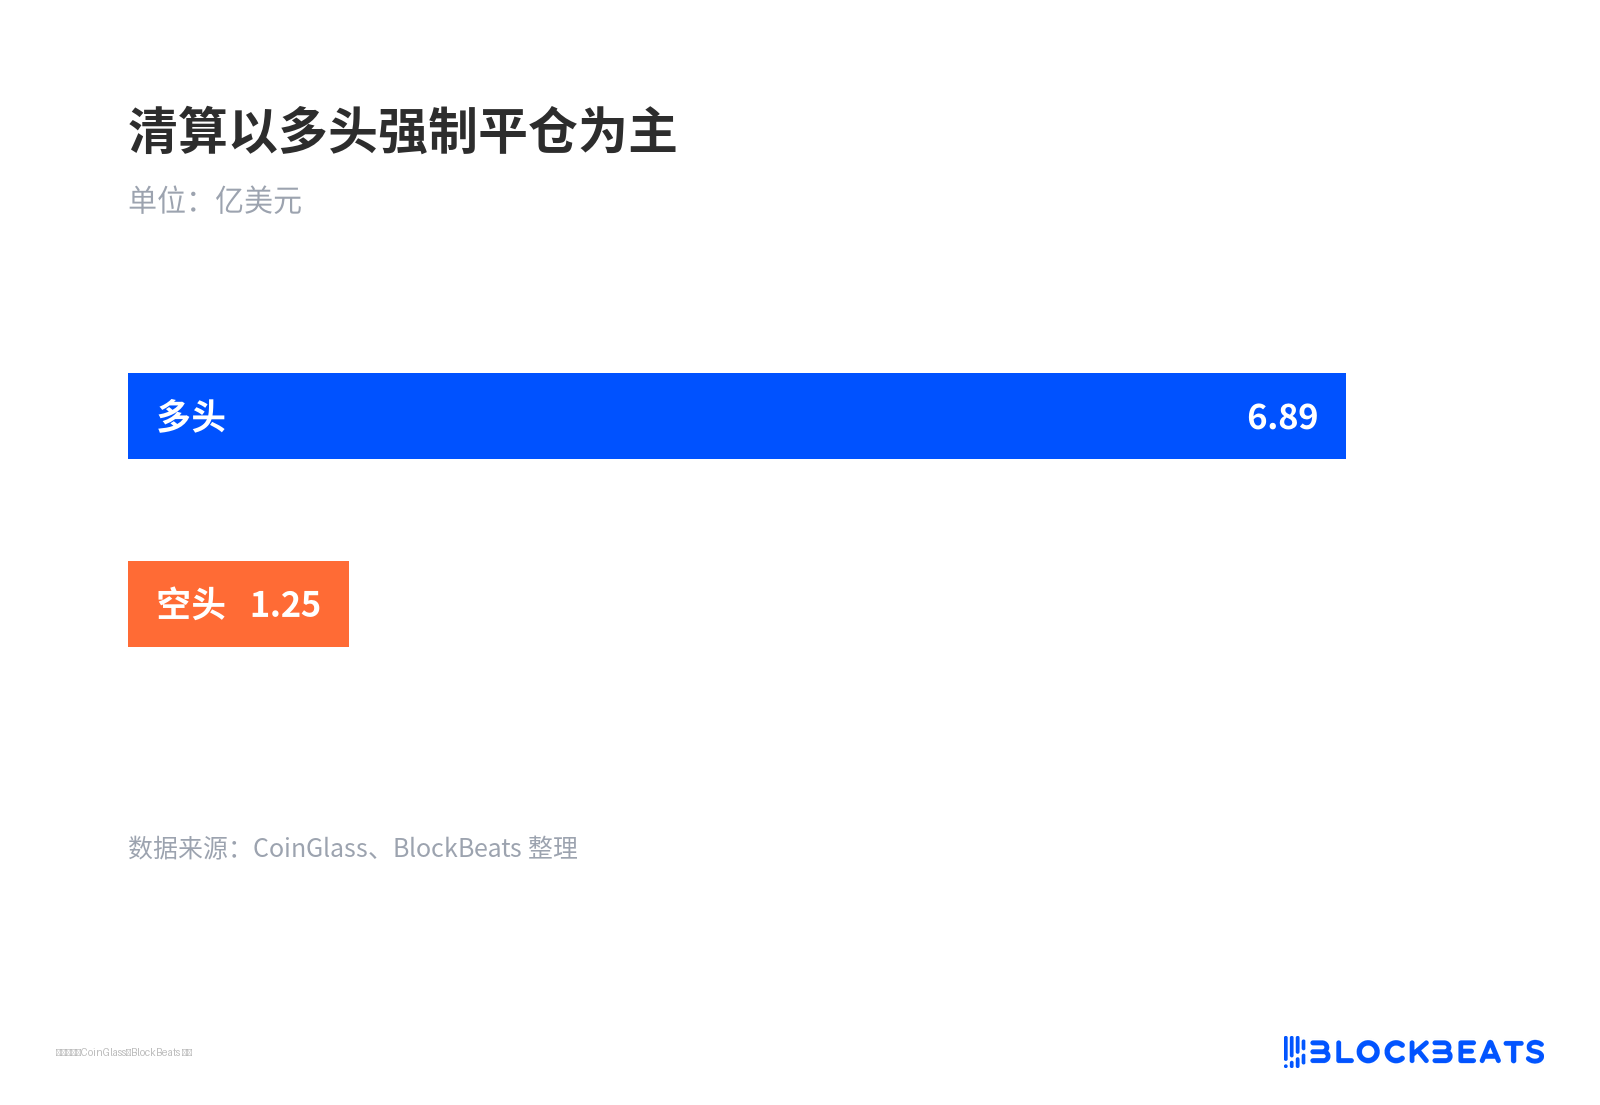
Liquidations dominated by forced long closures
The liquidation structure itself explains the source of the rebound. Those washed out were primarily longs betting on further gains, and after prices bottomed, short covering drove the rally. This explains why Korean stocks kept falling while Bitcoin recovered above $83,000. In the same window, tokenized perpetual contracts linked to chip stocks also saw large liquidations.
In other words, there was indeed short-term buying support near $81,000, but that support came from passive liquidation of leveraged accounts, not new institutional buying in the spot market. A single Asian morning rebound is not enough to support a "permanent decoupling" conclusion.
ETF Outflows and Strategy's Symbolic Purchase
The capital flow evidence is more honest than price. After $681 million in net outflows last week, another roughly $65.4 million flowed out on October 12, with a mixed day of about $110 million appearing only on October 13. Weekly outflows cannot be directly juxtaposed with single-day prices as cause and effect, but the direction is consistent—the institutional pipeline is still bleeding.
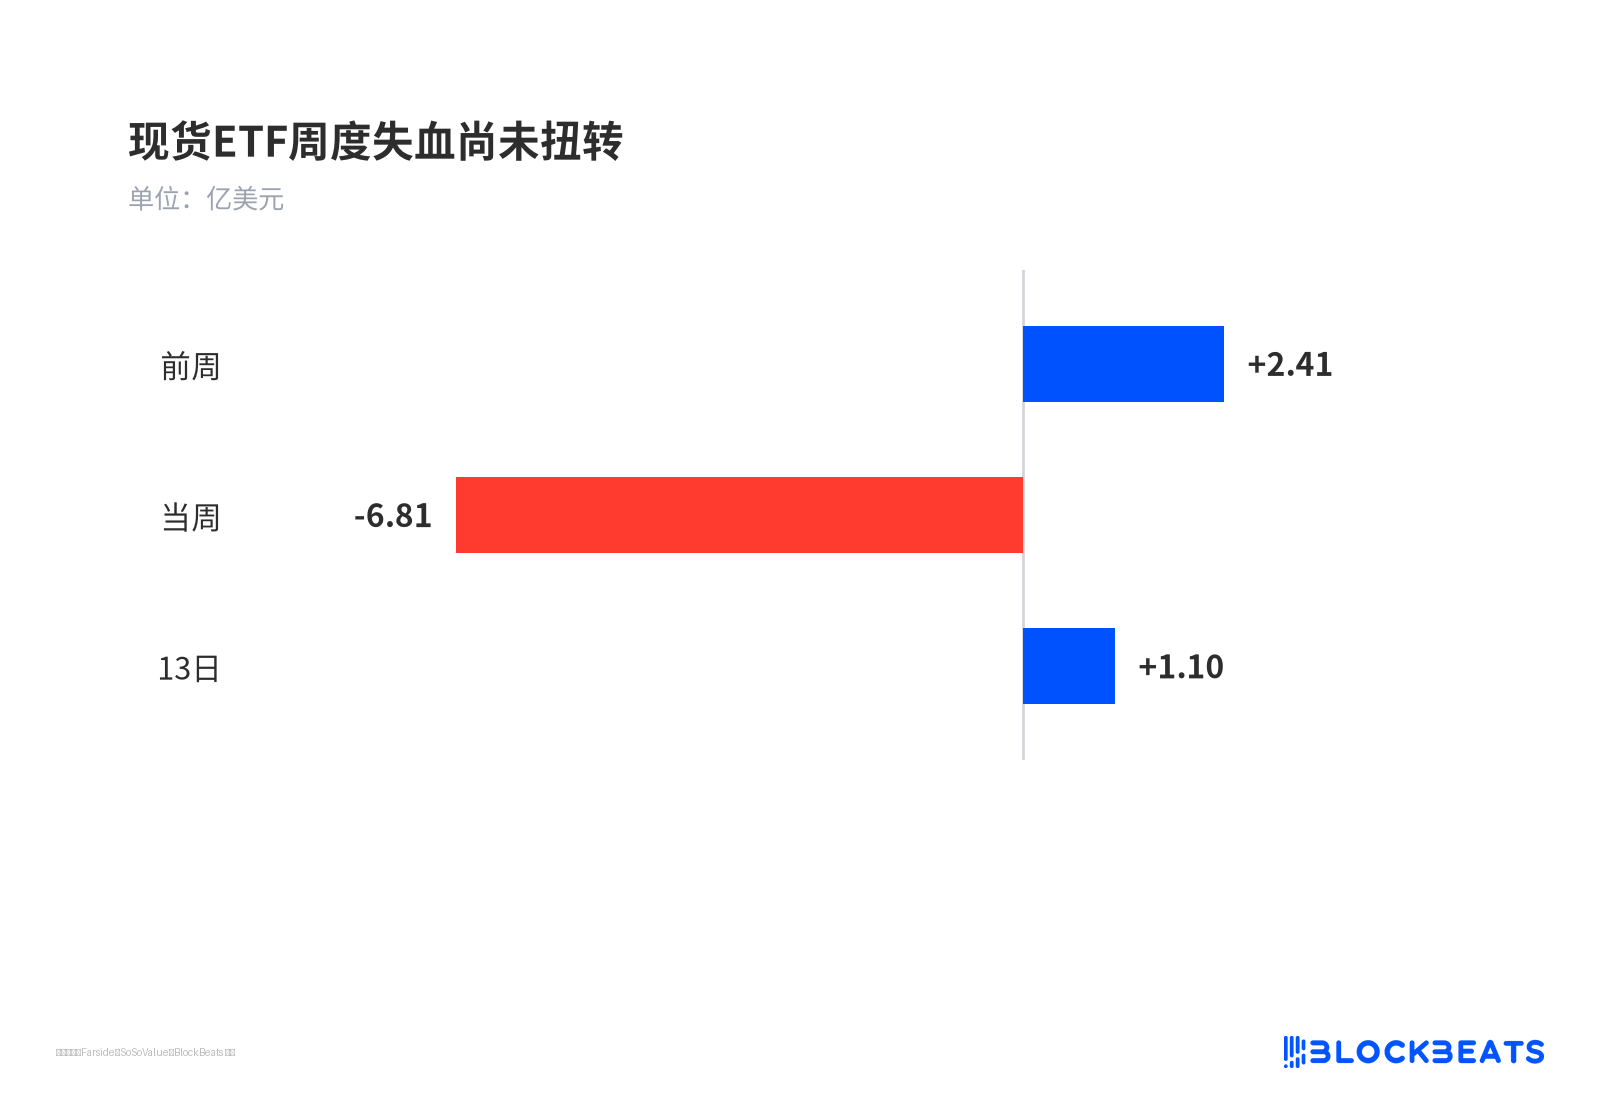
Weekly spot ETF outflows have yet to reverse
Strategy's behavior also deserves a closer look. The company's October 12 filing showed it purchased only 250 BTC from October 5 to 11, at an average price of $86,194, for a total outlay of about $21.5 million. Over the same period, it spent approximately $192.4 million on repurchasing its STRC preferred stock—nearly nine times the amount spent on buying Bitcoin.
That 250 BTC represents one of Strategy's smallest weekly purchases this year, far below its previous single-week buys.
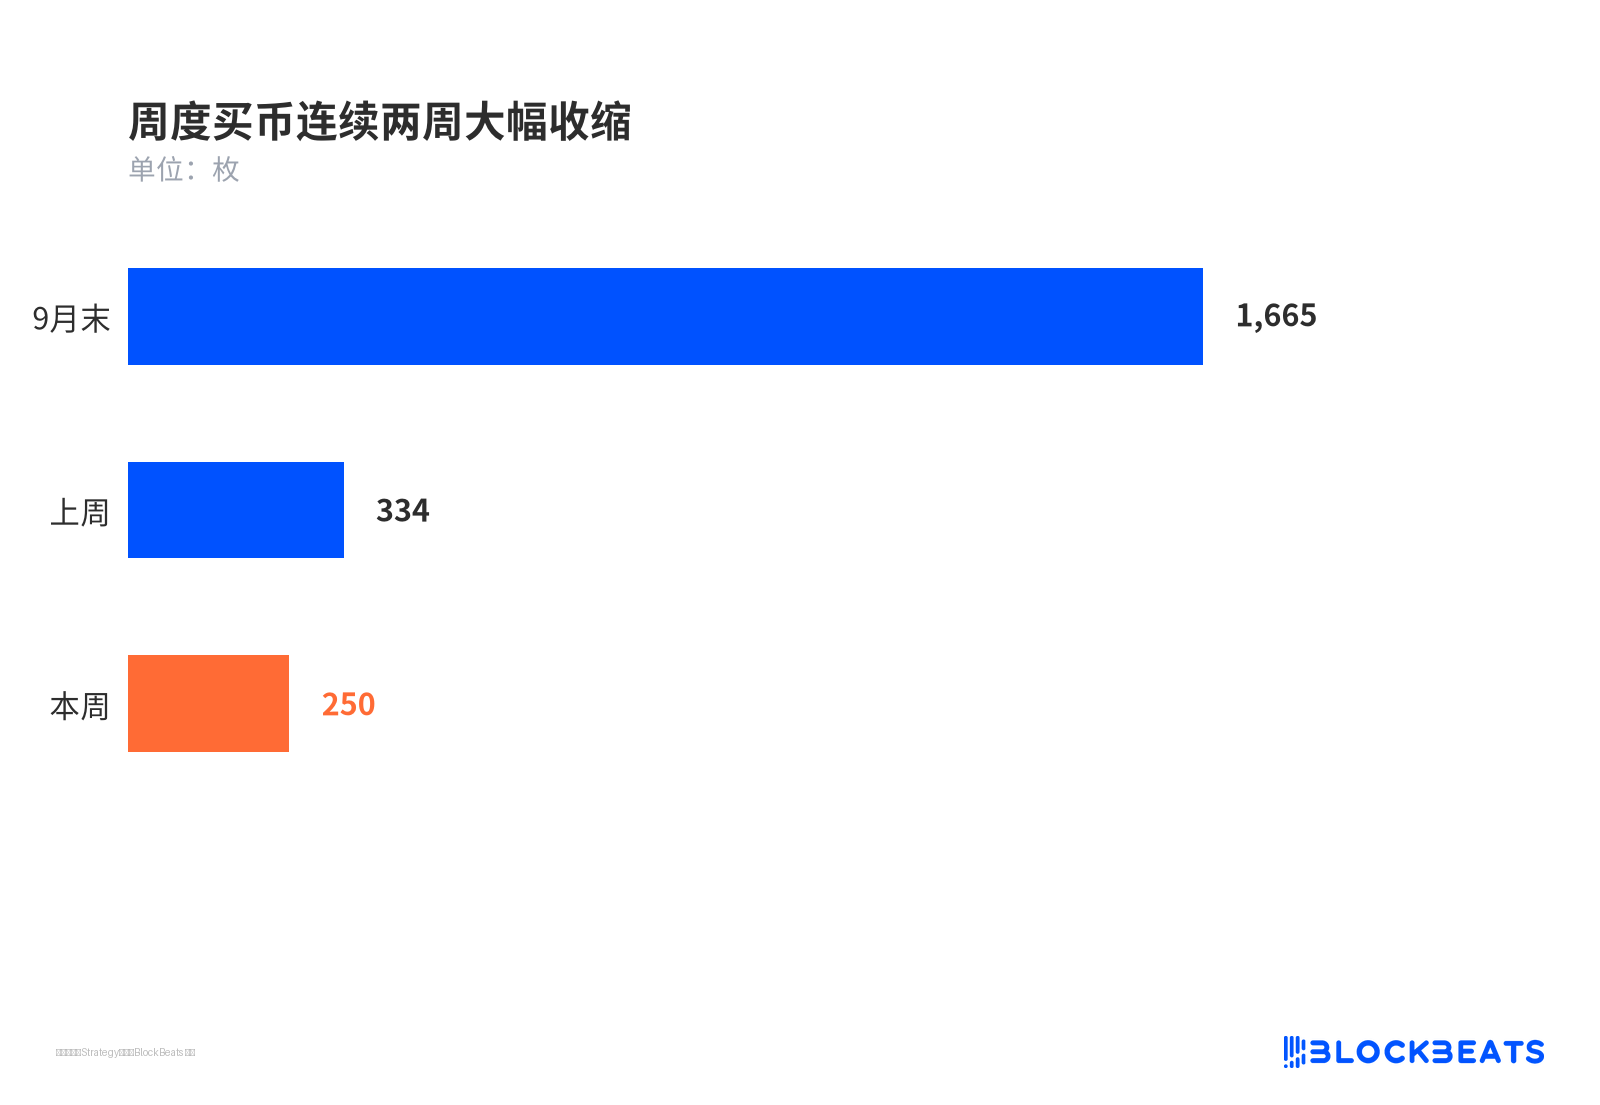
Weekly Bitcoin purchases contracted sharply for two consecutive weeks
It looks more like a narrative signal to sustain the "always buying" story than capital evidence of a cycle turning point. Reading it as "aggressively buying the dip" would overstate the fundamental support for this rebound.
Saylor's $100K Target and MSCI's Removal Risk
On October 13, Saylor said in a Bloomberg interview at DC Fintech Week that the Bitcoin bear market ended just below $60,000, that it will return above $100,000, and gave a 20% to 30% annualized growth forecast over the coming years. As the head of the largest corporate Bitcoin holder, he is the market's most steadfast bull.
On the other side stands MSCI. The index provider launched a consultation in August on "non-operating companies," with feedback closing on September 30 and results expected no later than October 16. Under its simulated criteria, companies whose assets are primarily financial are closer to investment vehicles than operating companies, and Strategy, Metaplanet, and others could be removed from global investable indexes.
The weight of this rule lies in passive capital. Once removed, funds tracking MSCI can only sell under their mandates, not add. JPMorgan estimated in 2025 that Strategy faced roughly $2.8 billion in potential passive selling pressure. Saylor calls the $80,000 zone the start of a new bull market, but MSCI's questionnaire frames the same level as an index identity crisis.
CPI and MSCI Determine the Range's Boundaries
Bitcoin remains stuck in a $81,000 to $84,000 range, well below last year's all-time high. The rebound occurred below the market's estimated institutional cost basis and after a redemption week—a position that makes it inherently vulnerable.
The September CPI release on October 14 is the first test of the range's upper bound. Analysts expect roughly 3.6% to 3.7% year-over-year, up from 3.4% in August. If the core reading comes in cool, short covering could push prices toward $86,000 to $87,000. If it runs hot, $81,000 or even $80,000 will be tested again.
Even if MSCI's results land on October 16, passive selling pressure won't actually be executed until the November index rebalancing.

Removal-driven selling pressure won't hit until November
What needs watching is whether MSTR's premium to Bitcoin narrows and whether subsequent daily ETF flows can turn consistently positive. These two signals will determine whether this rebound is a mechanical repair within the range or capital flows realigning with the bulls.





