






Gold Price Dips to $4,066: It's Not a Failure of Safe-Haven Demand—It's That the Cost of Holding Treasuries Won


- Key Takeaway: Gold's sharp decline on October 7 was not caused by the Treasury auction—the selling occurred before the auction results were released. What truly weighed on gold prices was the rising cost of holding non-yielding assets as Treasury yields hit new highs, while the better-than-expected 10-year Treasury auction actually became the day's only bullish turning point for gold.
- Key Elements:
- Gold surged to $4,170 during Asian trading before declining, touching $4,066 in New York hours—the lowest since August 5—and closing at $4,110.68, down 1.28%; the sell-off came before the auction results were announced.
- The 10-year Treasury yield broke above 5.34% intraday, the highest since April 2002, while the 30-year touched 5.73%, exerting an arithmetic-level holding cost pressure on non-yielding gold.
- The $39 billion 10-year Treasury auction cleared at a high yield of 5.300%, below the pre-auction market level of 5.317%, with a bid-to-cover ratio of 2.77 far exceeding the average of 2.54; gold recovered to 4,110 in late trading after the results were released.
- Primary dealers were allotted only 2.5%, the lowest since the financial crisis, while indirect bidders received 80.3%, above the 72.4% average of the past 10 auctions, indicating genuine allocation demand rather than market-maker backstopping.
- The FOMC minutes confirmed a 25bp rate hike, with most officials seeing potentially one more hike this year, but the market had already fully priced this in—it was a confirmation of old expectations rather than a new bearish factor.
- The dollar index rose to 102.3, breaking through its year-to-date high, while China's central bank continued to increase its gold holdings to 77.47 million ounces by end-September, but this could hardly reverse the upward direction of real interest rates.
On October 7, spot gold opened higher at $4,163.97, rallied to $4,170 in Asian trading before trending lower all the way down, dipping to $4,066 during the New York session — the lowest since August 5 — and closing at $4,110.68, down 1.28%. On the same day, a $39 billion 10-year Treasury auction cleared at 5.300% with a bid-to-cover ratio of 2.77, well above the average of 2.54 across the past six auctions.
Many reports lump these two events together: "gold fell, Treasuries were snapped up." But when you lay out the sequence of events, this narrative has an obvious flaw: gold's selloff occurred before the auction results were announced. First the drop, then the stabilization — the sequence itself carries more information than the price moves.
1. Getting the Causal Order Straight First

The day's price action unfolded in this order: gold rallied then pulled back in Asian trading; in early New York hours, the 10-year Treasury yield briefly broke above 5.34%, hitting its highest since April 2002, while the 30-year touched 5.73%, and gold simultaneously fell below $4,100 and dipped to $4,066; in the afternoon, auction results were released, with the clearing yield of 5.300% actually coming in below the pre-auction market level of 5.317%, yields retreated from their highs, and gold recovered to $4,110 by the close; in Asian trading on October 8, gold further rebounded to around $4,130.
The conclusion is straightforward: the only event that day that was clearly bullish for gold was precisely the auction that was suspected of "crashing gold." Blaming gold's decline on the auction is mistaking the turning point for the starting point.
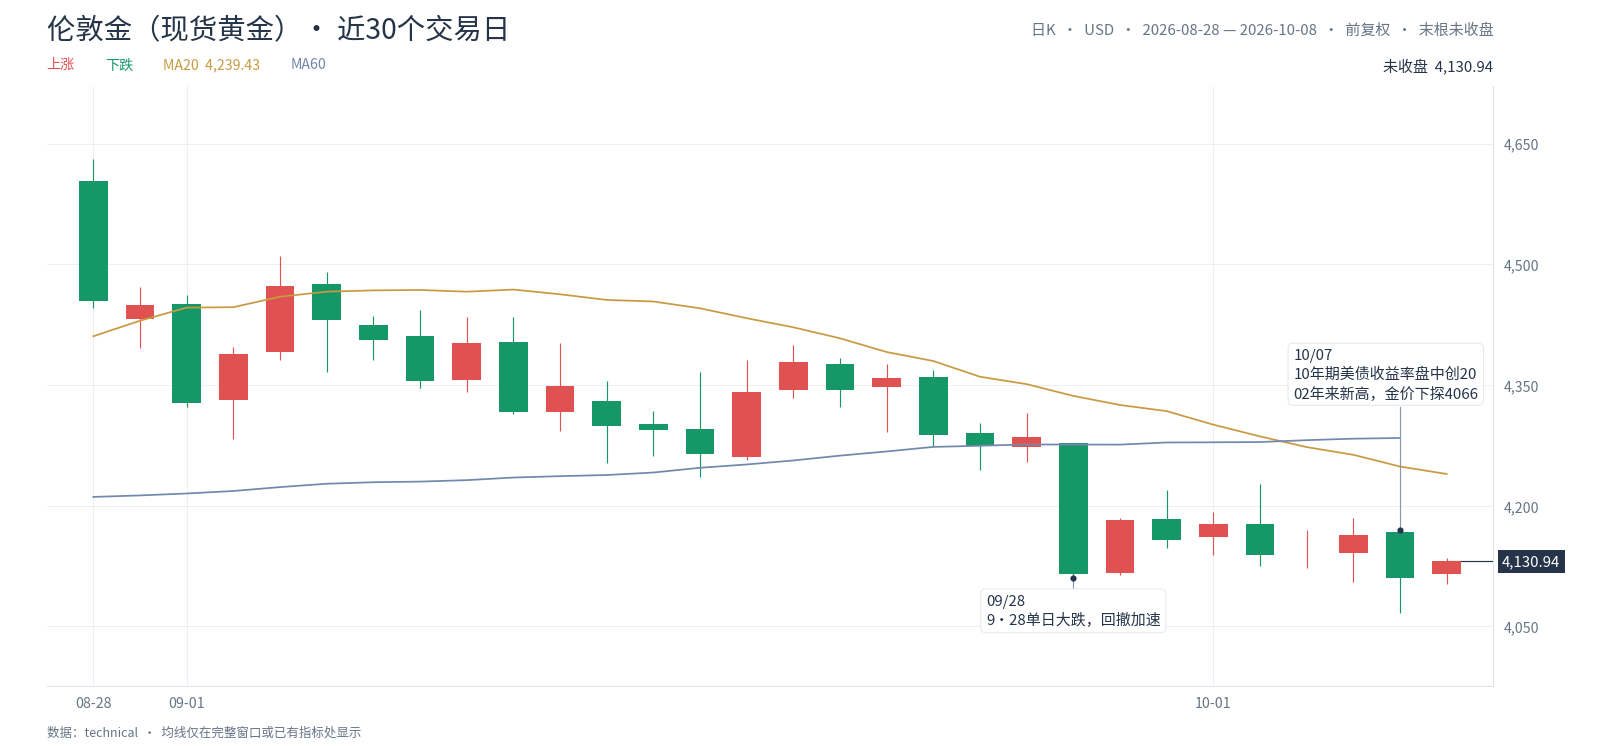 Another often-omitted context: this wasn't a one-day affair. Gold was still in the $4,630–$4,700 range at the end of August, and after a sharp single-day drop on September 28, the pullback accelerated. By the October 7 close, it had retraced about 12% from its 60-day high. The dip to $4,066 merely marked a formal break below the August 5 low. The single-day plunge is the result; two weeks of grinding decline is the process.
2. The Minutes Confirm Old Expectations, Not a New Bearish Catalyst
The FOMC meeting of September 15–16 was held three weeks ago, but the minutes were released in the afternoon of October 7, Eastern Time, so they were last night's information — just with very limited incremental content.
The minutes confirmed three things: the 25 basis point rate hike was approved unanimously; most officials believed another hike was possible before year-end; no signal was given on whether to act in October. Before the minutes were released, futures markets priced only about 19% for October, while a December hike was already fully priced in. The market had long since factored in "one more hike this year" — the minutes merely put already-priced expectations on paper. Attributing last night's volatility to "hawkish minutes" is treating old expectations as a new bearish catalyst.
What was genuinely new was another point: some participants listed AI infrastructure buildout as one of the upside risks to medium-term inflation. AI capital expenditure entering central bank inflation discussions is a shift worth tracking separately — but it wasn't the starting point of that day's gold decline. Yields hitting new highs, with oil prices and inflation expectations, most likely ranked ahead of the minutes as contributors.
3. Gold Lost an Arithmetic Contest
Rather than saying the safe-haven logic failed, it's more accurate to say gold was defeated by its own carrying cost.
The 10-year Treasury yield to maturity has exceeded 5.3%, while gold itself generates no interest. The implicit cost of holding gold for a year is that 5.3% minus inflation. This isn't a sentiment issue — it's an arithmetic one.
The second source of pressure came from the dollar: the dollar index rose to around 102.3, breaking above its year-to-date high, making dollar-denominated gold more expensive for non-US buyers. As for rising Middle East tensions and Brent crude topping $100 — by the textbook, this should boost safe-haven buying, but it didn't this time, because the transmission channel of higher oil prices runs through inflation expectations and long-end rates, which is a net negative for gold. When the textbook fails, it's usually because the weight of the rate variable has overwhelmed everything else.
4. The Number More Worth Remembering Than the Gold Price Is 2.5%
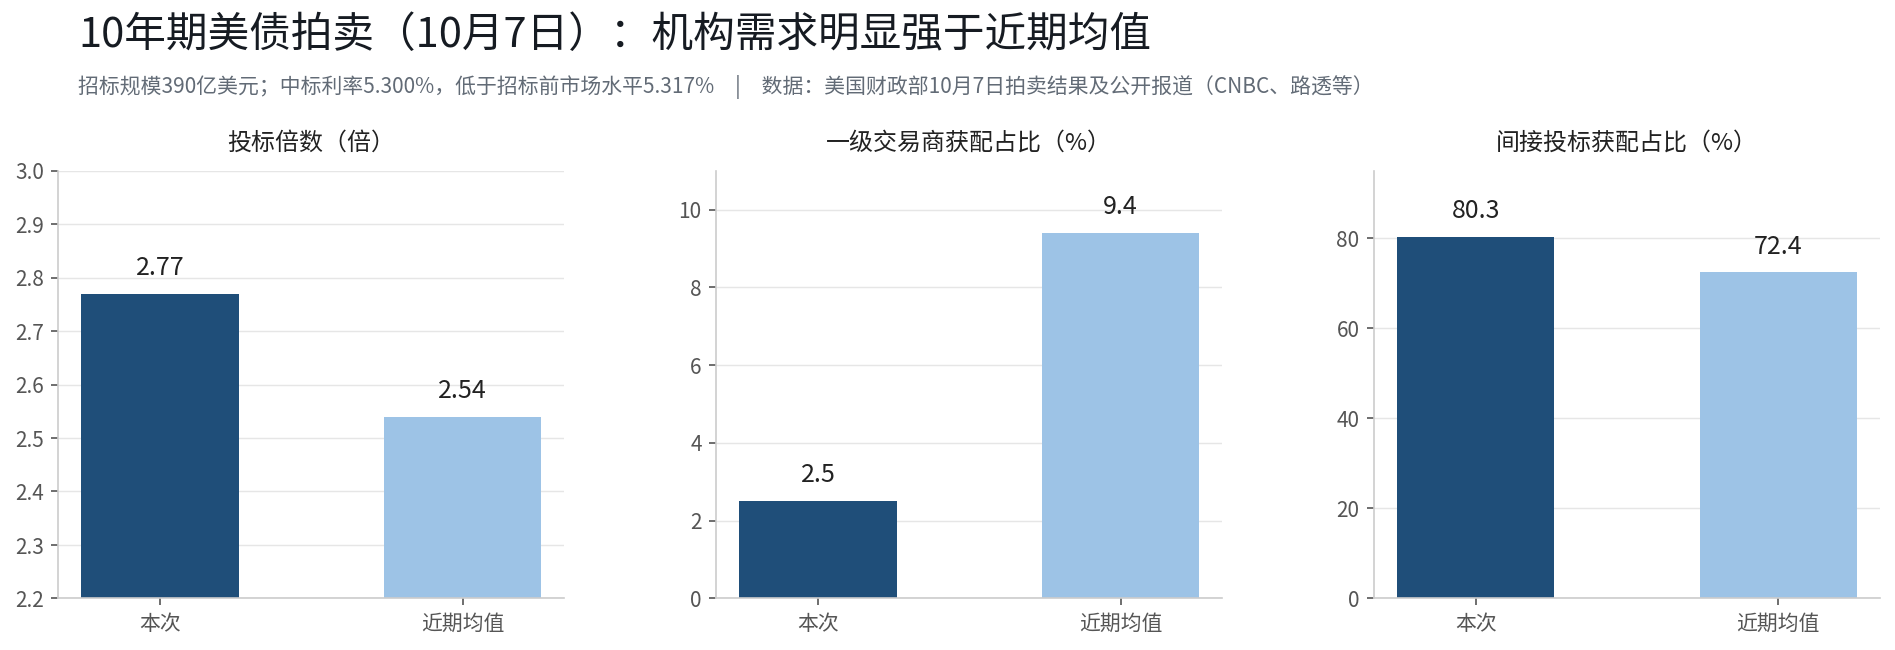
In the auction data, the 2.77 bid-to-cover ratio indicates "strong demand," but the 2.5% figure reveals where that demand came from: primary dealers took only 2.5% of the issuance, the lowest since the financial crisis — the absorption wasn't backstopped by market makers but taken directly by real allocators; indirect bidders (including global central banks and other institutions) were allotted 80.3%, notably above the average of 72.4% across the past 10 auctions.
These funds make decisions on a different logic than trading desks: pensions, insurers, and sovereign funds have discipline around yields — if it's high enough, they'll allocate. For them, 5.3% is a calculable return not seen in years.
This article's judgment is: if this buying persists, the peak in long-end yields may be closer than currently priced; if it was merely a one-off auction anomaly, then the pressure on gold and growth stocks has not yet lifted. The observation point to distinguish between the two is the $22 billion 30-year auction on October 8 — the issuance yield could be the highest since 2000.
5. What to Watch Next
First, the 30-year auction results. A strong 10-year and weak 30-year would suggest long-end demand is only a localized repair; only if both are strong can we talk about "allocators returning."
Second, the $4,000 threshold. It's the next round-number support; according to public reports, China's central bank has increased its gold holdings for consecutive months to 77.47 million ounces as of end-September, with official buying providing support below, but it cannot change the direction of rising real rates.
Third, the December rate path. Before the minutes were released, December was already fully priced in; going forward, any inflation data beat could push yields to retest prior highs; conversely, any sign of cooling inflation would simultaneously improve the situation for both gold and long-duration bonds.
Final Thoughts
Reading last night as either "gold crashed" or "Treasuries stabilized" is incomplete. What actually happened yesterday was: yields pushed gold to its lowest since August during the session, and then a demand-beating auction pushed it back. The gold price is the thermometer; the auction is the adjustment mechanism. In the coming days, watching the 30-year auction and CPI will be more useful than watching gold's daily candlestick chart.
Data Notes
Data as of October 8, 2026. Sources: public market data, US Department of the Treasury, Federal Reserve, CNBC, Reuters, etc.
- Gold: London gold closed at 4,110.68 on 10/7 (-1.28%), intraday low of 4,066.36; rebounded to around 4,130 in Asian trading on 10/8.
- Treasuries: 10Y broke above 5.34% intraday (highest since April 2002, range 5.34%–5.37%), 30Y hit 5.728% intraday, 10Y closed near 5.3%.
- 10Y auction: $39 billion, cleared at 5.300% (expected 5.317%); bid-to-cover 2.77 (average 2.54); primary dealers 2.5% (lowest since the financial crisis); indirect 80.3%.
- FOMC minutes: September 15–16 meeting, released 10/7; 25bp hike to 3.75%–4.00%; most officials see possibly one more hike this year; AI infrastructure listed as an inflation risk. Pre-meeting futures priced October at about 19%, December fully priced.
- Other: dollar index around 102.3, breaking above its year-to-date high; China's central bank gold reserves at 77.47 million ounces as of end-September, increasing for consecutive months.
Disclaimer: This content is for general informational and market commentary purposes only, based on publicly available information as of the time stated herein, and relevant market data, expectations, and probabilities may change with market conditions. The views and investment strategies of third-party institutions, analysts, or other persons cited herein represent only the views of the relevant third parties at specific times and do not represent the views or recommendations of BIT. This article does not constitute investment advice, investment research, an offer, solicitation, or recommendation of any securities, investment products, or trading strategies, and should not be relied upon as the basis for any investment decision. Financial markets involve risk; securities prices and market performance may fluctuate, and historical performance and past market trends do not represent or guarantee future results. Investors should independently assess relevant risks based on their own circumstances and seek professional advice when needed.





