






US Treasury Yield Storm Hits Wall Street: Nasdaq Falls Nearly 1%, Semiconductors Bloodied, Chinese ADRs Defy the Trend


- Key Takeaways: US Treasury yields surged to multi-year highs, pushing stocks, bonds, and gold down in tandem, rendering traditional asset diversification ineffective. The market is concentrated on pricing in "higher rates for longer" expectations, with high-valuation tech stocks bearing the heaviest pressure.
- Key Elements:
- The 10-year US Treasury yield closed at 5.23% and the 30-year at 5.53%, hitting new highs since 2007 and 2004 respectively, dragging down the valuation anchor for high-valuation assets.
- Stocks, bonds, and gold — three traditional hedge assets — all fell simultaneously, while Brent crude briefly broke above $100 intraday, reinforcing inflation and rate hike expectations.
- Semiconductors were the hardest hit: ARM dropped over 8%, Qualcomm fell more than 7%; Nvidia bucked the trend with gains thanks to a new $150 billion buyback authorization.
- Gold plunged 4%, with gold mining stocks suffering broad sell-offs; Chinese ADRs defied the trend, with the Nasdaq Golden Dragon China Index rising 1.12%.
- JPMorgan turned bullish ahead of the nonfarm payrolls report, arguing that tech giants' valuations have fallen to 10-year lows; Goldman Sachs warned of "strong indices, weak confidence," with market breadth dropping to its lowest since the dot-com bubble.
- The market expects September nonfarm payrolls to show roughly 100,000 new jobs, with a roughly 66% probability of a 25 basis point Fed rate hike in October. The direction of US Treasury yields remains the core variable.
On September 28, the three major U.S. stock indices all closed lower, but what truly dominated the day's market action was not stocks themselves—it was the bond market. The 10-year Treasury yield closed at 5.23%, and the 30-year at 5.53%, each marking their highest levels since 2007 and 2004 respectively, directly depressing the valuation anchor for high-valuation tech stocks. More alarming still, stocks, bonds, and gold all fell simultaneously that day, weakening the usual diversification effect, with market concerns over "higher rates for longer" becoming one of the important factors shaping the day's market action. This also explains why growth stocks such as Meta, ARM, and Qualcomm fell far more than the broader market, while Nvidia's buyback boost could only keep it insulated.
Data at a Glance
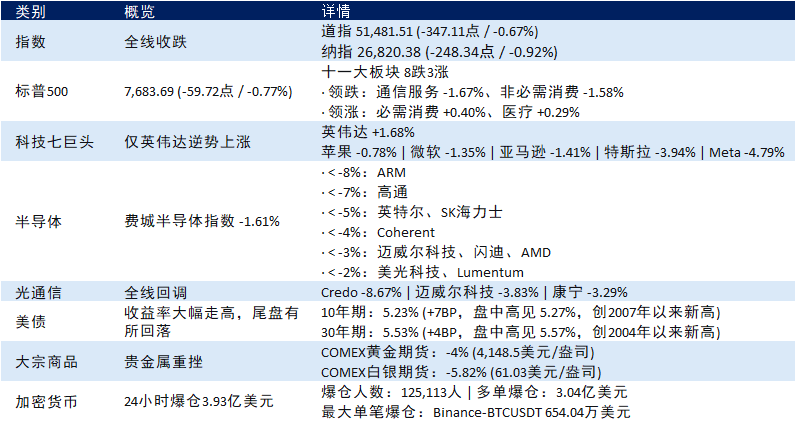
Stocks, bonds, and gold fall together as the market prices in "higher rates for longer"
The most notable outcome of the day was not how much oil prices rose, nor how much a particular sector fell, but rather the simultaneous decline of three traditionally mutually hedged asset classes: stocks, bonds, and gold. The traditional hedging relationship has temporarily broken down, and the market is now concentrated on pricing in a single variable: higher rates for longer.
The starting point of this pricing chain was the U.S.-Iran tensions pushing oil prices higher, with Brent crude breaking above $100 intraday, which in turn reinforced inflation and rate hike expectations, pushing the 10-year Treasury yield to a multi-year high of 5.23%. Ultimately, the valuation anchor for high-valuation tech stocks was revised downward, with growth stocks such as Meta, ARM, and Qualcomm falling far more than the broader market; gold, as a non-yielding asset, saw its opportunity cost of holding rise alongside real interest rates, with gold prices plunging 4%; bond prices also came under pressure as yields surged. Oil prices and geopolitical conflict were the catalysts, but what truly dominated the day's market action was the repricing of all risk assets after Treasury yields hit multi-year highs.
A reminder from Nick Twidale, Chief Market Analyst at AT Global Markets, in a client note is worth remembering: "Geopolitical developments could keep volatility elevated in global markets."
Sector Breakdown: Semiconductors Hit Hardest, Nvidia the Lone Exception
The semiconductor sector saw the most concentrated selling. The Philadelphia Semiconductor Index closed down 1.61%, but individual stock declines far exceeded the index performance. ARM fell over 8%, Qualcomm dropped more than 7%, Intel and SK Hynix each fell over 5%, and memory and optical communication concept stocks were almost universally hit.
Nvidia's counter-trend rally was the most prominent individual stock event of the day. The company announced an additional $150 billion increase in its stock buyback authorization, bringing its total buyback program to $235 billion. This news somewhat offset the pressure on its valuation from the high interest rate environment and also reflected management's assessment of the current share price level.
MongoDB plunged over 18%, its worst single-day performance since March. This was one of the largest individual stock declines of the day, but it was driven by company-specific factors and had relatively low correlation with the macro interest rate environment.
Gold mining stocks tumbled across the board. AngloGold fell 6.34%, Agnico Eagle dropped 5.35%, Royal Gold declined 4.82%, Newmont fell 4.41%, Barrick Gold dropped 4.17%, and Kinross Gold fell 3.77%. The sharp drop in gold prices directly transmitted to mining companies' profit expectations.
Chinese ADRs Buck the Trend
Against the backdrop of an overall weak U.S. market, Chinese ADRs rose against the trend, with the Nasdaq Golden Dragon China Index closing up 1.12% at 5,751.39 points.
Among popular Chinese ADRs, Moxiang Intelligent rose over 16%, NetEase gained nearly 5%, BOSS Zhipin rose over 4%, KE Holdings gained over 3%, Huazhu Group rose over 3%, Zai Lab gained nearly 3%, and Li Auto rose nearly 2%. Kingsoft Cloud fell over 5%, Hesai Technology dropped over 4%, and GDS Holdings declined over 3%.
Chinese ADRs showed some divergence from major U.S. tech stocks that day, indicating that different markets and sectors respond differently to rising interest rates. In addition to Treasury yields, their performance may also be influenced by multiple factors including individual stock fundamentals, valuations, market sentiment, and capital flows.
Institutional Views: JPMorgan Turns Bullish Ahead of Nonfarm Payrolls, Goldman Warns of "Strong Index, Weak Confidence"
JPMorgan's trading desk on Monday raised its U.S. equity stance from tactically neutral to bullish, citing stronger-than-expected economic activity, sustained consumer resilience, robust corporate earnings growth, and expectations that bond yields may stabilize. Global Market Intelligence Head Andrew Tyler said in a client note that volatile oil prices trending lower and stabilizing yields are improving the risk-reward ratio, and the team abandoned its previous cautious stance ahead of Friday's nonfarm payrolls data release.
JPMorgan strategist Mislav Matejka noted in a report the same day that the valuations of large-cap tech stocks, represented by the Magnificent Seven, have fallen to a 10-year low, with the price-to-earnings premium of hyperscalers relative to the S&P 500 compressing to more than one standard deviation below the low end, and the de-rating process is largely nearing its end. The firm maintained its overweight position on semiconductors while remaining relatively cautious on the software sector. However, JPMorgan also made clear that the tech sector is unlikely to return to its previous extreme dominance.
Goldman Sachs offered an observation from a different angle: U.S. equities are currently showing a "strong index, weak confidence" pattern. The S&P 500 has gained 14% year-to-date, but Goldman's U.S. equity sentiment indicator has dropped to -0.9, matching its March low. The median S&P 500 constituent is 16% below its own 52-week high, and market breadth indicators have fallen to their lowest level since the dot-com bubble era. Goldman believes this divergence means that if uncertainties around interest rates and economic growth subside, there is room for both broad market gains and a rebound in lagging stocks.
What to Watch Next
The direction of Treasury yields remains the most critical variable for U.S. equities. Whether the 10-year can hold above 5.2% and whether the 30-year will continue to break above 5.5% will determine whether the valuation anchor for high-valuation assets needs further downward revision.
This week, the U.S. September nonfarm payrolls report is due for release, with the market expecting approximately 100,000 new jobs, down from the previous 160,000, and the unemployment rate expected to rise from 4.1% to 4.2%. Current market pricing puts the probability of a 25-basis-point Fed rate hike in October at approximately 66%. If the data comes in notably strong, it could reinforce rate hike expectations and put further upward pressure on yields; if the data is weak, it could somewhat ease rate pressure. JPMorgan's adjustment of its view ahead of the nonfarm payrolls release was mainly based on its assessment of economic activity, consumer resilience, corporate earnings, and bond yield trends.
On oil prices, Trump stated that U.S.-Iran negotiating representatives have exchanged information through mediators but did not disclose specific details, only saying "we will win" and "things will be clear soon." Any change in the Middle East situation could trigger a new round of energy price fluctuations, which would in turn reprice inflation expectations and the rate path.
Data note: All market data above is based on the September 28 U.S. stock market close. Crypto liquidation data is based on CoinGlass methodology. Treasury yields distinguish between closing levels (10-year at 5.23%, 30-year at 5.53%) and intraday highs (10-year at 5.27%, 30-year at 5.57%).
Disclaimer: The content of this article is for general informational and market commentary purposes only, based on publicly available information compiled as of the time stated herein, and relevant market data, expectations, and probabilities may change as market conditions evolve. The views and investment strategies of third-party institutions, analysts, or other persons cited herein represent only the views of the relevant third parties at a specific time and do not represent the views or recommendations of BIT. This article does not constitute investment advice, investment research, an offer, solicitation, or recommendation of any securities, investment products, or trading strategies, and should not be relied upon as the basis for any investment decision. Financial markets involve risk, securities prices and market performance may fluctuate, and historical performance and past market trends do not represent or guarantee future results. Investors should independently assess relevant risks based on their own circumstances and seek professional advice when needed.





