






Gate 机构周报:BTC DVOL 持续回落,PancakeSwap 成交额超过 160 亿美元(2026 年 7 月 27 日— 8 月 2 日)


- 核心观点:上周(2026年7月27日至8月2日)加密市场受美联储加息风险、滞胀担忧及衍生品去杠杆影响,BTC与ETH震荡下跌,但衍生品市场显示多头仍占优;链上活跃度由PancakeSwap、Robinhood Chain及Meme交易支撑,稳定币供给横盘但场景型资产逆势扩张。
- 关键要素:
- 美联储连续第5次维持利率在3.50%-3.75%,但3位官员主张加息;美国二季度GDP年化增长1.5%,核心PCE同比上涨3.3%,滞胀风险升温,10年期美债收益率升至约4.73%压制风险资产。
- 美国现货BTC ETF周净流出约0.62亿美元,IBIT流入0.87亿而FBTC流出0.85亿;ETH ETF微幅净流入0.10亿美元,较前周骤降90.37%,但仍显机构韧性。
- Gate TradFi周交易量逼近千亿美元,股票交易占比升至近70%并向美股(56%)与韩股(32%)集中;XAUT订单簿Delta多数时段为正,8月3日买盘深度升至约150万美元。
- PancakeSwap成交升至约160.2亿美元(+7.6%)超过Uniswap(135.7亿);Robinhood Chain的Pons v2发行超21万枚代币并产生超2.83亿美元交易量,PumpSwap成交约45.1亿美元。
- 稳定币总供给横盘偏弱,USDC降至约738亿美元;但USDG升至约30.8亿、RLUSD升至约7.0亿美元,Robinhood Chain存款突破6亿美元,资金向收益型钱包和券商入口集中。
- BTC OI从225亿美元上方回落至约220亿,资金费率持续正值(0.003-0.007);期权25D Skew回落至-5附近,DVOL降至约35,市场定价高位震荡,若跌破6.3万美元需警惕多头去杠杆。
Summary
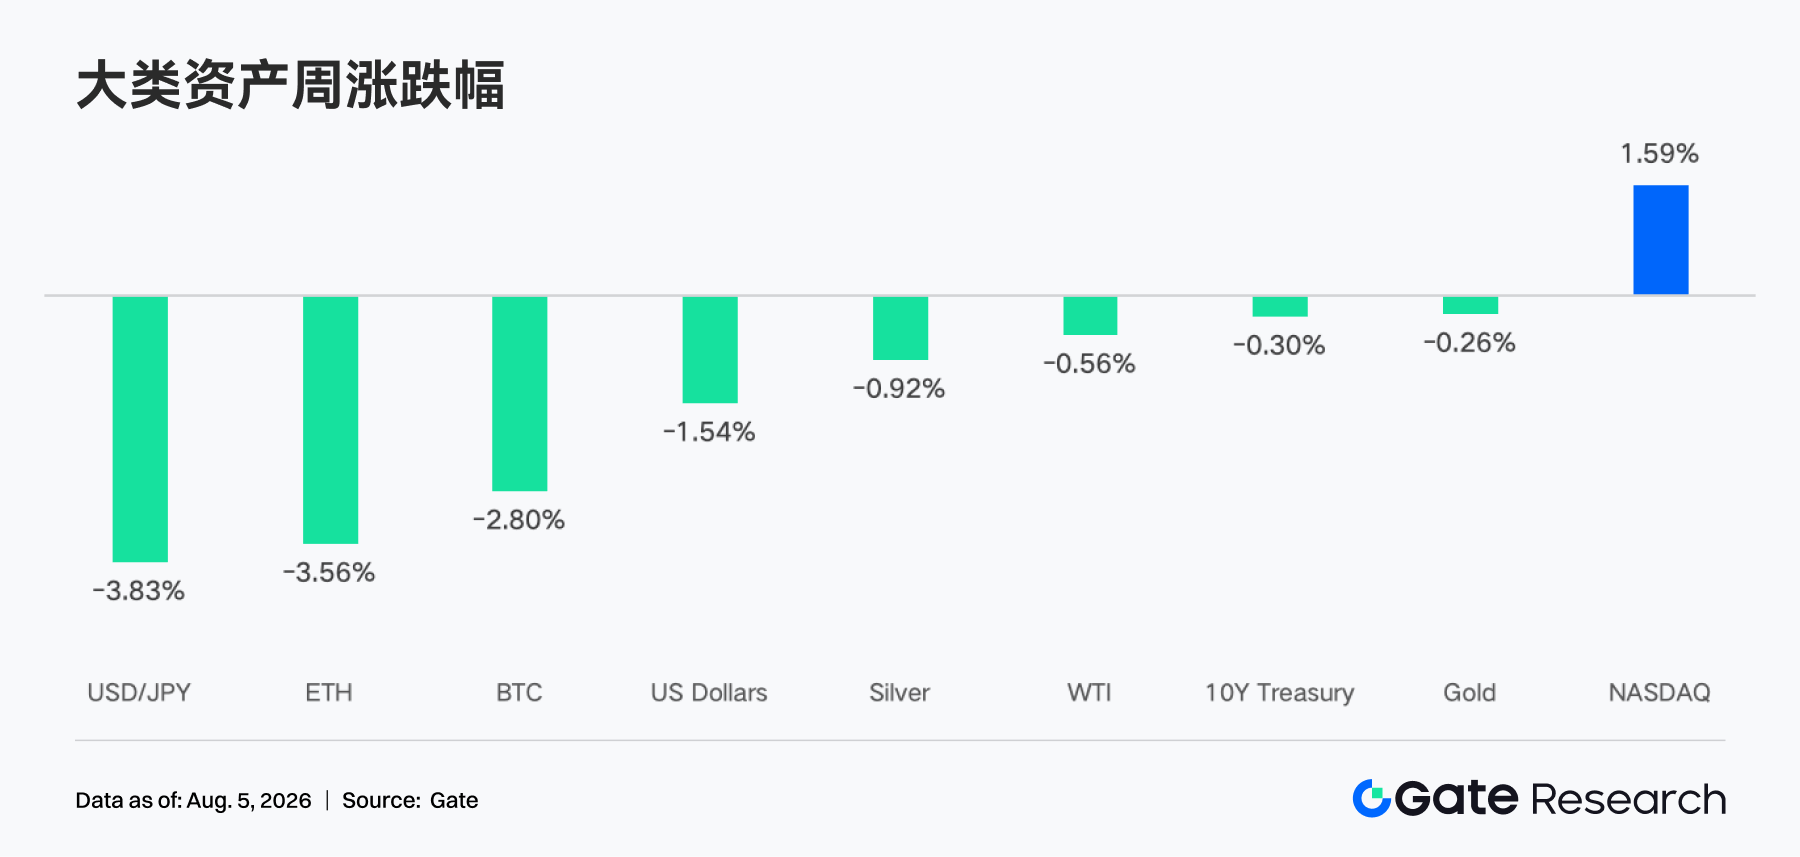
• With Fed rate hike risks and stagflation concerns intensifying, U.S. equities rallied, with the Nasdaq up 1.6%. However, high interest rates and deleveraging weighed on BTC and ETH, with BTC falling 2.8% and ETH declining 3.56% on the week.
• BTC ETFs turned to net outflows while ETH still saw slight net subscriptions; Gate TradFi trading approached $100 billion, with stock capital concentrating in U.S. and Korean equities; XAUT's order book maintained strong bid-side depth throughout, with Delta remaining positive for the vast majority of the time.
• PancakeSwap trading volume rose to approximately $16 billion, surpassing Uniswap, with Robinhood Chain, RWA, and PUMP-related Memes becoming the main sources of short-term traffic. Stablecoin total supply remained flat-to-weak, but USDG, RLUSD, and others expanded against the trend.
• The LST sector saw broad pullbacks, with ETH staking assets relatively resilient; Aave lending was supported by Ethereum, Plasma, and Monad, with rates remaining low overall. In terms of protocol revenue, Tether and Circle continued to serve as the foundation, while revenue from Meme platforms and trading tools like Pump grew notably.
• BTC spiked and then pulled back, with OI falling from above $22.5 billion to approximately $22 billion, but funding rates remained positive, indicating bulls still held the advantage while leverage-driven chasing cooled; if BTC breaks below $63,000, caution is warranted regarding further deleveraging of long positions.
• Options volume surged at month-end before quickly retreating, with monthly contracts still dominant; 25D Skew weakened again with protection demand recovering, while DVOL fell to around 35. The market continues to price in high-level consolidation, but a breakout of the $63,000–$66,000 range could trigger a rapid volatility expansion.
1. Market Focus Analysis
Last week (July 27 – August 2, 2026), markets traded repeatedly around Fed policy, U.S. "stagflation" risks, and Middle East tensions. The Fed held the federal funds rate target range at 3.50%–3.75% for the fifth consecutive meeting, but three officials favored a rate hike, reflecting significantly heightened vigilance among policymakers over resurgent inflation. U.S. Q2 real GDP grew at an annualized rate of 1.5%, below Q1's 2.1%, but consumer spending rose 3.2%, indicating economic deceleration alongside resilient domestic demand. June headline PCE rose 3.7% year-over-year, while core PCE rose 3.3%, both well above the Fed's 2% target.
Asset prices therefore exhibited high volatility. The 10-year U.S. Treasury yield initially declined from 4.69% to 4.65% at the start of the week, then rose to approximately 4.73% on inflation and rate hike expectations, pressuring high-valuation assets. Middle East ceasefire expectations briefly pushed Brent crude down 6.3% to $85.87, but renewed hostilities drove oil prices back up to around $87.93. Gold found support from geopolitical safe-haven demand, though high real rates limited its upside. U.S. equities recovered amid AI sector turbulence and strong large-cap tech earnings, with the S&P 500, Dow, and Nasdaq rising 1.0%, 1.0%, and 1.6% respectively for the week. The crypto market failed to benefit in tandem, as higher risk-free yields, oil-driven inflation pressures, and derivatives deleveraging collectively suppressed risk appetite, with BTC and ETH both declining in choppy trading during the week.
2. Liquidity Analysis
2.1 ETH ETFs Still Retain Modest Net Subscriptions; Institutional Stance Relatively More Resilient
Last week, U.S. spot BTC ETFs saw combined net outflows of approximately $62 million, a notable reversal from the prior week's net inflows of $34 million, indicating a shift from modest accumulation to reduced holdings. At the product level, IBIT recorded net inflows of approximately $87 million for the week, the strongest performer; FBTC saw net outflows of approximately $85 million, the weakest performer. Weekly flows were highly volatile: Thursday saw net inflows of $233 million, followed by net outflows of $265 million on Friday, suggesting institutional trading was more event-driven with little sustained momentum-chasing.
ETH ETFs still recorded net inflows of approximately $10 million for the week, but this represented a sharp decline of roughly 90.37% from the prior week's $104 million. ETHA saw net inflows of approximately $37 million, continuing as the primary source of support; FETH recorded net outflows of approximately $21 million, the weakest performer. Since AUM data lacks a unified precise public snapshot, we use a proxy of "prior week's estimated AUM × token price change + current week's net flows": BTC ETF AUM fell from approximately $78.30 billion to $76.05 billion, down roughly 2.88% week-over-week; ETH ETF AUM declined from approximately $10.10 billion to $9.75 billion, down roughly 3.46%. Both AUM declines were primarily driven by price depreciation, but BTC also experienced net redemptions, reflecting a more defensive sentiment; ETH retained modest net subscriptions, indicating a relatively more resilient institutional stance.
2.2 TradFi Liquidity
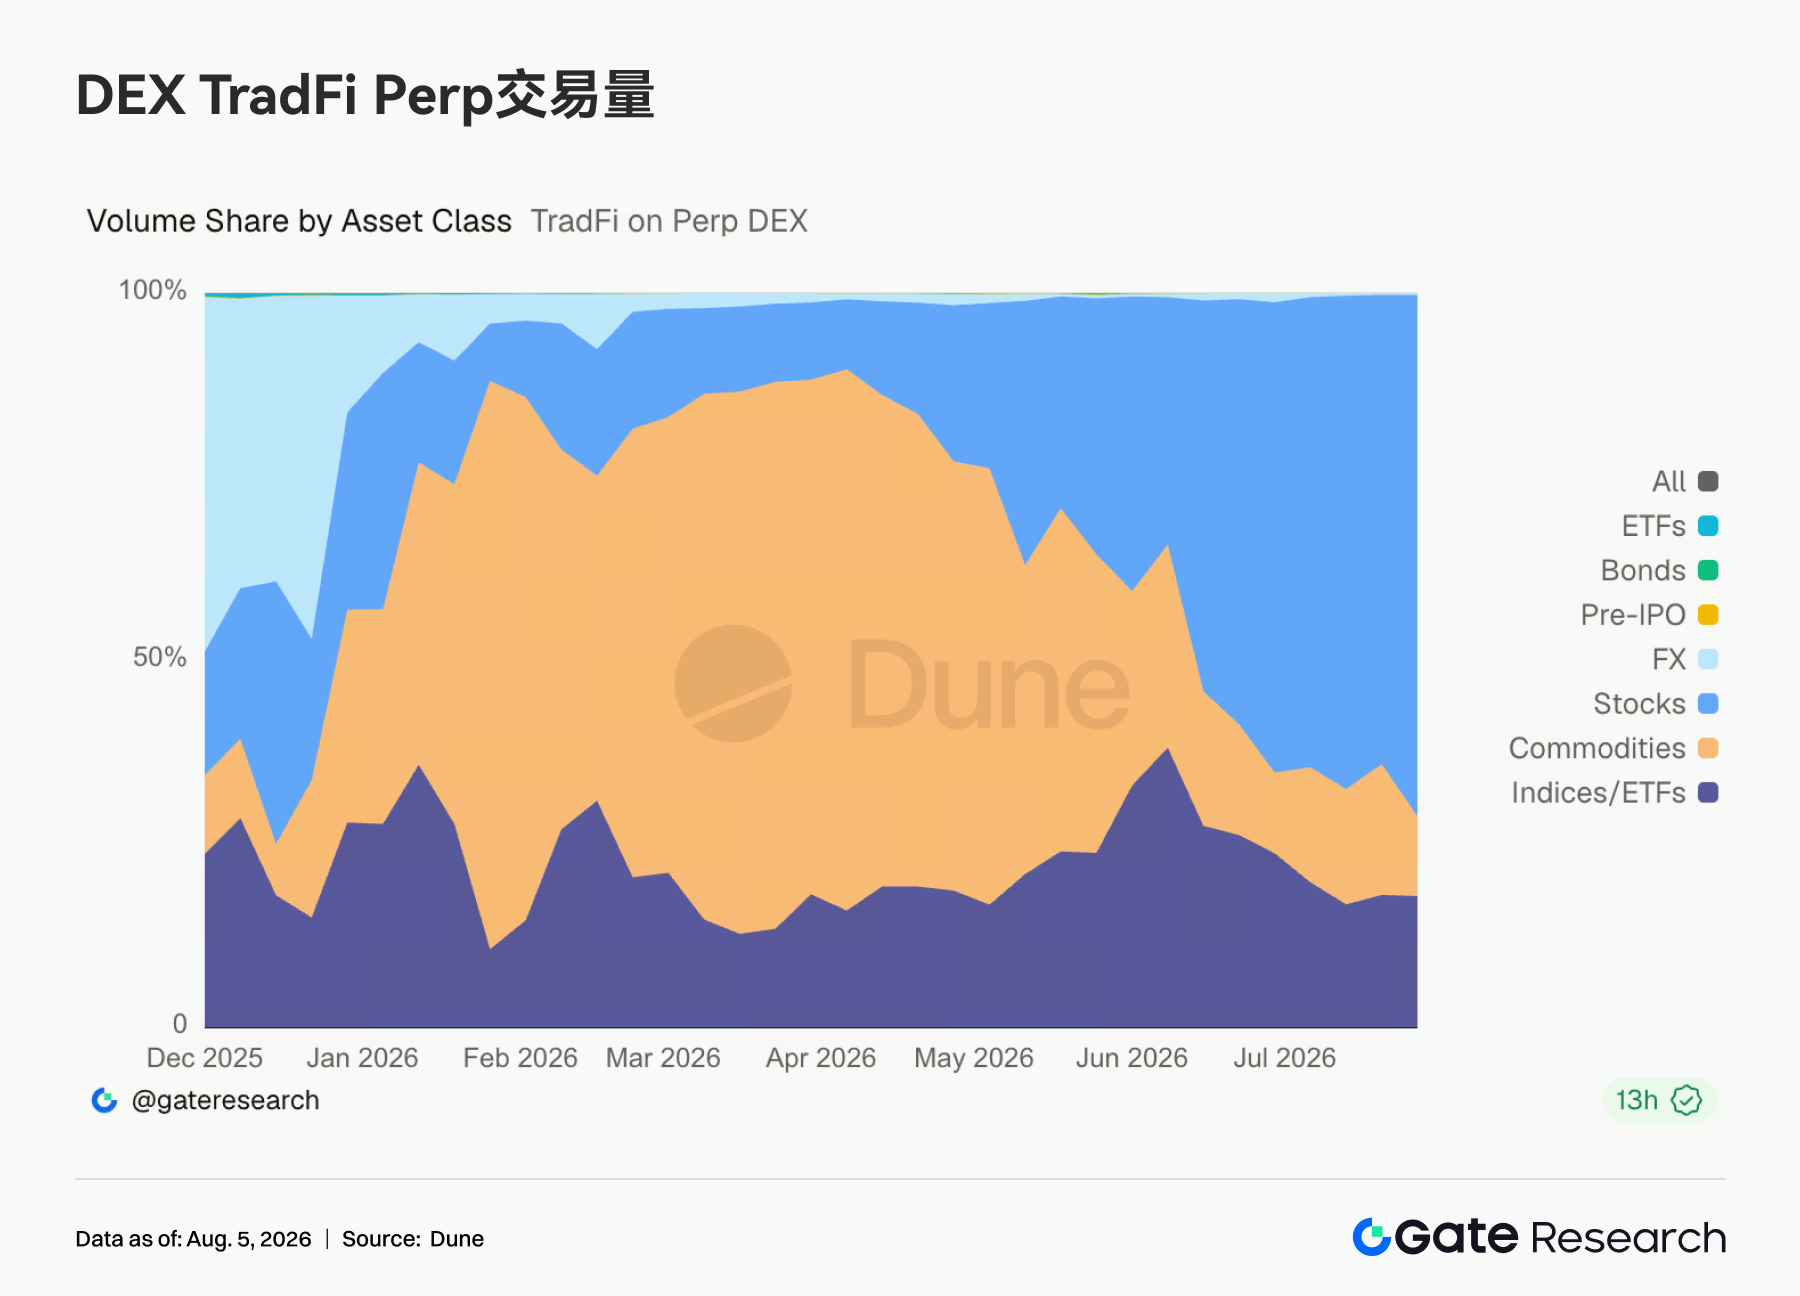
• TradFi Perp DEX: Over the past week, the TradFi trading structure across platforms continued to concentrate notably toward equity assets. Stock trading share rose steadily from approximately 60% in early July to nearly 70% by end of July, becoming the dominant TradFi trading category. Commodities trading continued to cool, with its share falling from roughly 30%–40% previously to approximately 10%, indicating that the trading heat previously driven by gold, crude oil, and other commodities has significantly diminished. Index/ETF share remained stable at approximately 15%–20%, continuing to serve important diversification allocation needs. In contrast, FX, bonds, and Pre-IPO trading shares remained relatively low. Overall, TradFi capital on the platform is rotating back from the temporarily active commodities segment to equity markets, with the trading structure further concentrating toward equity assets.
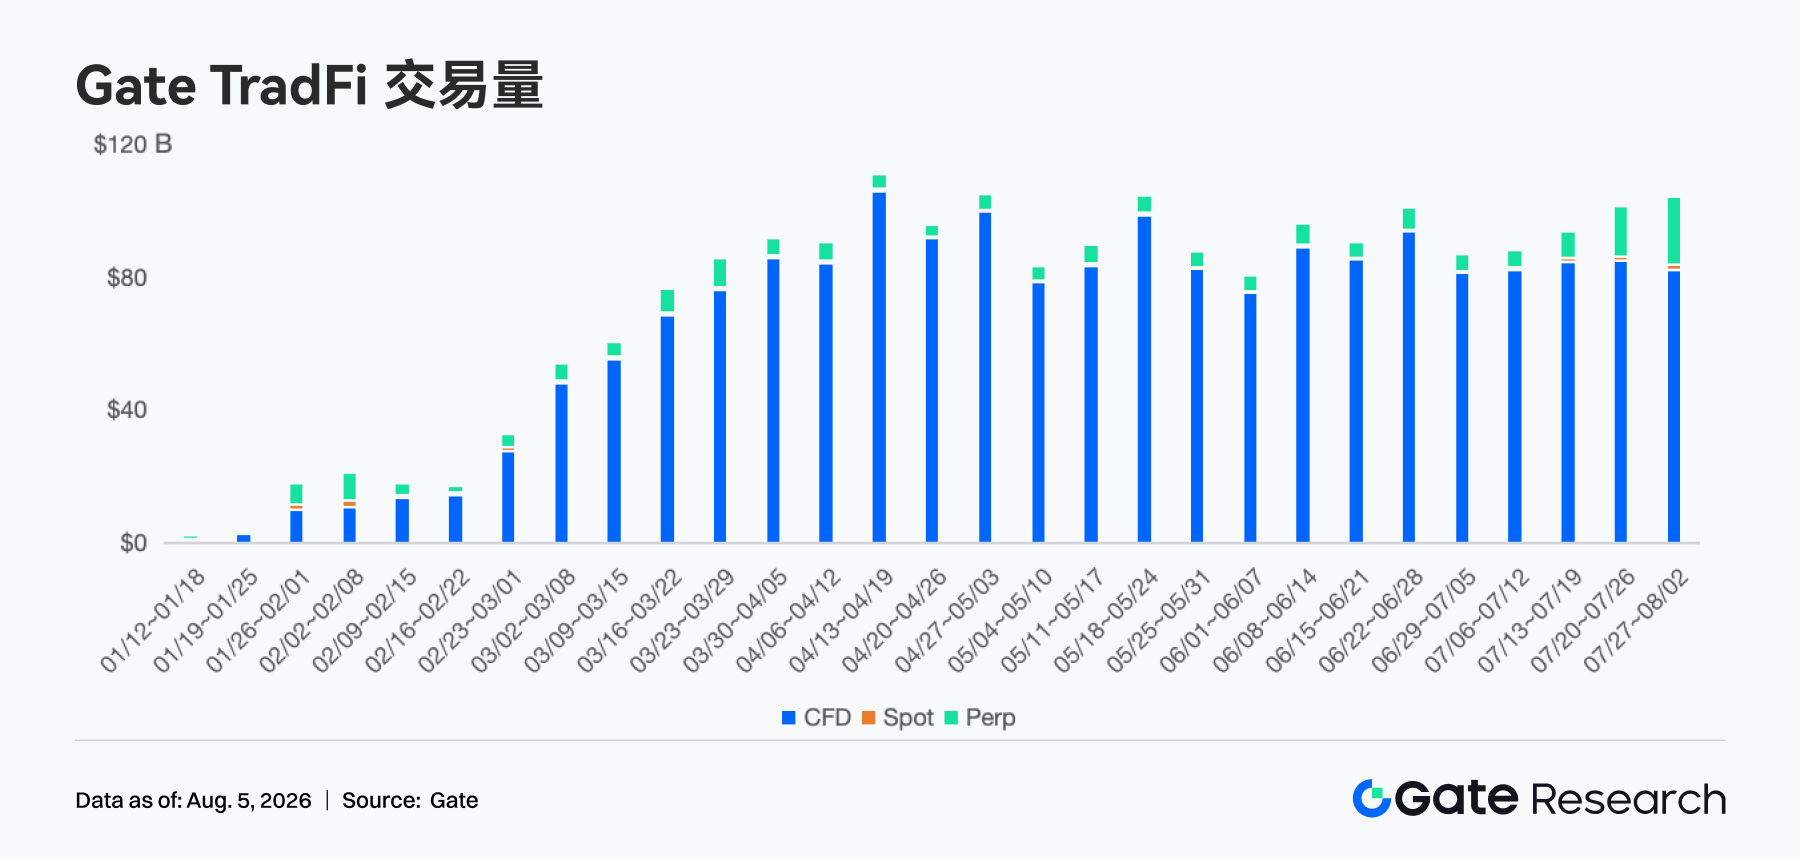
• Gate TradFi Trading Volume: Over the past week, Gate TradFi weekly trading volume continued to hold at elevated levels, hovering around $100 billion, growing further from the prior week and approaching prior cyclical highs. By trading structure, CFD remains absolutely dominant, contributing over $80 billion in trading volume; Perp volume continued to grow with its share further increasing. Overall, after the rapid expansion in earlier periods, Gate TradFi's weekly trading scale has remained stable above $80 billion for several consecutive weeks, and has recently moved back toward the $100 billion level, demonstrating strong resilience in TradFi product trading activity and user engagement.
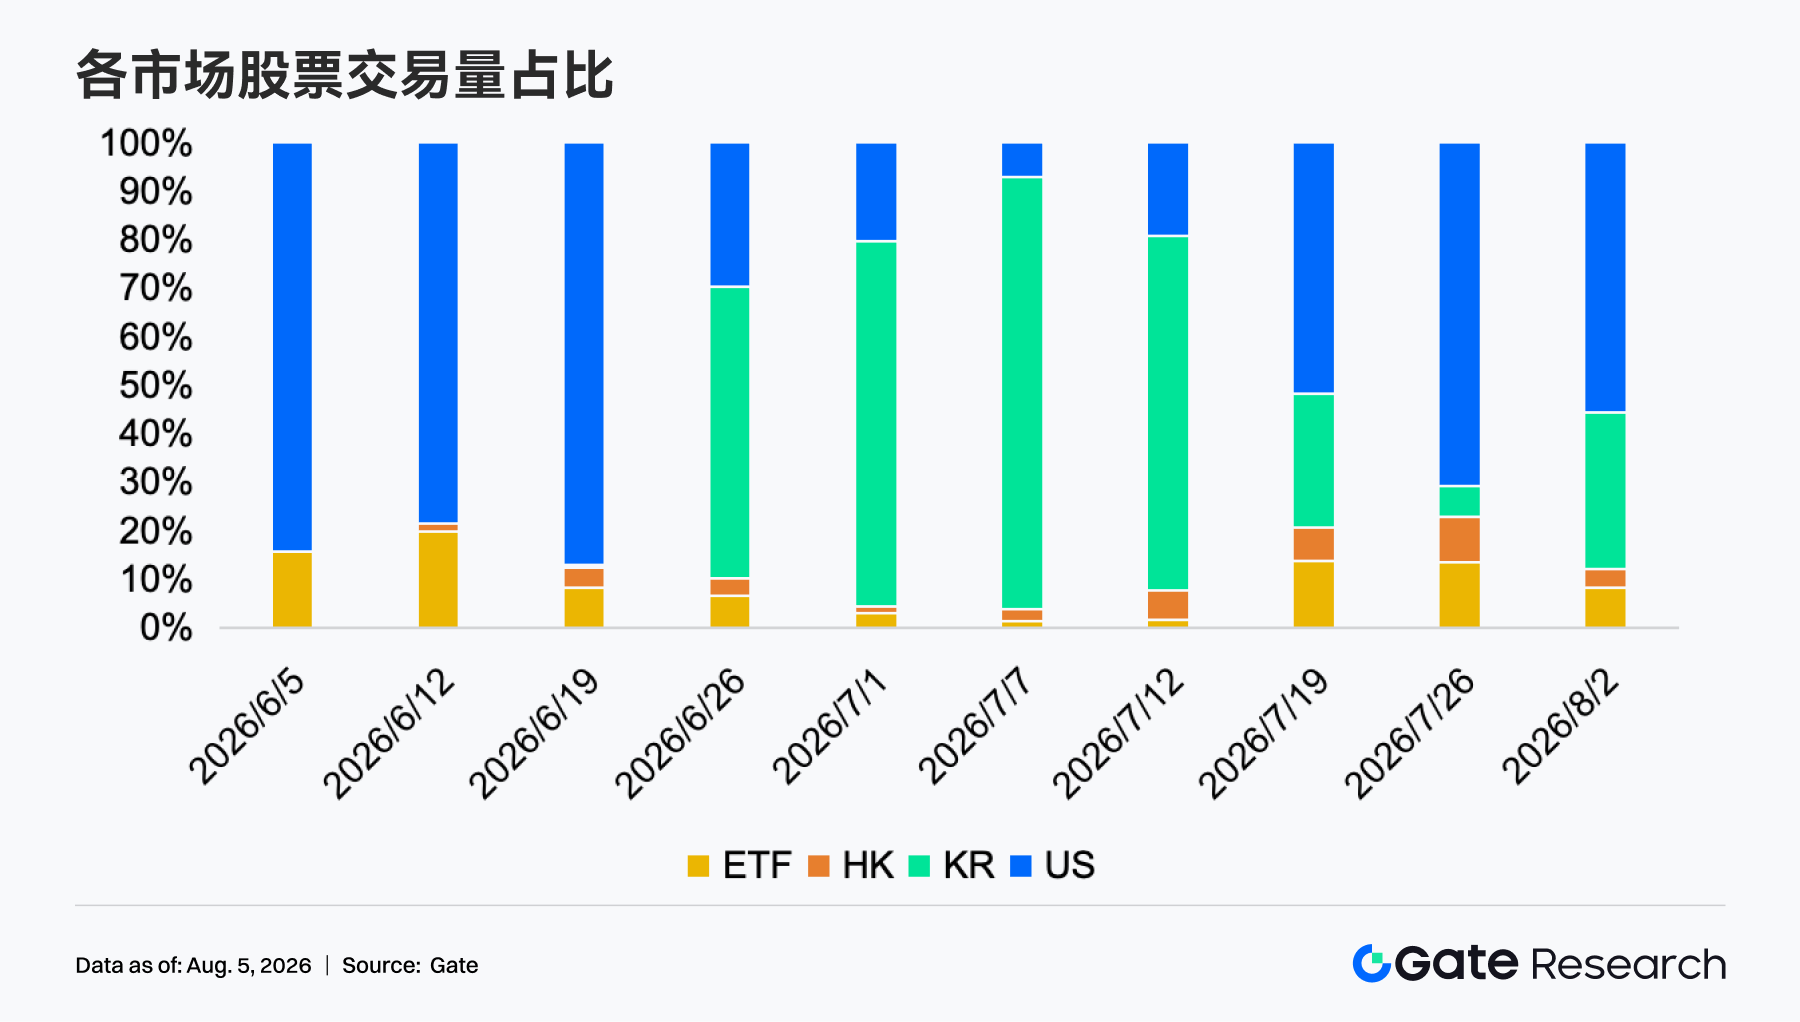
• Gate Stock Asset Trading Volume: Over the past week, the trading structure of Gate's stock assets underwent notable adjustment again. U.S. stocks remained the largest trading market, but their share fell from approximately 71% in the prior week to about 56%; Korean stocks rebounded sharply from roughly 7% to approximately 32%, becoming the week's primary incremental source. Meanwhile, ETF share declined from about 14% to approximately 8%, while Hong Kong stocks held steady at around 4%. Overall, stock trading capital shifted from being highly concentrated in U.S. stocks back to a dual-track focus on U.S. and Korean equities. The core position of U.S. stocks remains unchanged, but Korean market trading activity has recovered significantly, reflecting notably enhanced rotation trading by users across different regional equity assets.
• TradFi Order Book Depth: We selected XAUT, the highest-volume TradFi asset, for order book depth (Delta) analysis. Over the past week, XAUT's order book maintained strong bid-side depth overall, with Delta remaining positive for the vast majority of the time. From July 28–30, bid depth frequently approached or exceeded $1 million, with only brief negative readings. XAUT prices oscillated mainly in the $4,020–$4,100 range. On August 3, bid depth rapidly rose to approximately $1.5 million, indicating notably stronger downside support, with overall liquidity remaining tilted bullish.
3. On-Chain Data Insights
3.1 PancakeSwap Leads; Robinhood Chain and PUMP Continue to Provide Short-Term Traffic
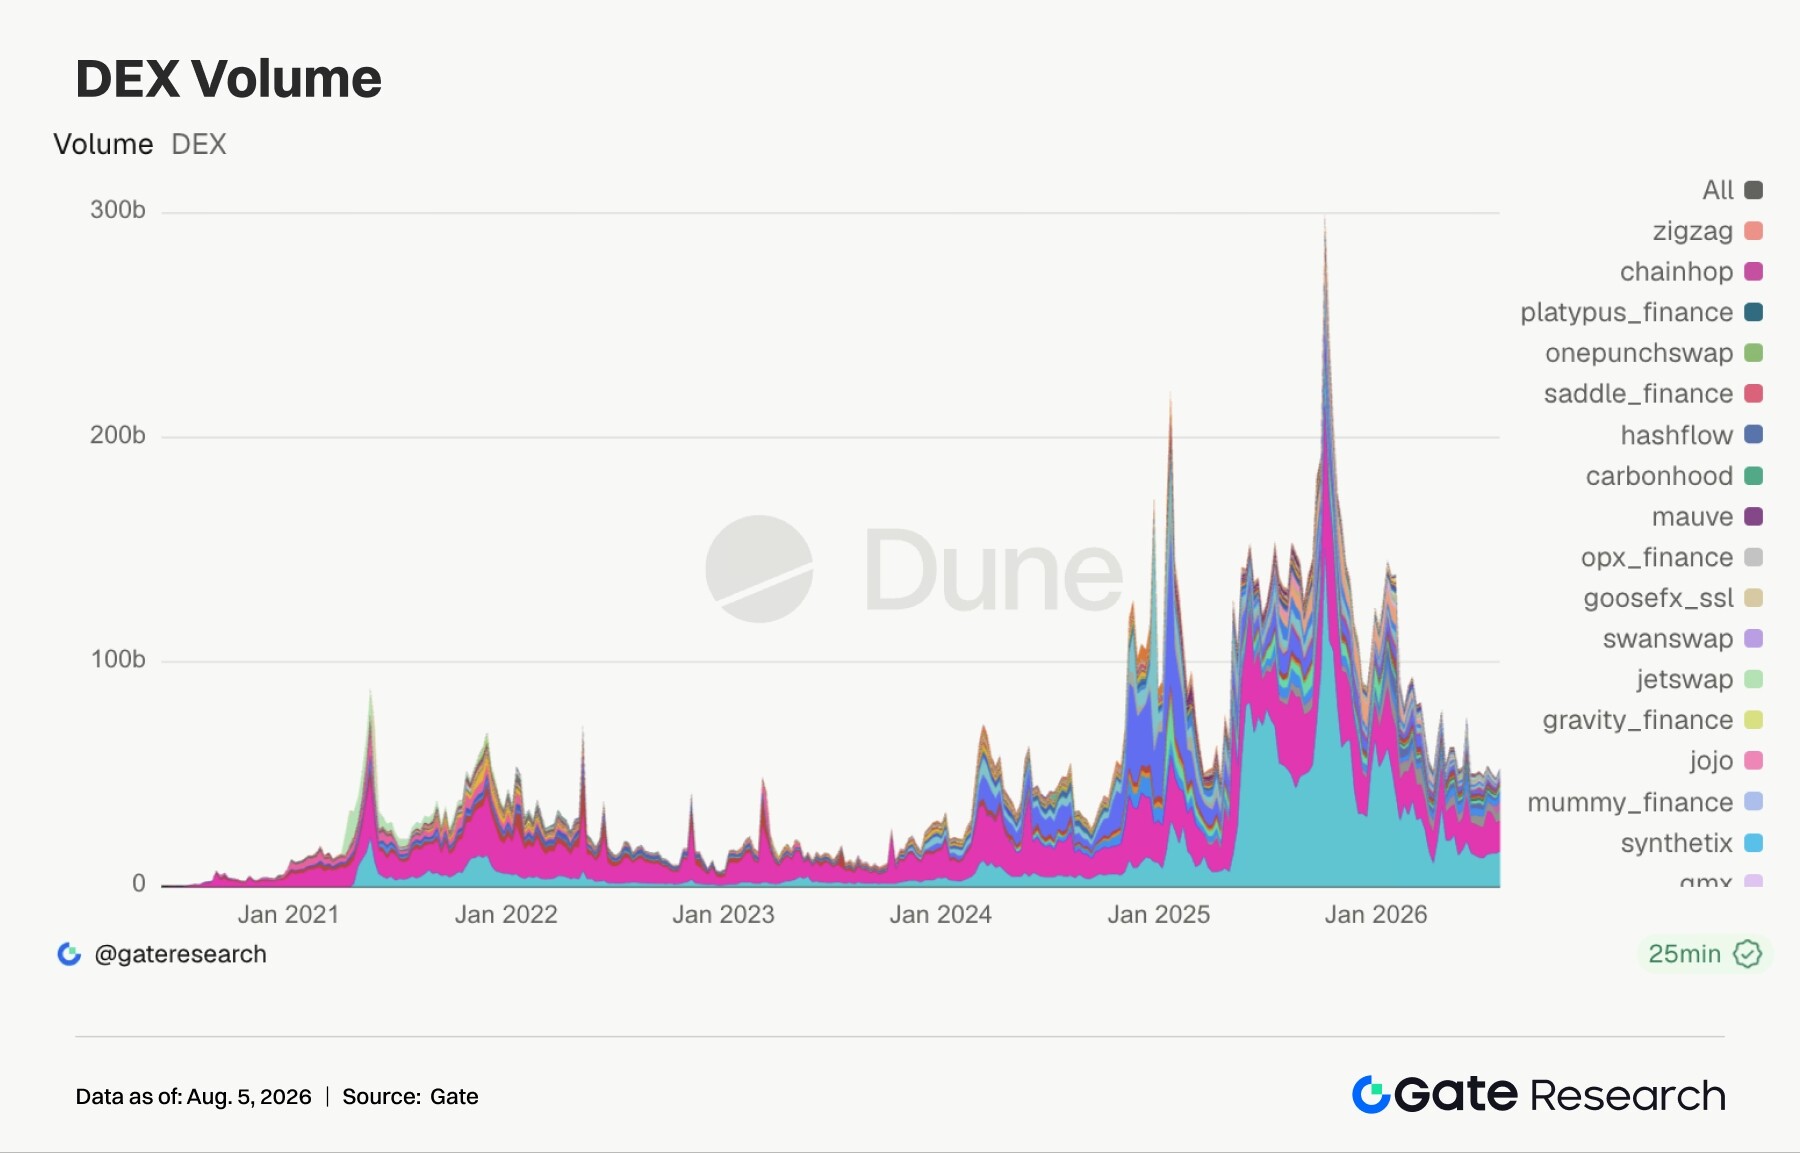
This week, DEX activity was driven simultaneously by PancakeSwap, Robinhood Chain/RWA-related trading, and PUMP-ecosystem memes. PancakeSwap volume rose to approximately $16.02 billion, up about 7.6% from the prior week, surpassing Uniswap; Uniswap volume was approximately $13.57 billion, slightly lower but still at elevated levels. Robinhood Chain-related momentum continued to build, with Pons v2 launching and deeply integrating with Uniswap V4, enabling token launches to be directly paired with tokenized stocks. Over the past two weeks, Pons issued over 210,000 tokens and generated over $283 million in trading volume within Uniswap pools. Native volume rose to approximately $4.34 billion, with Aerodrome also rebounding notably, indicating that RWA, on-chain stocks, and Base/Ethereum-ecosystem liquidity are absorbing capital. PumpSwap volume rose to approximately $4.51 billion, with Pump.fun volume and trader counts recovering in tandem, keeping meme trading active; however, Meteora and Whirlpool weakened, indicating no broad recovery on the Solana side.
3.2 Stablecoin Supply Flat-to-Weak; Scenario-Based Assets Like USDG and RLUSD Expand Against the Trend
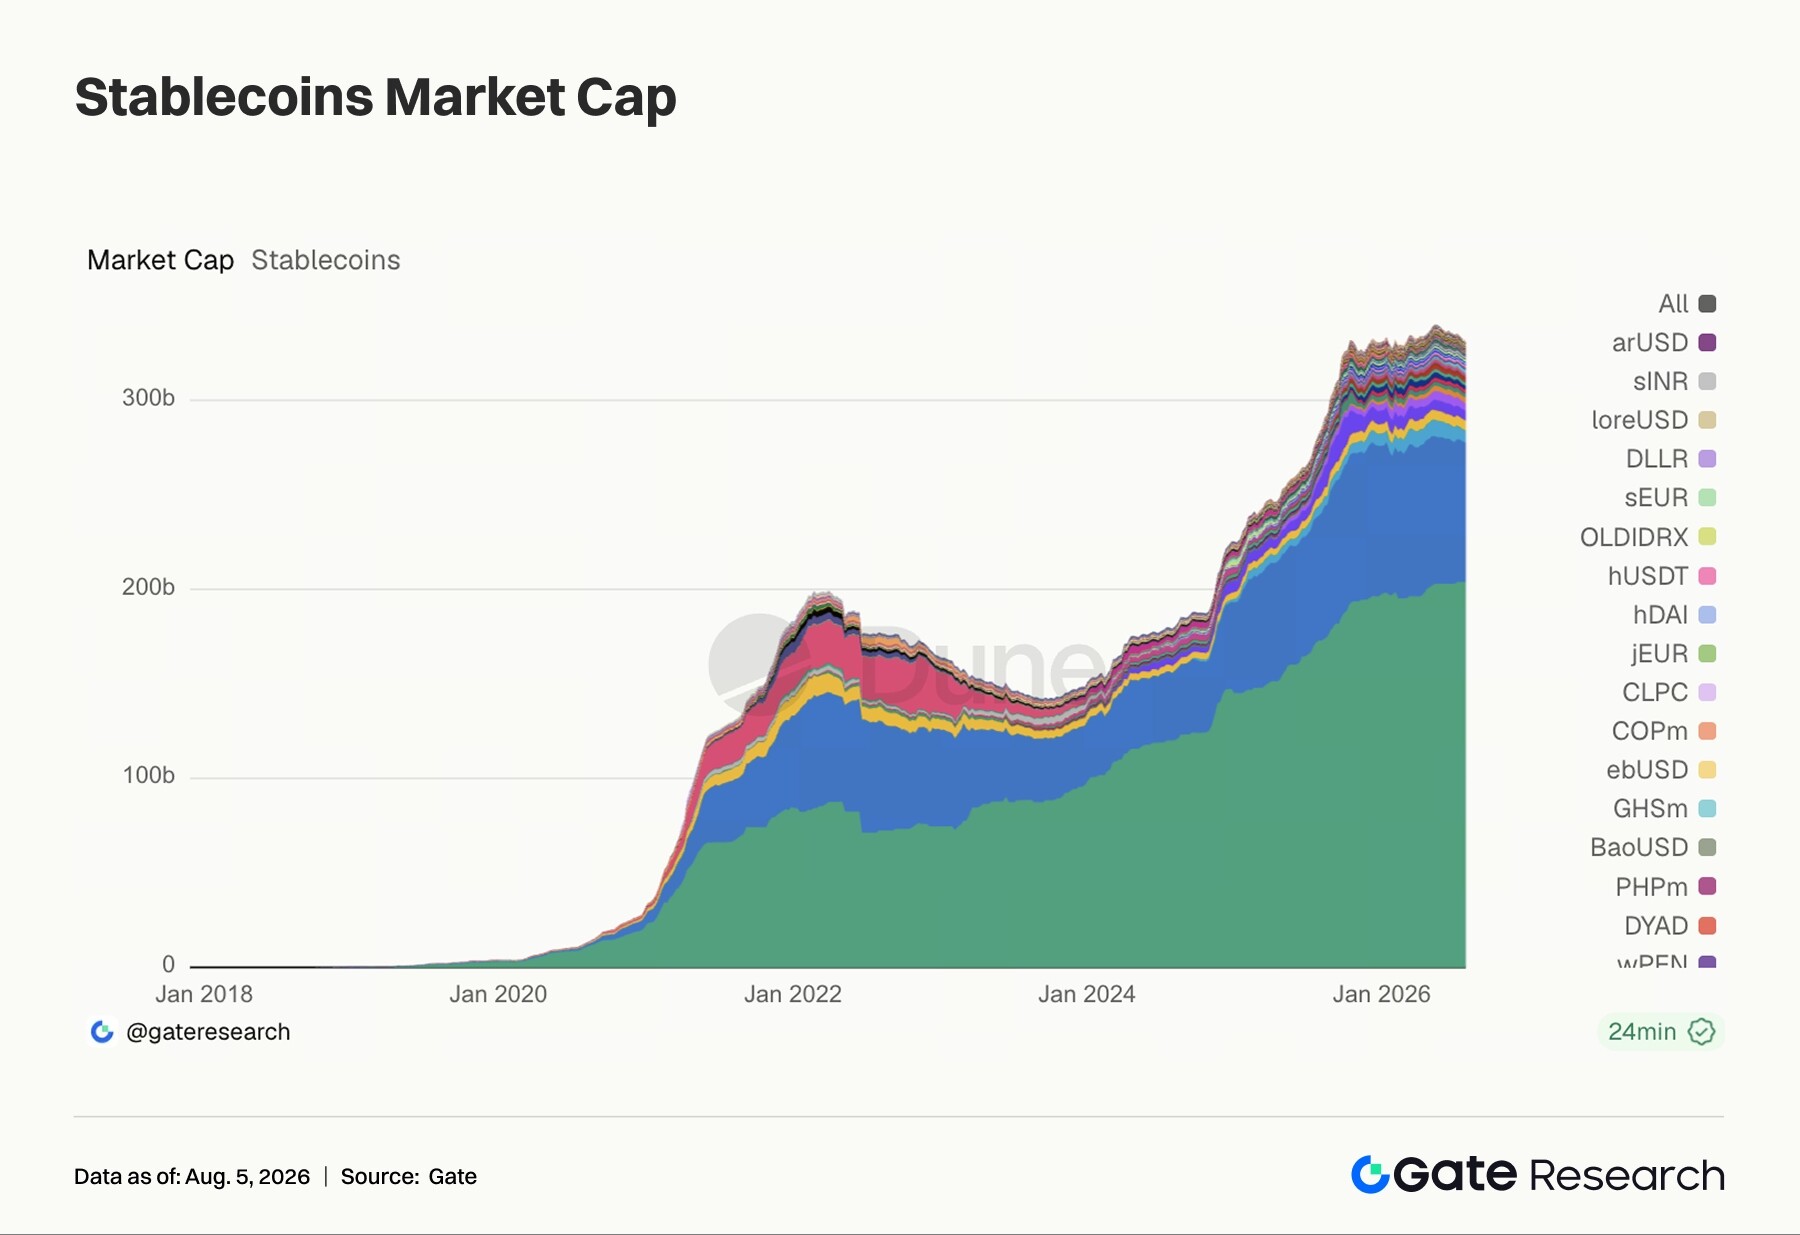
This week, USDT was essentially flat, while USDC declined slightly from approximately $74.45 billion to $73.8 billion, with no notable incremental dollar inflows into the top stablecoins. USDe, USD1, USDS, and DAI all pulled back modestly, with the expansion momentum of yield-bearing and protocol-based stablecoins continuing to slow. Relatively strong performers were USDG, PYUSD, USDD, RLUSD, and EURC, with USDG rising to approximately $3.08 billion and RLUSD to roughly $700 million. Over the past week, Robinhood Chain application deposits surpassed $600 million, with part of the increment coming from Robinhood Earn's yield attraction for USDG. The core of the stablecoin market has shifted toward capturing wallet, brokerage, payments, and yield entry points. U.S. stablecoin regulation is still awaiting a clearer enforcement framework, with Visa, Robinhood, Circle, Ripple, and others all racing for distribution rights. Capital is flowing more granularly toward dollar-backed assets with clear use cases and yield on-ramps.
3.3 LST Sector Sees Broad Pullback; ETH Staking Assets Relatively Resilient
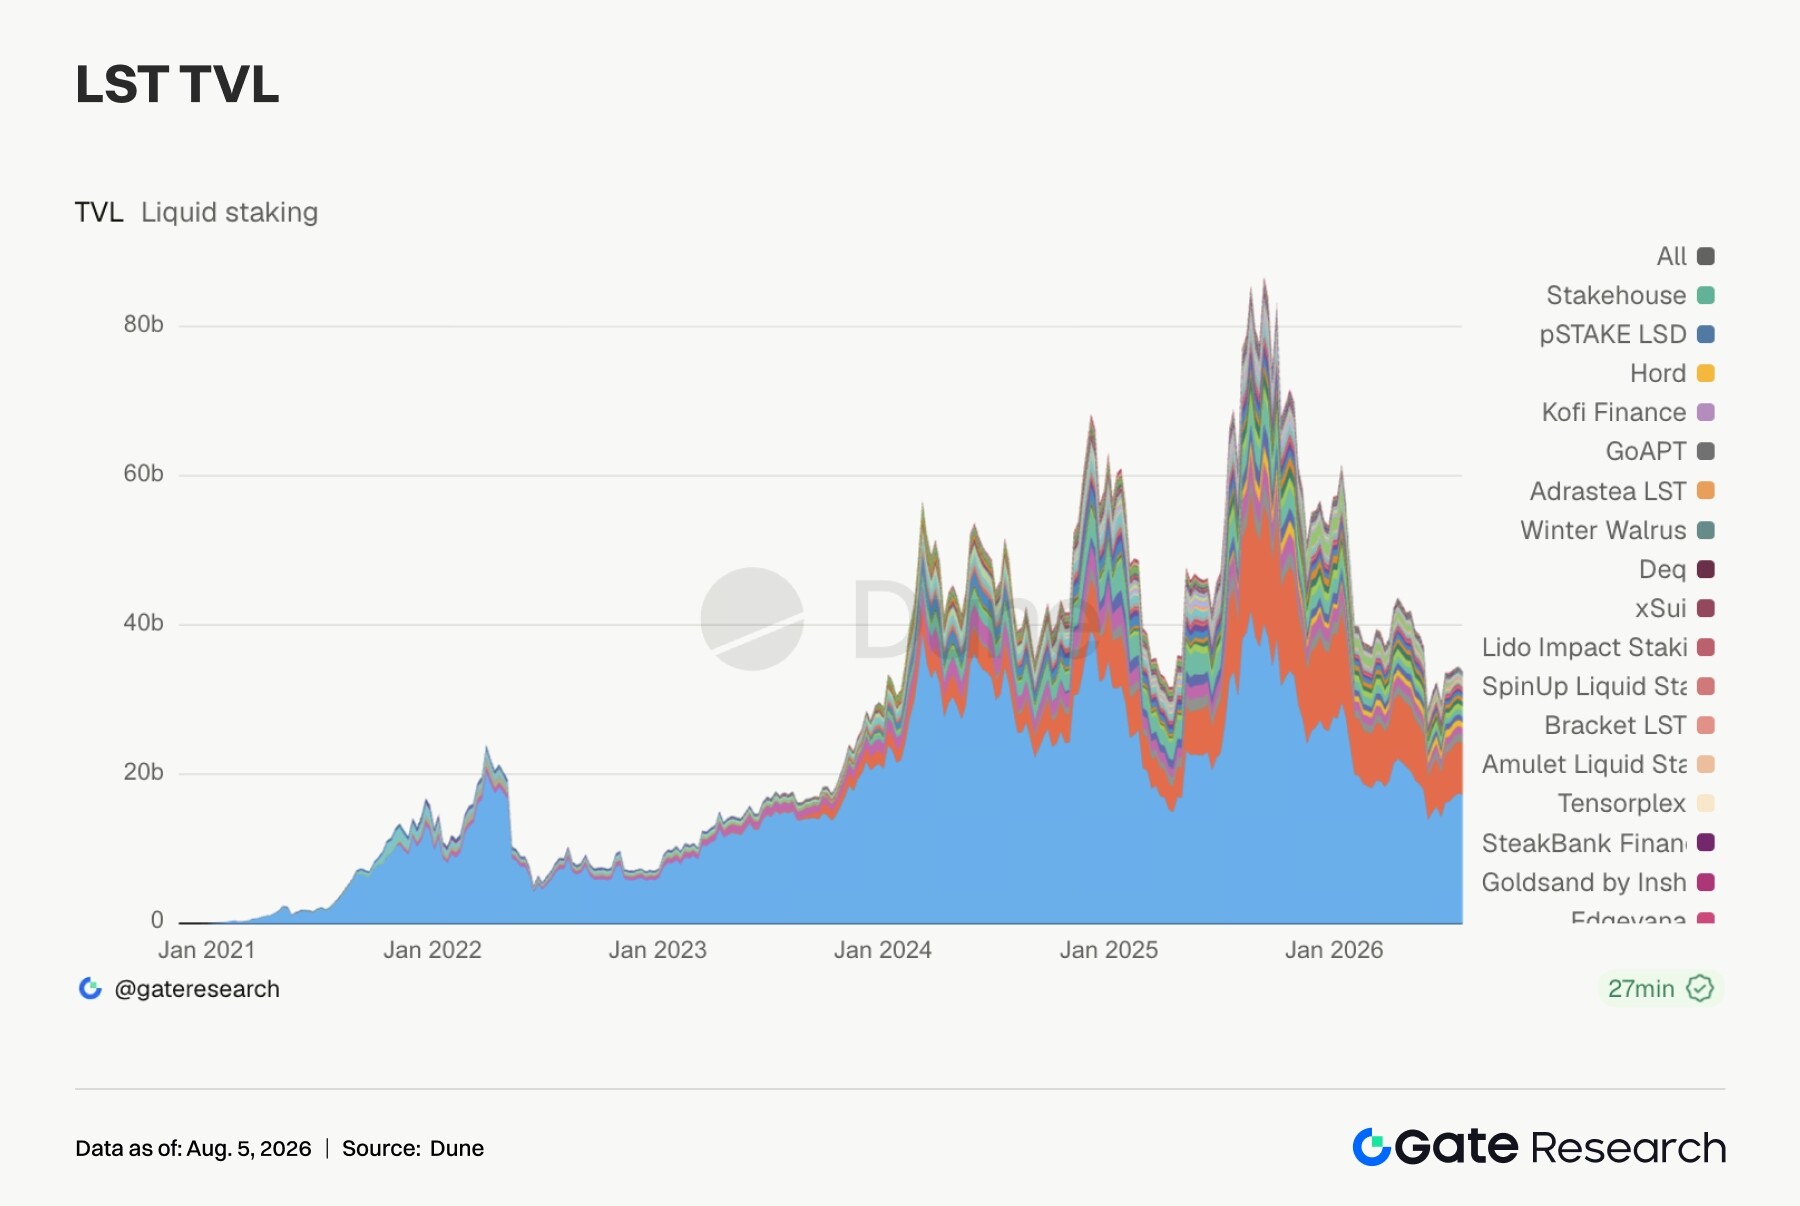
This week, the LST sector declined broadly. Lido TVL fell from approximately $17.5 billion to $17.36 billion, with Rocket Pool, StakeWise, Liquid Collective, and mETH Protocol also edging lower. Although ETH ETFs maintained net inflows, the inflow pace slowed versus the prior week. From July 27–31, ETH ETFs recorded combined net inflows of approximately $27.4 million, well below the prior week's roughly $104 million, with the valuation recovery momentum of staking assets weakening in tandem. The SOL-side correction was more pronounced, with Sanctum, Jito, Jupiter Staked SOL, and Binance Staked SOL all declining; HYPE-related Kinetiq kHYPE and stHYPE fell even more sharply. Against the backdrop of FOMC, tech earnings, and ETF flow volatility, institutional capital is tending to reduce exposure to high-beta staking assets.
3.4 Aave Lending Supported by Ethereum, Plasma, and Monad; Divergence Between Emerging Chains Deepens
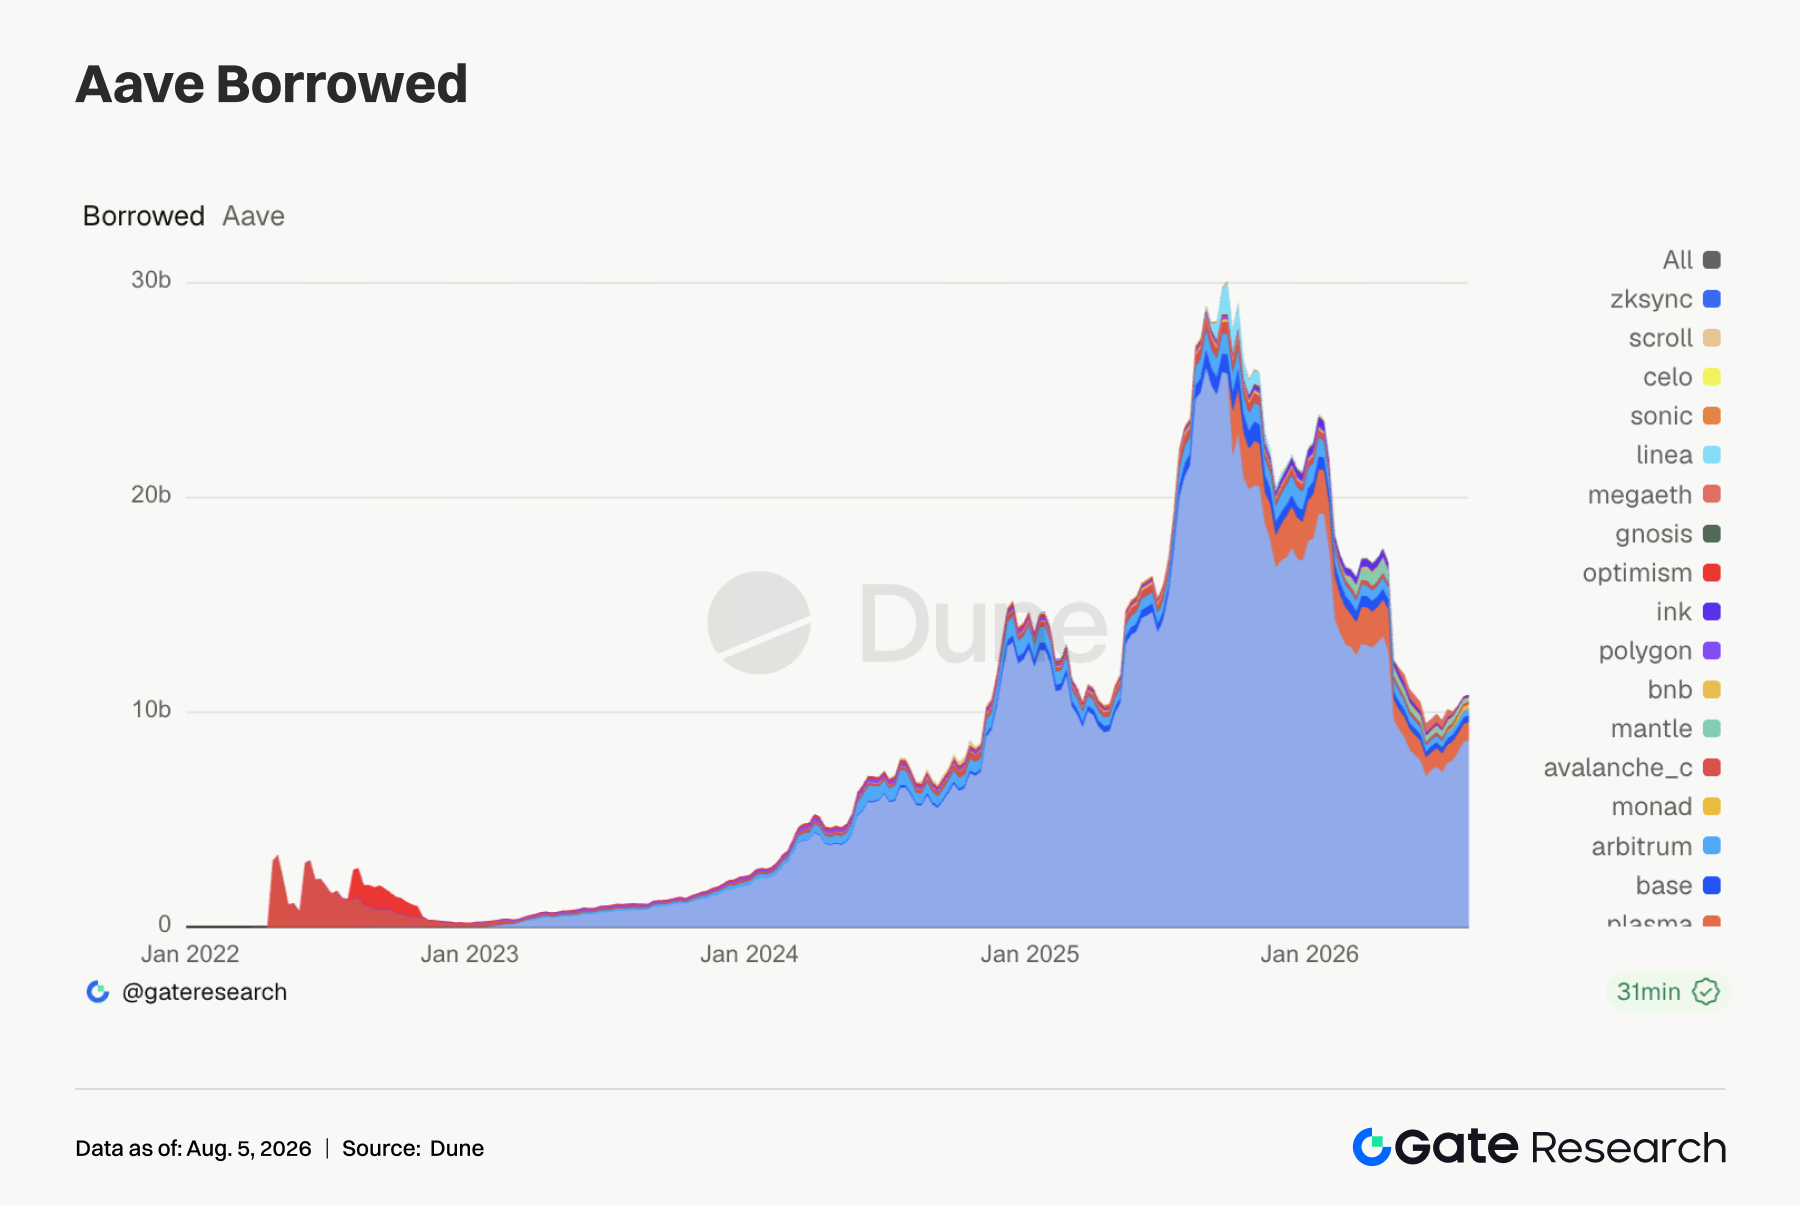
Aave's lending balances are supported by core markets, with the Ethereum market's borrow volume rising to approximately $8.7 billion, making it the protocol's most important liquidity pool. Plasma rose from approximately $817 million to $870 million, and Monad increased from roughly $192 million to $215 million, with some new chains able to attract borrowing demand through incentives, early liquidity expectations, and high-yield strategies. Base was essentially flat, while Arbitrum declined slightly; Mantle fell from approximately $149 million to $106 million, and MegaETH continued to retreat. The market is re-screening emerging chains—those with clear growth narratives and capital entry points can still expand, while markets lacking sustained incentives or trading demand see positions trimmed.
3.5 Aave Rates Stable at Low Levels; USDC Saw Brief Spikes but No Systemic Tightening
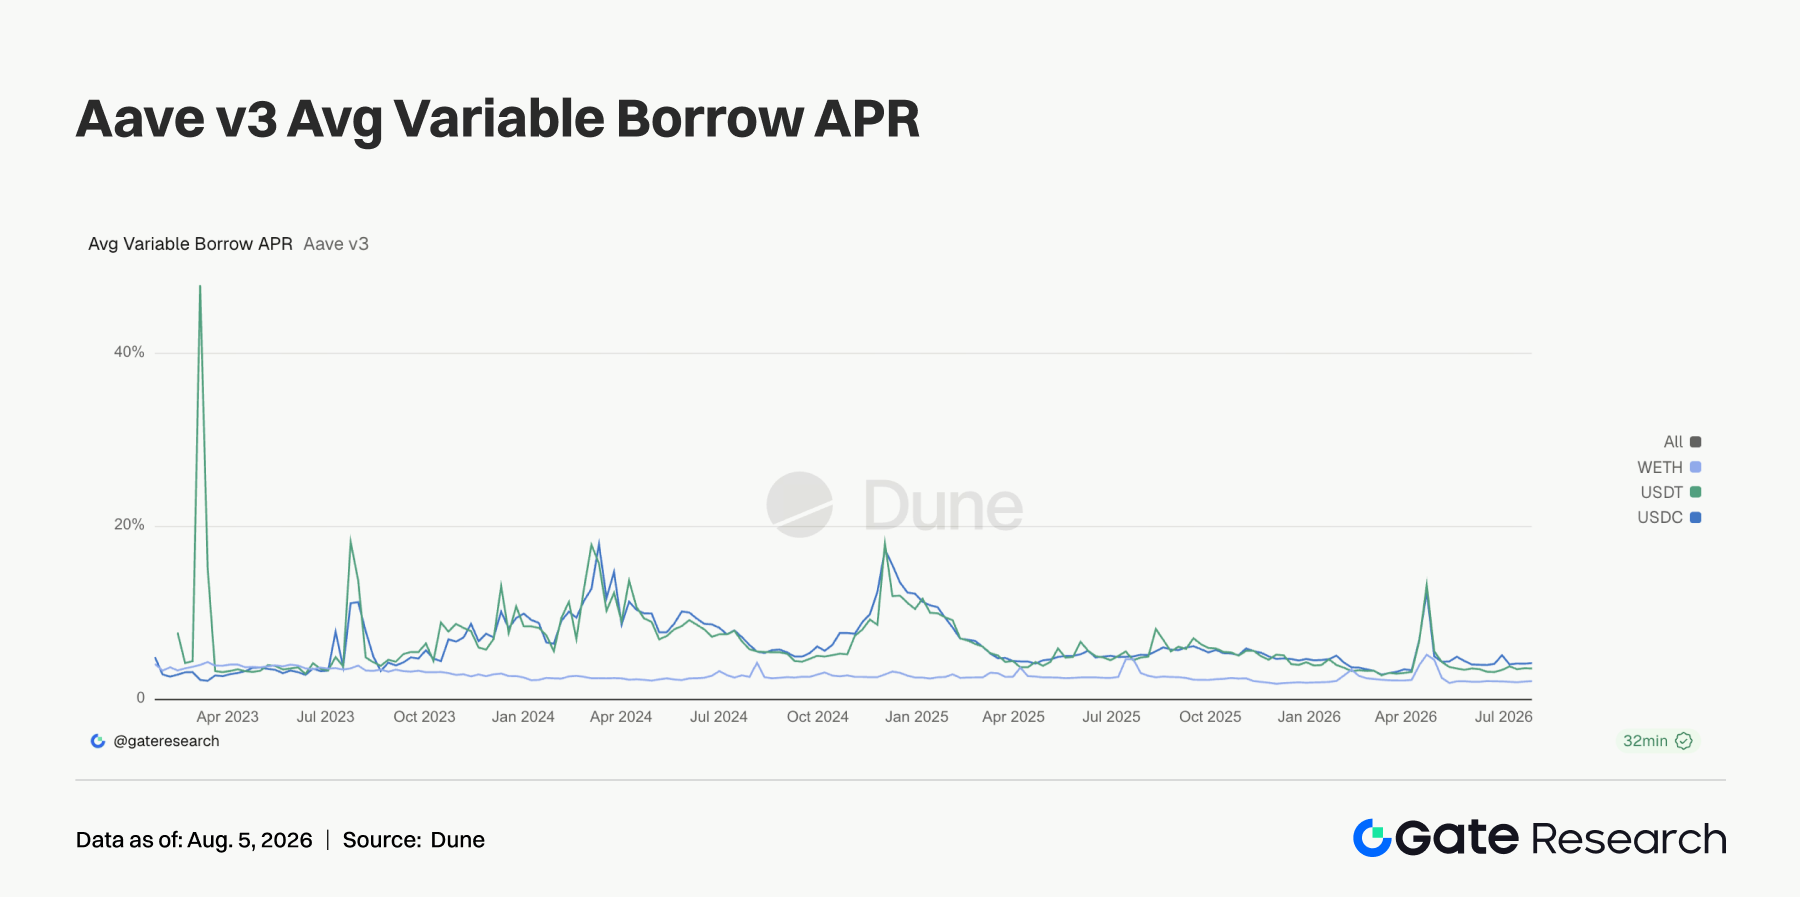
This week, Aave's Ethereum main market rates remained broadly stable. The average USDC borrow rate was approximately 4.24%, slightly above the prior week, with intra-week highs near 14%—indicating that USDC still experiences brief capital tightness during concentrated hot trading. The average USDT rate was approximately 3.61%, slightly lower than the prior week, with notably mild tail pressure. The average WETH rate rose to approximately 2.15%, but remained at low levels. The growth in lending balances did not trigger a rapid surge in funding costs; the market is not engaging in one-sided high-leverage chasing but rather rotating capital in short cycles among ETFs, RWA, memes, and TradFi perps. The signals from rates are more restrained than volume data—risk appetite is recovering, but leverage remains controlled.
3.6 Protocol Revenue Driven by Memes and Trading Tools; Stablecoin Issuers Form the Foundation
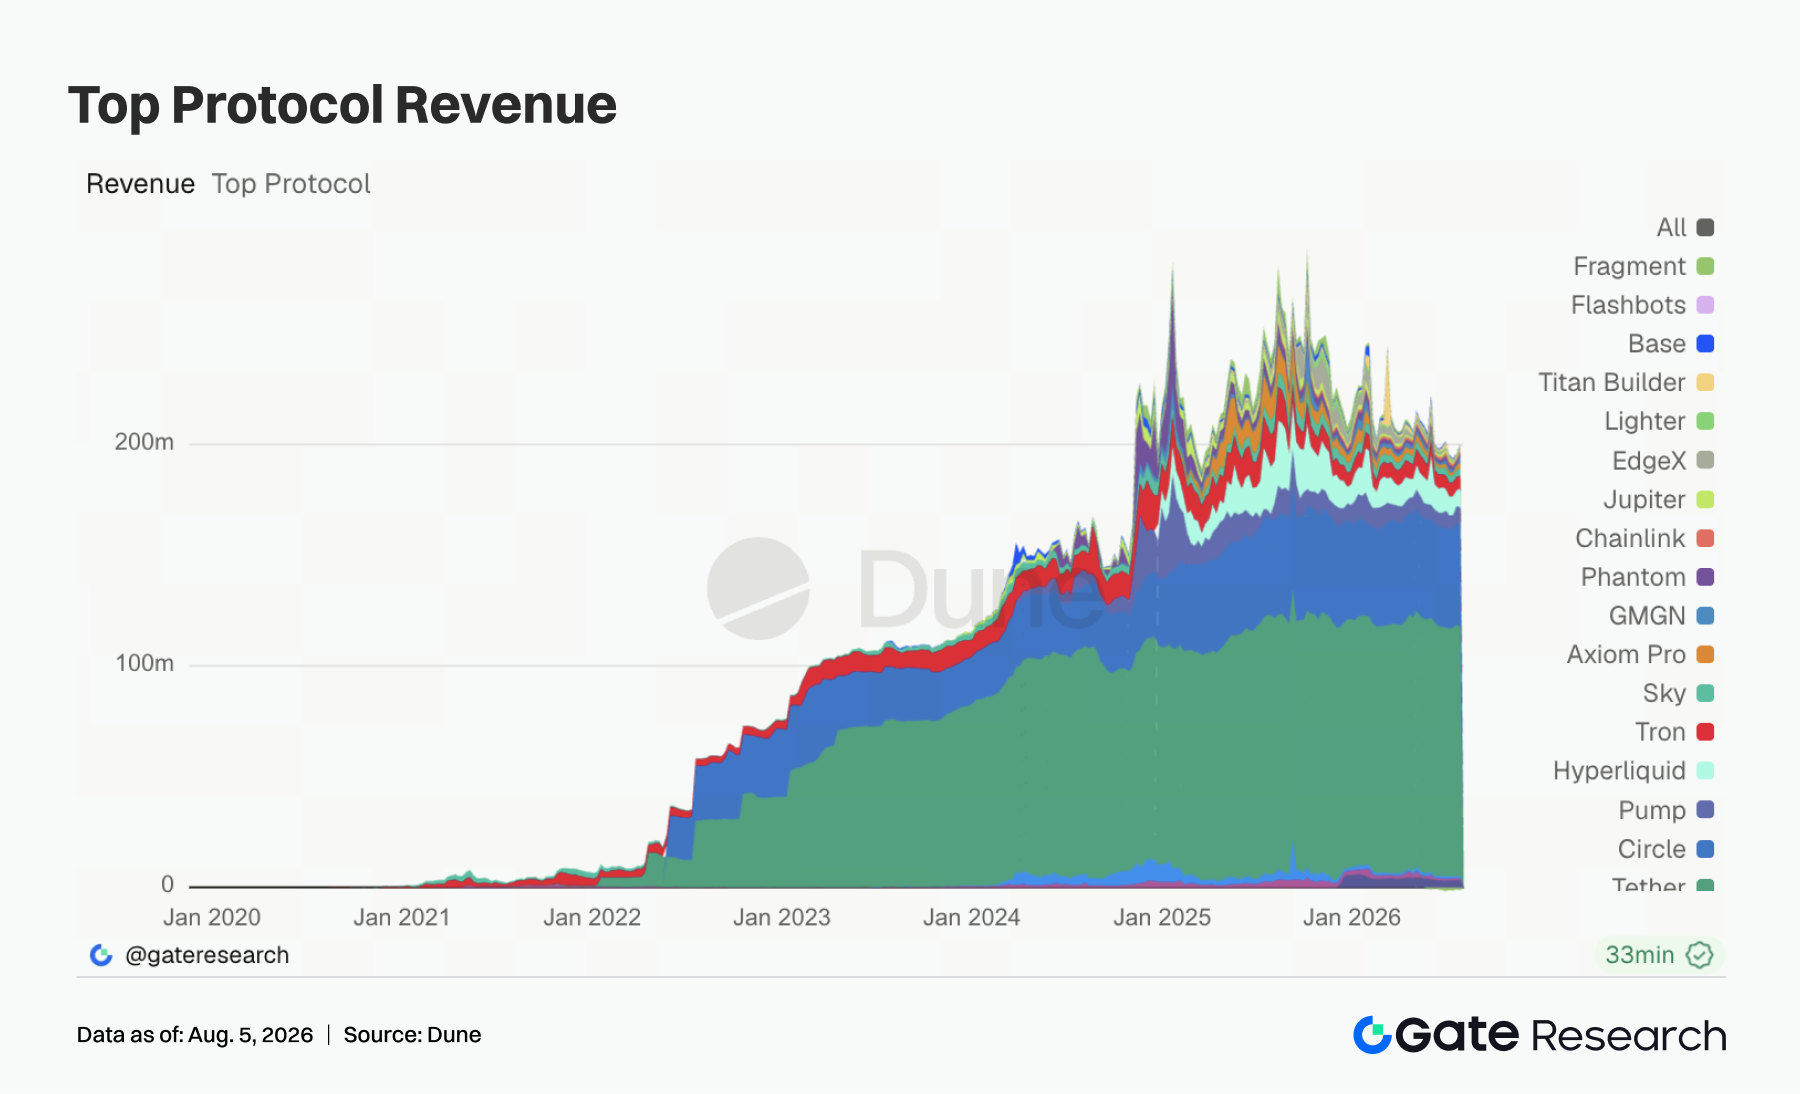
This week, the protocol revenue structure showed divergence. Tether and Circle recorded approximately $113 million and $44.77 million in revenue respectively, serving as the industry's revenue foundation, though slightly lower than the prior week. Pump revenue rose to approximately $9.23 million, continuing to exceed Hyperliquid, corroborating the recovery in PumpSwap volume and Pump.fun trading activity. Hyperliquid revenue rose to approximately $8.34 million, but growth was weaker than on-chain TradFi perp volumes, indicating that platform trading volume expansion does not necessarily translate equally into protocol revenue elasticity. Axiom Pro and GMGN saw substantial revenue increases, reflecting renewed benefits for short-term trading tools, meme discovery, and high-frequency wallet entry points. Lighter, EdgeX, Aerodrome, and Aave also improved, with Base and Titan Builder rebounding modestly.
4. Derivatives Tracking
4.1 BTC Funding Rates Remain Positive but Price Pulled Back; OI Spiked Then Fell, Indicating Cooling Leverage Chasing
Over the past week, BTC's price showed a spike-and-pullback pattern overall. At the start of the week, prices held around $64,000, testing near $66,000 around July 29 before failing to sustain a breakout, and pulling back to around $63,000 from July 31 to August 2. Overall, prices remain in a high-level consolidation range, but upward momentum weakened versus the prior week. Meanwhile, OI showed a clear spike followed by a decline. Around July 27, OI was approximately $22 billion, rising above $22.5 billion near July 29 and holding at elevated levels around July 30. However, as prices pulled back, OI gradually declined to around $22 billion, indicating that some leveraged positions involved in the breakout attempt began to exit.
Funding rates remained positive throughout the week, mostly in the 0.003–0.007 range, briefly rising to weekly highs around July 29, reflecting that bullish sentiment remained dominant. Notably, funding rates did not turn negative during the price decline, indicating that the market has not formed an overcrowded short structure, with some long positioning still being maintained.
In summary, this week's BTC derivatives market exhibited a combination of "price spike-and-pullback + OI high-level decline +


