






ArkStream Capital: From AI Capital Drain to RWA Ascent — The 2026 Crypto Capital Migration


- Core Thesis: The crypto market's weakness in the first half of 2026 stems primarily from the Fed's hawkish policy pivot, supply-side inflation triggered by the US-Iran conflict, and AI equities siphoning liquidity — not from internal industry failures. During the same period, RWA (Real-World Asset tokenization) was the only sector to maintain net inflows, with on-chain volumes growing from $21.6 billion to $33 billion. Demand for traditional asset trading rails has risen sharply. The report suggests that the equity market's capital drain effect on crypto may have peaked in June, potentially marking the start of a slow recovery phase.
- Key Factors:
- Triple Macro Shocks: Following the Fed leadership change, rate cut expectations have fully reversed, with half of officials favoring hikes in the June dot plot; the Strait of Hormuz blockade drove oil prices up, pushing CPI to 4.2% YoY and creating supply-side inflation; global capital is flocking to "physical bottlenecks" (HALO trades), while crypto assets face reduced allocations due to their lack of cash flows and hedging instruments.
- AI Sector Rotation: Korean equities surged 101.1% in H1 (Samsung/SK Hynix now account for 61% of KOSPI market cap), Taiwanese equities rose 59.3%, while US equities gained only 9.6%; memory chips (+243.9%) and PCBs (+282.8%) led gains, while AI software applications (-33.2%) and cloud providers (-5.9%) declined — capital has shifted from "technological conviction" to "hardware bottleneck" validation.
- Super-IPO Drain Effect: SpaceX, OpenAI, and Anthropic are targeting combined IPO fundraising of over $200 billion (more than 4x the total US IPO volume in 2025). Notably, OpenAI reported $9.3 billion in Q1 operating losses (losing $1.60 for every $1 earned), and these massive losses will face public market scrutiny for the first time, potentially triggering a tech valuation reset.
- RWA's Counter-Cyclical Growth: On-chain RWA grew 53% in six months to $33 billion (excluding stablecoins), while DeFi TVL fell from $115 billion to $70 billion over the same period; among the four tokenized equity models, RWA perpetual futures saw the fastest growth, with trading volume surging from $12.37 billion in Q4 2025 to $203 billion in Q2 2026 (a 20x QoQ increase).
- Binance's RWA Product Line Explosion: TradFi perpetual futures launched at the end of January and already captured 10.3% of platform perpetual trading volume by June; CEX equity derivatives hit a record $11.6 billion in weekly trading volume; both Binance and Hyperliquid show exponential RWA trading growth, while crypto spot volume fell 40% from January to May — capital is migrating from "coins" to "traditional asset rails."
- Dual-Track Regulation: The securities track (FINRA issued the first custody license to Securitize) and the stablecoin track (GENIUS Act, Hong Kong's Stablecoins Ordinance, and the EU's MiCA) are advancing in parallel, creating a "regulatory tripartite" globally and pushing the industry from gray areas toward licensed operations.
TL;DR
The following analysis and judgments are based on market data as of the end of Q2 2026 and the prevailing market environment at that time.
In the first half of 2026, the weakness in Crypto was not driven by internal industry blowups, but rather by the Fed's hawkish policy pivot, supply-side inflation triggered by the US-Iran war, and the continued siphoning of global liquidity by AI stocks. Meanwhile, returns from the AI rally are shifting from chip leaders, cloud providers, and software application layers, concentrating towards physical supply chain bottlenecks such as memory and PCB. The three mega-IPOs will further test AI's high valuations and high cash-burn models.
Against the backdrop of overall DeFi contraction, RWA emerged as one of the few areas in Crypto maintaining net inflows: on-chain scale grew from approximately $21.6 billion at the start of the year to $33 billion, with tokenized stocks and RWA perpetual contracts growing the fastest. Demand for "coins" is weakening, but demand for trading traditional assets like stocks and commodities via Crypto infrastructure is rising rapidly. Our assessment is that the US stock market's siphoning effect on Crypto may have peaked in June 2026; barring any significant new negative developments in the industry, the market may have entered a phase of slow recovery.
Macro Environment: Policy Pivot and Geopolitical Shocks
This section revolves around three main threads: the complete reversal of monetary policy expectations from "rate cuts" to "rate hikes" following the Fed leadership change, the persistent disruption of the US-Iran war on energy and inflation chains, and global capital's flight to safety amidst Sino-US competition. Together, these factors determined the pricing environment for all risk assets this quarter and explain why the crypto market weakened independently while global stock markets rallied.
We define the macro environment of H1 2026 as "asset pricing divergence under a triple shock": the shift in monetary policy, ongoing geopolitical conflict, and extreme capital concentration in the AI trade. These three factors acted simultaneously, causing the largest divergence in asset performance this cycle under the same interest rate and liquidity conditions. The Dow Jones index hit record highs at the end of the quarter, South Korea's KOSPI rose over 100% in H1, while Bitcoin fell approximately 20.5% in June alone, and the Crypto Fear & Greed Index dropped to 15—a degree of divergence rarely seen in major asset class comparisons over the past decade. Understanding the reasons for this divergence is a prerequisite for understanding the crypto market's performance this quarter.
Fed Leadership Change: From "When Will Rates Be Cut" to "Will Rates Be Hiked"
In Q4 2025, the market merely experienced a cooling of rate cut expectations; in H1 2026, the entire rate cut narrative was completely overturned. This reversal wasn't caused by a single meeting or data point—it took two full quarters to gradually erode the optimistic expectations held at the start of the year.
The Three Months of Expectation Reversal
In January, the market's mainstream pricing for 2026 was still "two to three rate cuts," with CME rate futures even suggesting the first cut would land in Q2. At the April FOMC meeting, dissenting votes reached a record high not seen since 1992, with at least five officials publicly stating that the next policy move could be a hike. In May, Kevin Warsh officially succeeded Powell as Fed Chair. By June, half of the officials on the dot plot had moved to the hiking camp. Within six months, the market had changed its pricing from "two to three cuts" to "at least one hike this year."
Among these developments, Kevin Warsh's stance shift was particularly notable: at his confirmation hearing, he criticized the Fed's "deadly policy mistakes" between 2021 and 2022, and had previously expressed willingness to lower rates, believing excessively high rates were harming economic vitality—based on this track record, the market had labeled him as dovish. But the data didn't give him that opportunity: in April, US real wages fell 0.5% month-over-month, the first decline in nearly three years, putting inflation's impact on household purchasing power front and center; May price data deteriorated across the board. His first major decision wasn't "whether to cut rates," but "how to avoid being dragged into the rate hike debate."
June FOMC: A Watershed in Macro Narrative
The June 16-17 meeting was a watershed for the quarter's macro narrative. The decision itself was uneventful: the federal funds rate was held at 3.50%–3.75% for the fourth consecutive meeting, unchanged since the last cut in December 2025. What truly stirred the markets were three unconventional signals.
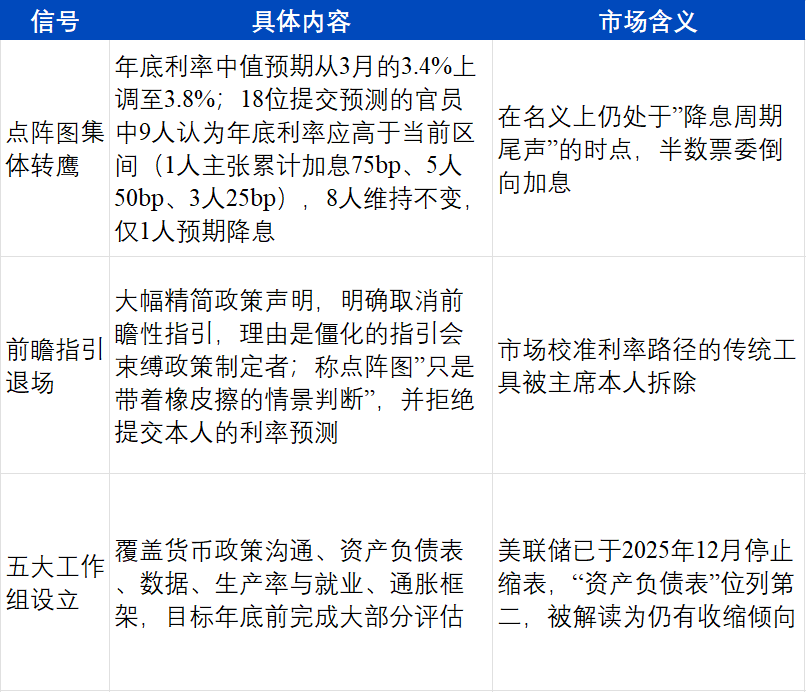
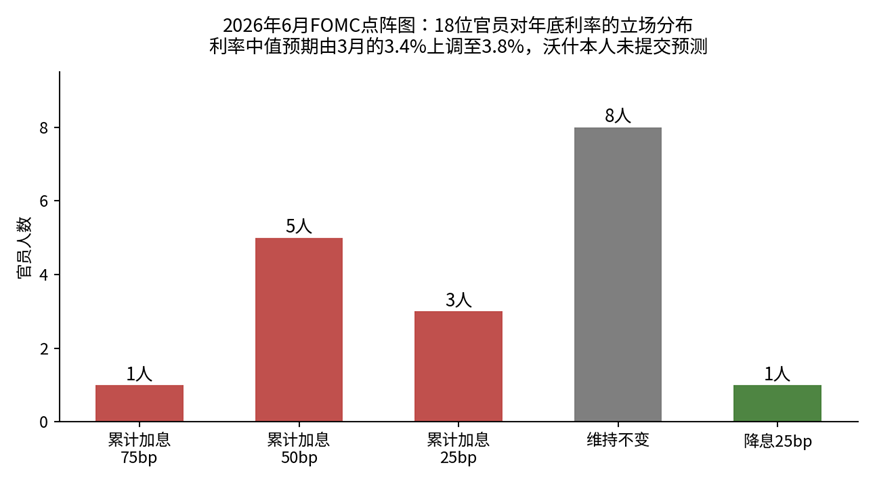
June 2026 FOMC Dot Plot Stance Distribution (Fed SEP, compiled by ArkStream)
In the concurrently released Summary of Economic Projections (SEP), officials lowered the median 2026 real GDP growth forecast to 2.2%, nudged the unemployment rate expectation to 4.3%, and raised short-term inflation expectations. Growth revised down, inflation revised up, rates revised up—three arrows pointing to the same word: stagflation concerns.
ArkStream Capital believes the combined weight of these three signals matters more than the question of "whether to hike." Over the past decade-plus, the market has pieced together a complete toolkit for calibrating the rate path using the dot plot, forward guidance, and the chair's press conferences. The first thing Warsh did upon taking office was systematically dismantle the credibility of this toolkit. With the calibration tools gone, volatility in rate expectations could only rise passively, leading to the chaotic pricing of risk assets this quarter—especially high-beta assets (in previous quarterly reports, we classified BTC-led crypto assets into this category).
The Two Faces of Data: Sticky Inflation and Wavering Employment
Supporting the hawkish pivot was a substantive deterioration in price data. May CPI rose 4.2% year-over-year, up 0.5% month-over-month, with energy being the primary driver; PPI final demand surged 6.5% year-over-year, up 1.1% month-over-month, with final demand goods prices rising 2.8%—war-driven production cost increases were still transmitting downstream.
However, the internal structure of inflation was uneven, which is crucial for judging the policy path. Core CPI was 2.9% year-over-year, up 0.2% month-over-month, still manageable; Dallas Fed research showed a clear divergence between core PCE (approximately 3%) and trimmed mean PCE excluding extreme components (approximately 2.3%), indicating that this round of pressure was highly concentrated in supply-shock-affected categories like energy and transportation, and had not yet broadly spread to services and wages.
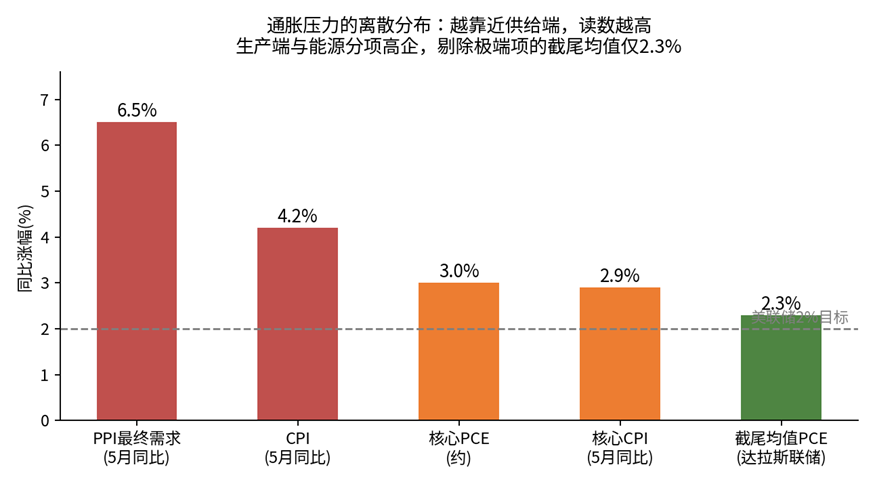
Dispersion of US inflation components in H1 2026 (BLS, Dallas Fed, compiled by ArkStream)
The trigger for this round of inflation was the US-Iran war and the closure of the Strait of Hormuz.
On the employment front, the quarter played out like a reversal drama:
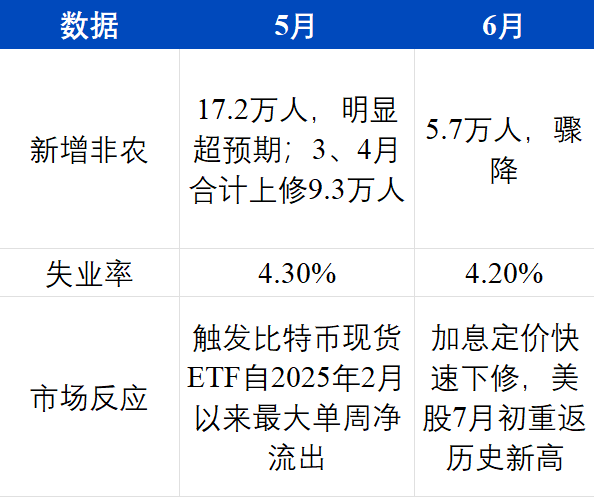
The May jobs report—"too strong to even discuss rate cuts"—directly ignited rate hike expectations; by June, disrupted by the World Cup and holiday timing effects, market pricing swung back and forth: after the June FOMC, CME data showed the probability of an October hike briefly rose to 60.7%, with money markets fully pricing in a 25 basis point hike in December; then June's non-farm payrolls, combined with Warsh's softening remarks at the ECB forum that "inflation expectations have eased somewhat over the past four weeks," caused hike pricing to quickly retreat.
Market divergence was equally rare: Bank of America predicted 25bp hikes in September, October, and December, with year-end rates reaching 4.25%–4.50%; Huatai Securities assigned nearly a 50% probability to a December hike; CICC and CITIC maintained their view of no hikes and no cuts this year. Three top-tier institutions reading three different directions from the same data set—this has rarely been seen in the past decade of Fed watching.
In our Q1 report, we cautioned that "the rate inflection point itself faces the risk of being overturned, and zero cuts or even hikes throughout the year is a scenario that needs to be taken seriously." This scenario became reality in Q2, evolving beyond our initial estimates. Continuing our analysis of the interest rate-Bitcoin correlation: the three rate cuts from end-2024 to 2025 constituted the "easing trade period," Q4 2025 entered the "expectation digestion period," and Q2 2026 formally entered the fifth phase—the rate hike expectation period. The most troublesome aspect of this phase is two-way volatility: every swing in rate expectations is replicated by high-beta assets with amplified amplitude, raising the cost of both long and short positions simultaneously. As prices swing back and forth, capital is forced to the sidelines.
Why the Removal of Forward Guidance Is Especially Damaging to Crypto
This point deserves separate attention because its impact on different assets is asymmetric.
For traditional assets, the disappearance of forward guidance mainly means increased difficulty in duration management. Institutions can respond by shortening duration, increasing hedging, and raising cash ratios—the financial toolkit is complete. But crypto asset pricing relies heavily on the "direction of discount rate expectations" and lacks hedgeable interest rate instruments—there are no Bitcoin interest rate swaps, no duration-matched crypto fixed income products. The only thing institutions can do is reduce positions. In other words, when macro visibility declines, traditional assets adjust their structure; crypto assets can only reduce allocation.
This explains a counterintuitive phenomenon this quarter: the June FOMC didn't actually hike rates—not a single basis point moved—yet crypto assets reacted with far greater intensity than US equities. The market never trades the current interest rate level; it trades the confidence interval of the future rate path. When that confidence interval is actively widened, the first assets to be sold are those on the most marginal end of the risk budget sheet with the fewest hedging tools. This is further validation of our Q1 assertion that "crypto has not yet regained its macro pricing power": until the Fed's communication framework is rebuilt, the crypto market will struggle to regain control of its own pricing.
The US-Iran War: An Uncontrollable Variable and Supply-Shock Inflation
The US-Israel military action against Iran, which began on February 28, did not conclude in Q2; instead, it dragged into a war of attrition.
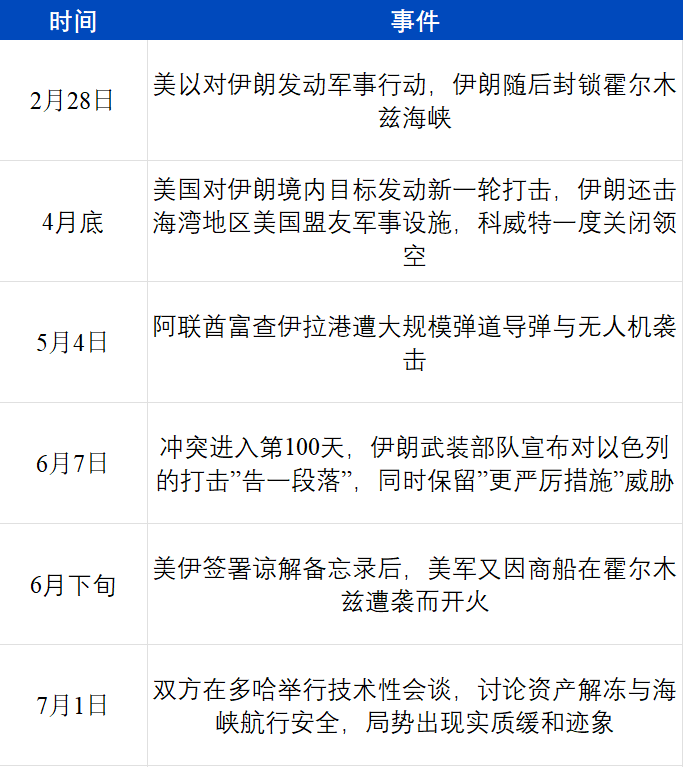
For financial markets, the transmission path of this war is singular, but brutally straightforward: Strait of Hormuz closure → forced production cuts by Middle Eastern oil producers → oil price spikes → higher CPI energy component → rate cut expectations cleared, rate hike expectations rise → global risk assets de-rated.
Every link in this chain has concrete numbers, directly reflected in financial market pricing. On the supply side, southern Iraqi oil field production was slashed from 4.3 million barrels per day to 1.3 million, with the Rumaila field alone cutting 700,000 barrels; official warnings indicated cuts could expand to over 3 million barrels within days if exports remained blocked. Kuwait Petroleum Corporation declared force majeure, QatarEnergy suspended LNG production and transport, and Saudi Arabia's largest Ras Tanura refinery closed after a drone attack. Shipping details are even more telling: multiple international insurers cancelled war risk coverage for vessels in high-risk waters, some routes were forced to detour around the Cape of Good Hope adding two weeks to each journey, and several Very Large Crude Carriers (VLCCs) carrying 6 million barrels of crude remained stranded in the Persian Gulf for over two months before finally exiting the strait around May 20. Asian refineries were forced to find alternatives—India's MRPL issued a force majeure notice cutting production by 20-30%, Japan and Indonesia increased US crude purchases, and the US Treasury granted Indian refineries a 30-day sanctions waiver for Russian oil.
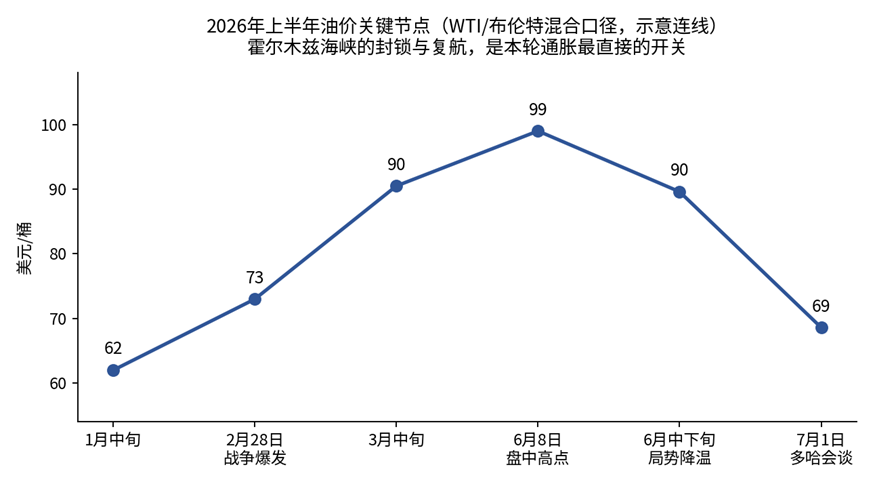
Key oil price milestones in H1 2026 (CME Group, compiled by ArkStream)
Efforts to hedge the supply gap were ongoing: the IEA organized 32 member countries to jointly release 400 million barrels of strategic reserves, with 164 million barrels released as of May 8; OPEC+ announced production increases for four consecutive months, with July's increment at 188,000 barrels per day. But with the strait closed, these increases were nearly futile—if oil can't be shipped out, quotas are meaningless. Demand was also being eroded by high prices; the IEA slashed its 2026 global oil demand growth forecast from +1.2 million barrels per day pre-war to -420,000 barrels per day. South Korea even reinstated vehicle odd-even license plate restrictions in the public sector.
A comparison with the 2022 Russia-Ukraine conflict highlights this time's uniqueness. In 2022, the Fed's response to surging oil prices was aggressive rate hikes, going from zero to over 5%—policy space was ample, direction was clear, and while the market suffered, at least the script was known. This time, the situation is far more awkward: rates are already at 3.5%–3.75%, yet inflation is re-emerging due to exogenous shocks. The Fed lacks sufficient room to hike, and has lost the tailwind script of "inflation falling—cut rates accordingly." Compounding the problem, the 2022 supply shock primarily hit European gas and grain, with US domestic energy self-sufficiency providing a buffer, whereas the Strait of Hormuz handles roughly one-fifth of global seaborne oil—there's no buffer space.
For the crypto market, the experience of these two shocks also differs. In 2022, Bitcoin's decline coincided with a cascade of industry blowups (Terra, Three Arrows, FTX), making it difficult to distinguish internal from external causes. This time, no credit events of similar magnitude occurred within the industry, and no major players collapsed to clear the market—the decline was almost purely an external pricing outcome.
This round of inflation is driven by supply shocks. Rate hikes can't end the US-Iran war, and they can't reopen the Strait of Hormuz, but rate hikes are the only tool the Fed has. The mismatch between policy tools and inflation catalysts will likely prolong the duration of high rates—this is our most important judgment on the H2 macro outlook.
Sino-US Competition and Global Capital's "Avoiding What's Heavy, Embracing What's Light"
The Trump administration rolled out "secondary tariff" policies during the quarter. Tariffs and war constituted dual sources of cost shocks, both acting on the supply side and both unsolvable by monetary policy.
China maintained neutrality in the conflict, keeping the direct impact of the strait closure manageable through diversified energy procurement.
The Sino-US competition plays out in supply chains rather than energy, and this layer is directly linked to the AI mainline in Part 2 of this report. In H1, export controls on advanced process nodes, semiconductor equipment, and key materials continued to tighten, while China accelerated its computing autonomy efforts—DeepSeek V4 Pro achieved full-stack training on Huawei Ascend chips, and Zhipu GLM-5 became the first frontier model trained entirely on domestic chips. The outcome isn't one side winning, but the global AI supply chain being forced from a "single optimal solution" to "two parallel systems," each needing to stockpile inventory, expand capacity, and hoard critical production capabilities. This is one of the deeper reasons behind the historic memory shortage: demand isn't just from AI growth itself, but compounded by duplicate construction and strategic stockpiling driven by geopolitical uncertainty.
In such an environment, global capital's choice is "avoiding the heavy and embracing the light"—avoiding assets with high valuations, distant cash flows, and liquidity sensitivity, while embracing tangible, physical bottlenecks. The market even coined a new term: HALO trades (Heavy Assets, Low Obsolescence)—going long energy, raw materials, and infrastructure industries that AI can't replace and that possess physical moats. The underlying logic of why this global AI rally's gains were ultimately "squeezed dry" by mid-to-upstream segments like memory, rather than captured by cloud providers and software application layers, is the same as HALO trades.
As for crypto assets, in most traditional investors' cognitive frameworks, it sits at the opposite end of this asset spectrum: no cash flows, no physical moats, highly sensitive to interest rates. The ultimate result of the triple macro shock was crypto assets declining alone amidst a global rally in risk assets. Bitcoin fell approximately 20.5% in June, closing the month at $60,760, just a hair above its 52-week low of $





