ArkStream Capital: When Binance Becomes "Stockbinance," Crypto Is Undergoing an Unprecedented Transformation


- Core View: In Q3 2026, the crypto market rebounded amid macro headwinds—the US-Iran conflict pushing oil prices higher, the Fed raising rates, and Treasury yields climbing to a 19-year high. Bitcoin rose 42%, but capital was highly concentrated in the ETF channel. This RWA bull market was driven primarily by incremental trading volume in RWA perpetual contracts such as equities. The meme bull market came to an end, and tokens with protocol revenue and sustained buyback capacity became the core screening criteria.
- Key Elements:
- Brent crude rose from $73.74 to above $108, gasoline was up 27.4% year-over-year, and one-year inflation expectations climbed to 4.6%. The Fed completed its first rate hike since 2023, and the 10-year Treasury yield rose to 5.25%.
- Bitcoin moved in tandem with the Nasdaq, decoupling from gold (rolling correlation coefficient of -0.17). On September 21, both hit stage highs on the same day; on September 28, both fell on the same day.
- In Q3, Bitcoin rose 42% to $83,161, but the Altcoin Season Index fell back to 39, and Bitcoin's market dominance remained around 60%. New capital primarily entered through spot ETFs.
- Binance RWA perpetual contract trading volume reached $547.7 billion in Q3, more than 4x that of Q2, accounting for 11.7% of its total perpetual trading volume. Of the 134 new trading instruments listed on Binance in Q3, 123 were TradFi-related.
- On-chain RWA scale reached $34.18 billion, up 85.2% year-to-date; tokenized equities reached $4.43 billion, up 390.4% year-to-date.
- After the launch of Robinhood Chain and Circle Arc, trading was still dominated by memes and token launch platform tokens, with stock tokens accounting for only about 6% of total value locked.
- Buyback-type tokens rose an average of 78.6% in Q3, outperforming Bitcoin (42.6%) and other altcoins. Protocol revenue and buyback sustainability became key valuation metrics.

TL;DR
1. The recurring US-Iran conflict pushed oil prices higher, gasoline prices drove inflation expectations upward, and the Fed completed its first rate hike since 2023 in September.
2. Bitcoin moved in tandem with tech stocks represented by the Nasdaq, decoupling from gold, while oil prices and interest rates remained the primary variables affecting Bitcoin.
3. In a third quarter filled with bearish news, Bitcoin rose 42%, but capital entered Bitcoin primarily through ETFs, and the meme bull market is gone for good.
4. On the corporate chains of Robinhood and Circle, trading remained dominated by memes, and corporate chains have yet to introduce new asset classes.
5. This RWA bull market was primarily reflected in RWA perpetual contracts for stocks and other assets, which was the primary source of trading volume growth in the crypto industry in 2026.
6. Tokens with protocol revenue and ongoing buybacks significantly outperformed other altcoins in Q3, and the sustainability of protocol revenue will become a more important screening criterion.
Preface
In the third quarter of 2026, the Federal Reserve completed its first rate hike since 2023 with a 12-0 vote, the US Senate rejected the procedural motion on the CLARITY Act with a 49-50 vote, Brent crude twice surpassed $100, closing at $108.50 on September 28; the US 10-year Treasury yield rose to 5.25% on September 28, the highest since June 2007. Yet in a third quarter marked by a steady stream of bearish news, the cryptocurrency market posted substantial gains. During the same period, Bitcoin rebounded from a 21-month low of approximately $57,800 in early July to $87,397 on September 21, a gain of about 51%, before falling back to around $83,000 on September 28; US spot Bitcoin ETF cumulative year-to-date flows turned from net outflows to net inflows in September; the Nasdaq Composite closed at 27,122.09 on September 21, its first record close since June.
We will discuss this in three parts: how the US-Iran conflict transmitted through oil prices, inflation, and interest rates to financial markets, and how stocks, gold, and Bitcoin performed within that framework; the crypto market's recovery in Q3, and what assets were actually being traded on the corporate chains launched by Robinhood and Circle; and Crypto's path toward RWA integration.
Macro Environment: From Oil Prices to Interest Rates
The macro environment changes this quarter can be viewed along a chain: recurring escalation of the US-Iran conflict → oil prices rising again → gasoline prices pushing up inflation and inflation expectations → Fed rate hikes, Treasury yields climbing → price volatility across financial assets including stocks, gold, and Bitcoin.
In July and September, the US-Iran conflict escalated twice, with Brent crude rising from $73.74 in late June to $108.35 in mid-September; gasoline prices rose 27.4% year-over-year in August, headline CPI rose 0.4% month-over-month, consumer inflation expectations for the next year rose to 4.6%; the Fed raised rates by 25 basis points in September, with 16 of the 19 officials participating in rate projections (12 of whom have voting rights) expecting another hike within the year; the 10-year Treasury yield rose to 5.25% on September 28, and the 30-year rose to 5.56% on September 29. Each time oil prices pulled back, stocks and Bitcoin rose accordingly; each time the conflict escalated, all three asset classes came under pressure together. On September 21, oil prices fell below $100, and the Nasdaq and Bitcoin both hit stage highs on the same day; on September 26, Trump rejected Iran's proposal to reopen the strait, and on September 28, oil prices returned to $108, with the Nasdaq, gold, and Bitcoin all falling simultaneously. We will break down each link in this chain to see how the macro environment ultimately affects financial markets and cryptocurrencies.
US-Iran Conflict, Oil Prices, and Inflation
At the end of Q2, US-Iran negotiations progressed, oil tankers resumed passage through the Strait of Hormuz, and Brent crude closed at $73.74 on June 24, the lowest close since the conflict erupted on February 28. In Q3, the conflict escalated repeatedly, and oil prices surged repeatedly in response.
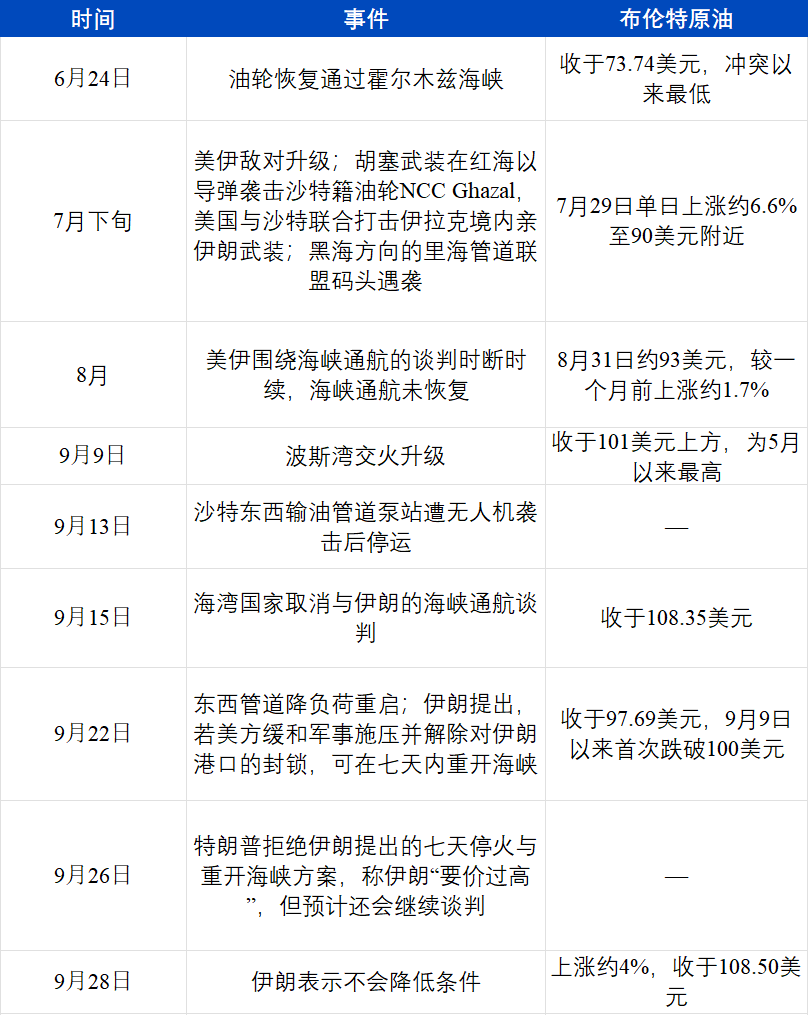
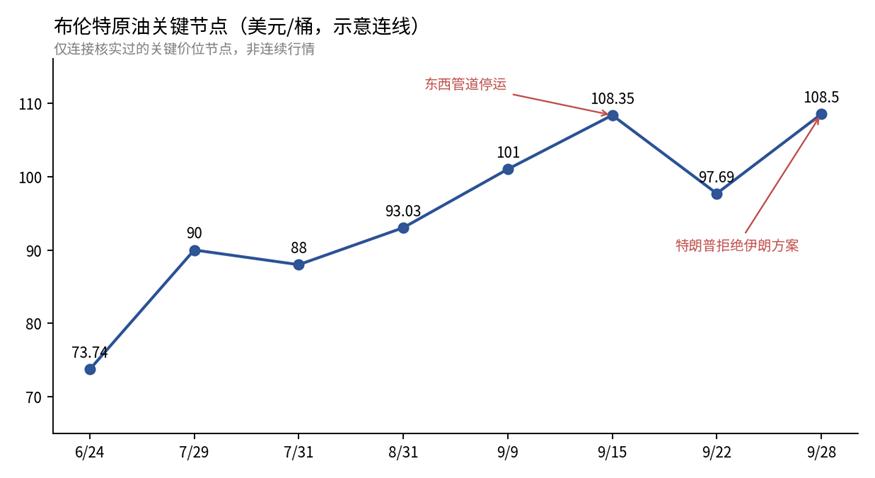
Key Brent Crude Milestones in Q3 2026 (Compiled by ArkStream)
Oil price increases were first reflected in gasoline prices. In August, US gasoline prices rose 3.9% month-over-month and 27.4% year-over-year, contributing more than one-third of the month's headline CPI increase; the energy sub-index rose 2.1% month-over-month.
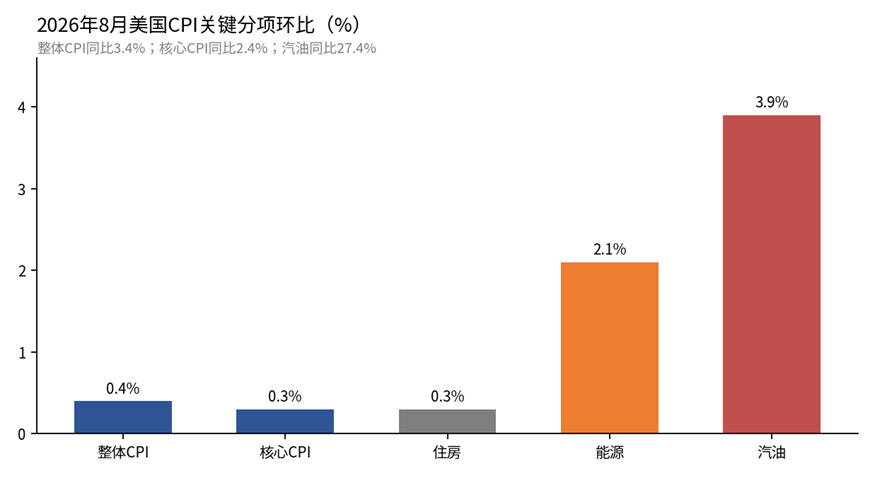
Key US CPI Sub-Indices Month-over-Month, August 2026 (Bureau of Labor Statistics, compiled by ArkStream)
Employment data also delivered a massive shock to the market: August nonfarm payrolls added 162,000 jobs, versus a consensus estimate of only about 53,000, the strongest single-month performance since March, with the unemployment rate holding at 4.1% and approximately 7 million unemployed.
As the nonfarm data was released, inflation expectations had already been priced into financial markets. The University of Michigan's September final reading showed consumer inflation expectations for the next year at 4.6%, the highest since June; five-year inflation expectations rose from 3.3% for three consecutive months to 3.4%. The consumer sentiment index fell to 48.1, with respondents repeatedly citing rising fuel prices as a source of pressure. Inflation expectations in the bond market were relatively stable, with the 10-year breakeven inflation rate at 2.33% in September, far below the April 2022 peak of 3.02%; households and bond investors diverged in their assessments of inflation.
Rate Hikes and Rate Hike Expectations
After the inflation and employment data were released, the Fed completed its rate hike in September.
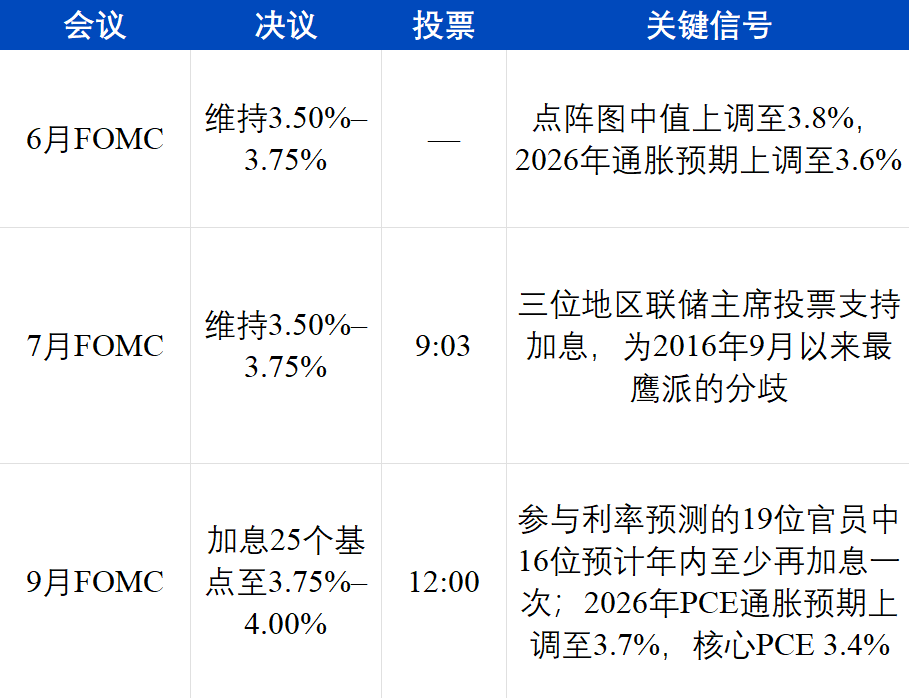
The Fed's stance became progressively clearer across three meetings. The July statement described economic activity as "expanding at a solid pace," with inflation "still elevated relative to the 2% target," attributing this to energy-related supply shocks; the July meeting minutes showed officials believed rate hikes would be necessary if inflation did not cool. The September resolution statement read: "Inflation remains elevated, and today's policy action will support a more timely return of inflation to the 2% target." With the economy expanding, unemployment at around 4.1%, and inflation above target, the Fed ended its wait-and-see approach.
The Fed's assessment of future inflation was equally cautious. The September economic projections raised 2026 PCE inflation from 3.6% to 3.7% and pushed the timeline for inflation returning to 2% out to 2029; 16 officials expected at least one more hike within the year, with 4 expecting two more, and most officials projected rates by the end of 2027 would still be above current levels. Before the September meeting, a rate hike was largely priced in by the market, and post-decision market volatility came primarily from these projections: interest rates above 4% could persist through 2027. The market followed suit: on September 28, CME FedWatch showed approximately 94% probability of at least one more hike before year-end and about 70% probability of a hike in October.
ArkStream Capital believes that the September rate hike confirmed our Q2 assessment: this round of inflation is primarily driven by supply factors such as oil prices, rate hikes cannot reopen the strait, and the duration of high interest rates will likely be extended.
Financial Markets: US Stocks, Gold, and Bitcoin
Changes in interest rates and oil prices ultimately manifested in the prices of three asset classes.
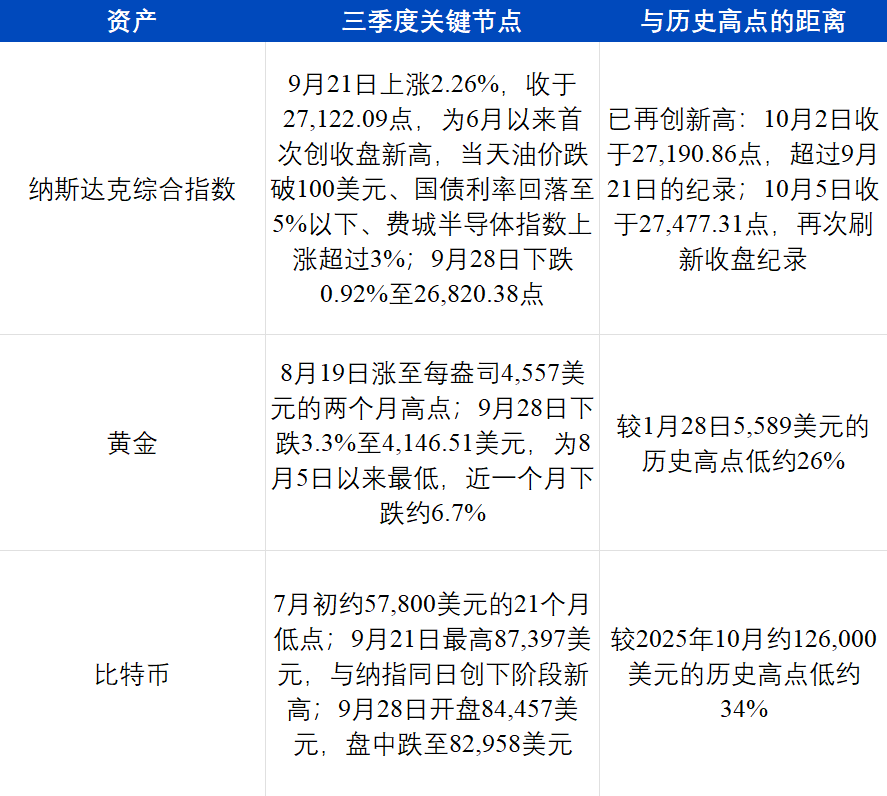
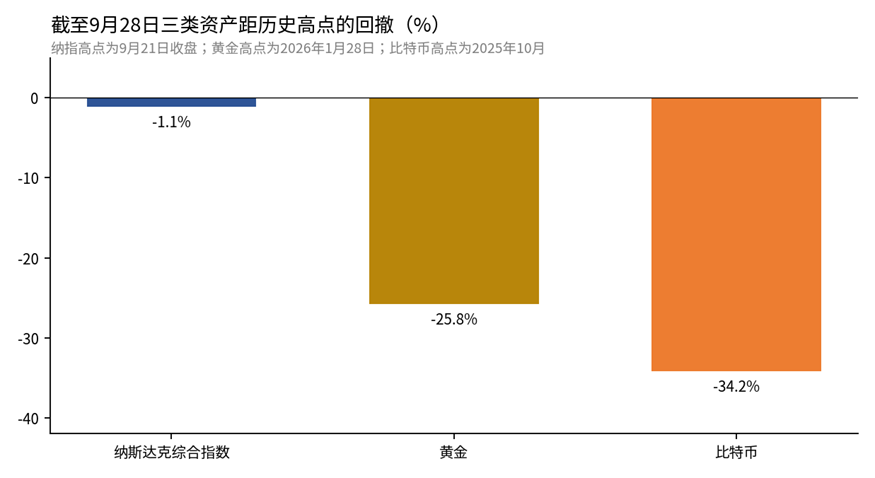
Drawdowns from All-Time Highs for Nasdaq, Gold, and Bitcoin as of September 28, 2026 (Compiled by ArkStream)
The three asset classes performed differently in September. Bitcoin and the Nasdaq both hit stage highs on September 21 and fell together on September 28; gold weakened throughout September. The Nasdaq's September 21 rally was led by chip and AI stocks: Meta rose about 11% that day, AMD and Intel rose 8% to 11%, and AMD's market cap rose to $1 trillion. On September 28, the S&P 500 fell 0.77% to 7,683.69, the Nasdaq fell 0.92%, the Dow Jones fell 0.67%, and Brent crude rose about 4% that day. This is a phenomenon that has recurred over the past year: Bitcoin has decoupled from gold and moved closer to risk assets represented by the Nasdaq.
In terms of price, gold hit an all-time high of $5,589 on January 28, 2026, while Bitcoin had already pulled back from its October 2025 high and subsequently fell to about $57,800 in early July, a maximum drawdown of approximately 54%. The rolling correlation between the two over the past year was -0.17, dipping as low as -0.88 in the spring; during the same period, Bitcoin's correlation with US stocks rose from -0.68 to +0.72 within two weeks. August was an exception: after the Treasury expanded buybacks, discussions about dollar depreciation intensified, Bitcoin and gold briefly rose together, and the 90-day correlation calculated by Grayscale rose from near zero to about 0.5, while Bitcoin's 90-day correlation with the Nasdaq fell from about 0.6 to 0.33. Entering September, gold declined while Bitcoin and the Nasdaq moved in tandem, and the two diverged again. Glassnode's historical data shows that such brief correlation switches typically do not last long.
Bitcoin decoupling from gold and moving in tandem with the Nasdaq, according to ArkStream, is primarily due to four reasons:
Different buyers. Gold's most stable buyers are central banks; global official sector gold purchases totaled 863.3 tonnes in 2025, more than double the 2010–2021 annual average, and this buying is price-insensitive; global gold ETF net inflows hit a record $89 billion that same year. Bitcoin has no central bank buyers, with new capital primarily from spot ETFs and institutional investors; US spot Bitcoin ETF assets total approximately $108.4 billion, and holders overlap heavily with tech stock investors.
Similar reactions to interest rates. Neither Bitcoin nor growth tech stocks offer stable cash dividends, and their valuations depend heavily on future expectations. Both come under pressure when long-term rates rise and benefit when long-term rates fall. On September 21, the Nasdaq and Bitcoin both hit stage highs on the same day, and the primary change that day was oil prices falling below $100 and Treasury yields pulling back; on September 28, both fell simultaneously, with the 10-year Treasury yield rising to a 19-year high that day.
Gold's movements have separate drivers. Gold also generates no interest, and rising rates and a strengthening dollar suppress gold prices; the direct cause of gold's decline in late September was Treasury yields rising to the highest since 2007 and the dollar approaching a two-month high; silver fell about 4.7% to $61.27 the same day. However, gold's medium- to long-term trajectory is also influenced by central bank gold purchases and foreign reserve allocation, factors unrelated to Bitcoin.
Higher leverage. Bitcoin futures and perpetual contract open interest was approximately $61.5 billion in September, and significant price swings trigger cascading liquidations, amplifying gains and losses. This is closer to high-volatility tech stocks and very different from gold.
In summary, the macro level this quarter can be summarized in three points:
1. The US-Iran conflict pushed oil prices higher, and oil prices pushed inflation expectations higher. The US-Iran conflict escalated repeatedly, Brent crude rose from $73.74 to over $108, gasoline prices rose 27.4% year-over-year, and one-year consumer inflation expectations rose to 4.6%.
2. The Fed raised rates and prepared to raise again, with Treasury yields hitting a 19-year high. The policy rate rose to 3.75%–4.00%, the market sees about 94% probability of another hike before year-end; the 10-year Treasury yield rose to 5.25% on September 28, the highest since June 2007.
3. Bitcoin followed the Nasdaq and decoupled from gold. Bitcoin and the Nasdaq hit stage highs on September 21 and fell together on September 28, while gold fell about 6.7% over the past month.
Crypto Market and Corporate Chains
Amid mounting macro pressure this quarter, the crypto market bottomed out and rebounded in Q3. We will examine the crypto market's performance, capital flows reflected in exchange data, and asset activity on the corporate chains launched by Robinhood and Circle to explore where the crypto industry's center of gravity lies.
Crypto Market Performance
In the first two quarters of 2026, the market remained in a bottoming and recovery phase, with thin trading and low leverage appetite. Entering August, market sentiment showed a clear inflection point. On August 18-19, three positive developments emerged in quick succession: First, US Treasury Secretary Bessent announced that long-term Treasury buybacks would be at least doubled, increasing single operations from $2 billion to at least $4 billion, signaling liquidity expectations to the market; second, the US SEC released a draft of the "Regulation Crypto Assets" proposing to allow crypto issuers to raise up to $5 million within four years or up to $75 million annually under an exemption, with disclosure requirements significantly lower than traditional securities offerings, opening the door for compliant issuance in the industry; third, Trump convened crypto industry executives from Coinbase, Gemini, Ripple, Chainlink Labs, and others at the White House for a final push on the CLARITY Act stalled in the Senate (although the CLARITY Act ultimately did not pass). The combination of these three developments triggered a violent short squeeze: Bitcoin rose nearly 8% in two days, briefly approaching $70,000; Ethereum rose 18% to 20% in two days, breaking through $2,250; liquidations within 24 hours totaled approximately $1.9 billion, the vast majority of which were short positions.
This "August 19 rally" drove the entire quarter's recovery. Bitcoin rose 42% overall in Q3, closing the quarter at $83,161; due to the earlier deep decline, it was still down about 5.13% year-to-date, remaining approximately 34% below its all-time high of $126,000, with Q3 being more of a recovery rally to regain lost ground.
But we observed that capital remained concentrated in Bitcoin. During Bitcoin's nearly 25% rise in August, the Altcoin Season Index fell from about 67 in early August to 39 on August 25 (the "altcoin season" threshold is 75), and Bitcoin's market dominance remained around 60% (CoinMarketCap). US spot Bitcoin ETF cumulative year-to-date flows briefly showed net outflows of approximately $5.8 billion in mid-July before turning back to net inflows in late September; total stablecoin market cap fell from approximately $320.6 billion in May to $306.6 billion on September 24 (DefiLlama). New capital entered Bitcoin primarily through ETFs, and on-chain dollars did not increase.
US Stock and Crypto Asset Trading
In our Q2 report, we stated: The moment of maximum impact on Crypto has passed, and the market is slowly recovering. Following the Q2 statistical methodology, we have updated the relevant data through Q3.
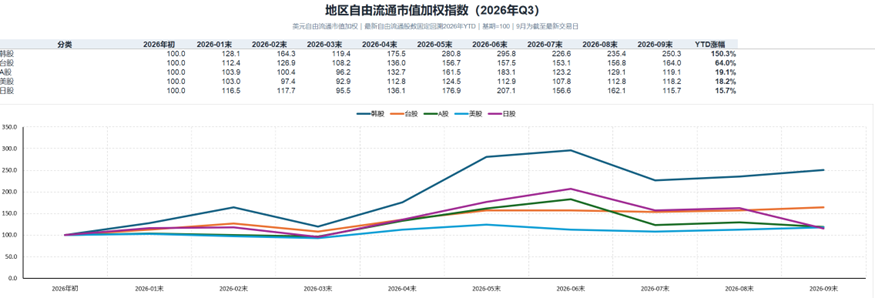
Free-Float Market Cap Weighted Indices of Major Regional Stock Markets in Q3 2026 (Compiled by ArkStream)
The rhythm of