






Gate Research: Structural Market Correction in June, Funds Focus on Impulse Volume Opportunities


- Core Insights: The crypto market experienced a systemic correction in June 2026, with seven out of ten tokens declining. However, a few low-cap, event-driven assets saw extreme gains, leading to distorted market averages. The market exhibits a structural characteristic of "broad-based decline" coexisting with "localized speculation," and has not yet entered a full recovery phase.
- Key Factors:
- Overall market pressure: BTC and ETH monthly declines exceeded 20%, and the total crypto market cap fell by 15.74% during the month. BTC closed the month at approximately $58,519, nearing its yearly low. Spot ETFs continued to see net outflows, with six-week outflows totaling approximately $5B-$6B.
- Widespread decline with high divergence: 70.99% of the Top 500 sample tokens declined, with a median loss of -11.28%. However, the overall sample average was slightly positive due to extreme outliers like CYDX (+35,729%) and ANSEM (+23,901%), presenting a classic case of "mean distortion."
- Mainstream assets not spared: 73 of the Top 100 market cap assets declined. ADA (-38.06%) and BCH (-33.65%) saw significant losses, while leading assets failed to provide a safe-haven function. SOL (-8.81%) showed relative resilience.
- Divergent volume structure: The majority of tokens did not see volume expansion (median only 0.49x), with only 8 tokens recording volume increases exceeding 10x. Strong cases of price and volume rising together (e.g., CX, VELVET, SYN) coexisted with warning signals of volume-driven declines (e.g., ELF, CELO).
- Bearish macro and capital flows: The hawkish stance of the new Federal Reserve Chair weakened rate cut expectations. Combined with geopolitical risks, capital flowed from crypto assets to sectors like AI and semiconductors. DeFi TVL declined by 12.1% to $70.4B during the month, while stablecoin market cap remained flat at highs, suggesting a wait-and-see approach from funds.
Summary
• In June 2026, the crypto market failed to sustain the recovery rally from May, with BTC and ETH falling over 20% month-on-month. Major assets like BNB, XRP, DOGE, and ADA also came under pressure, indicating a systemic contraction in overall market risk appetite.
• The market this month was characterized by "broad declines, strong divergence, and distorted averages." Among the effective sample of the Top 500 tokens, 126 rose, 350 fell, and 17 remained largely flat, with losing assets accounting for 70.99%.
• By market cap tier, the Top 1–100 saw an average decline of -8.35% (median -9.17%), while the Top 401–500 saw an average decline of -11.09% (median -16.67%). Although the average for the Rank 201–400 range was significantly inflated by extreme outliers like CYDX and ANSEM, the majority of tokens still declined, presenting a classic structure of "a handful of extreme rallies masking widespread retreats."
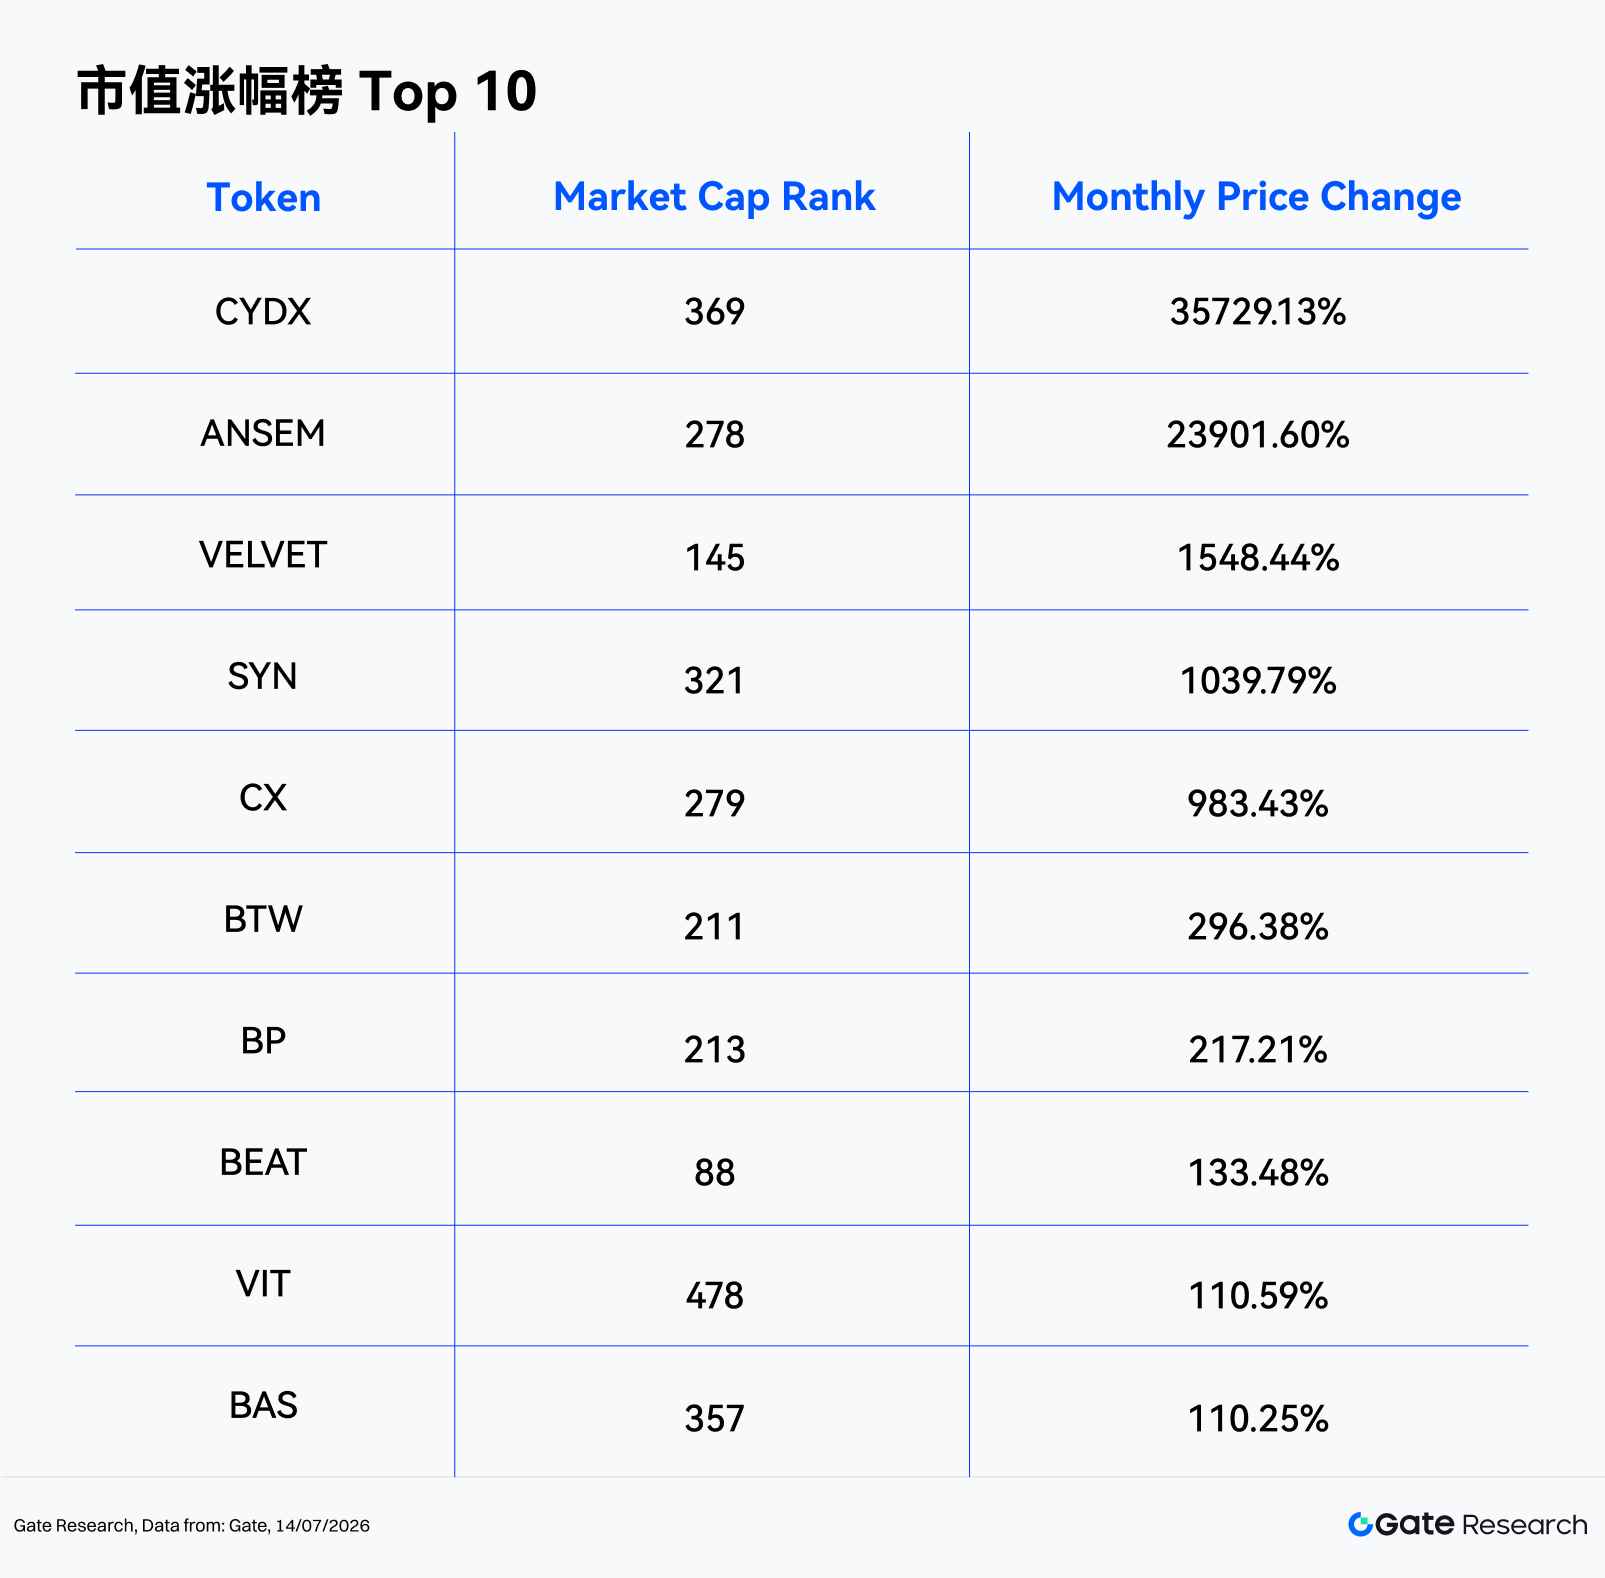
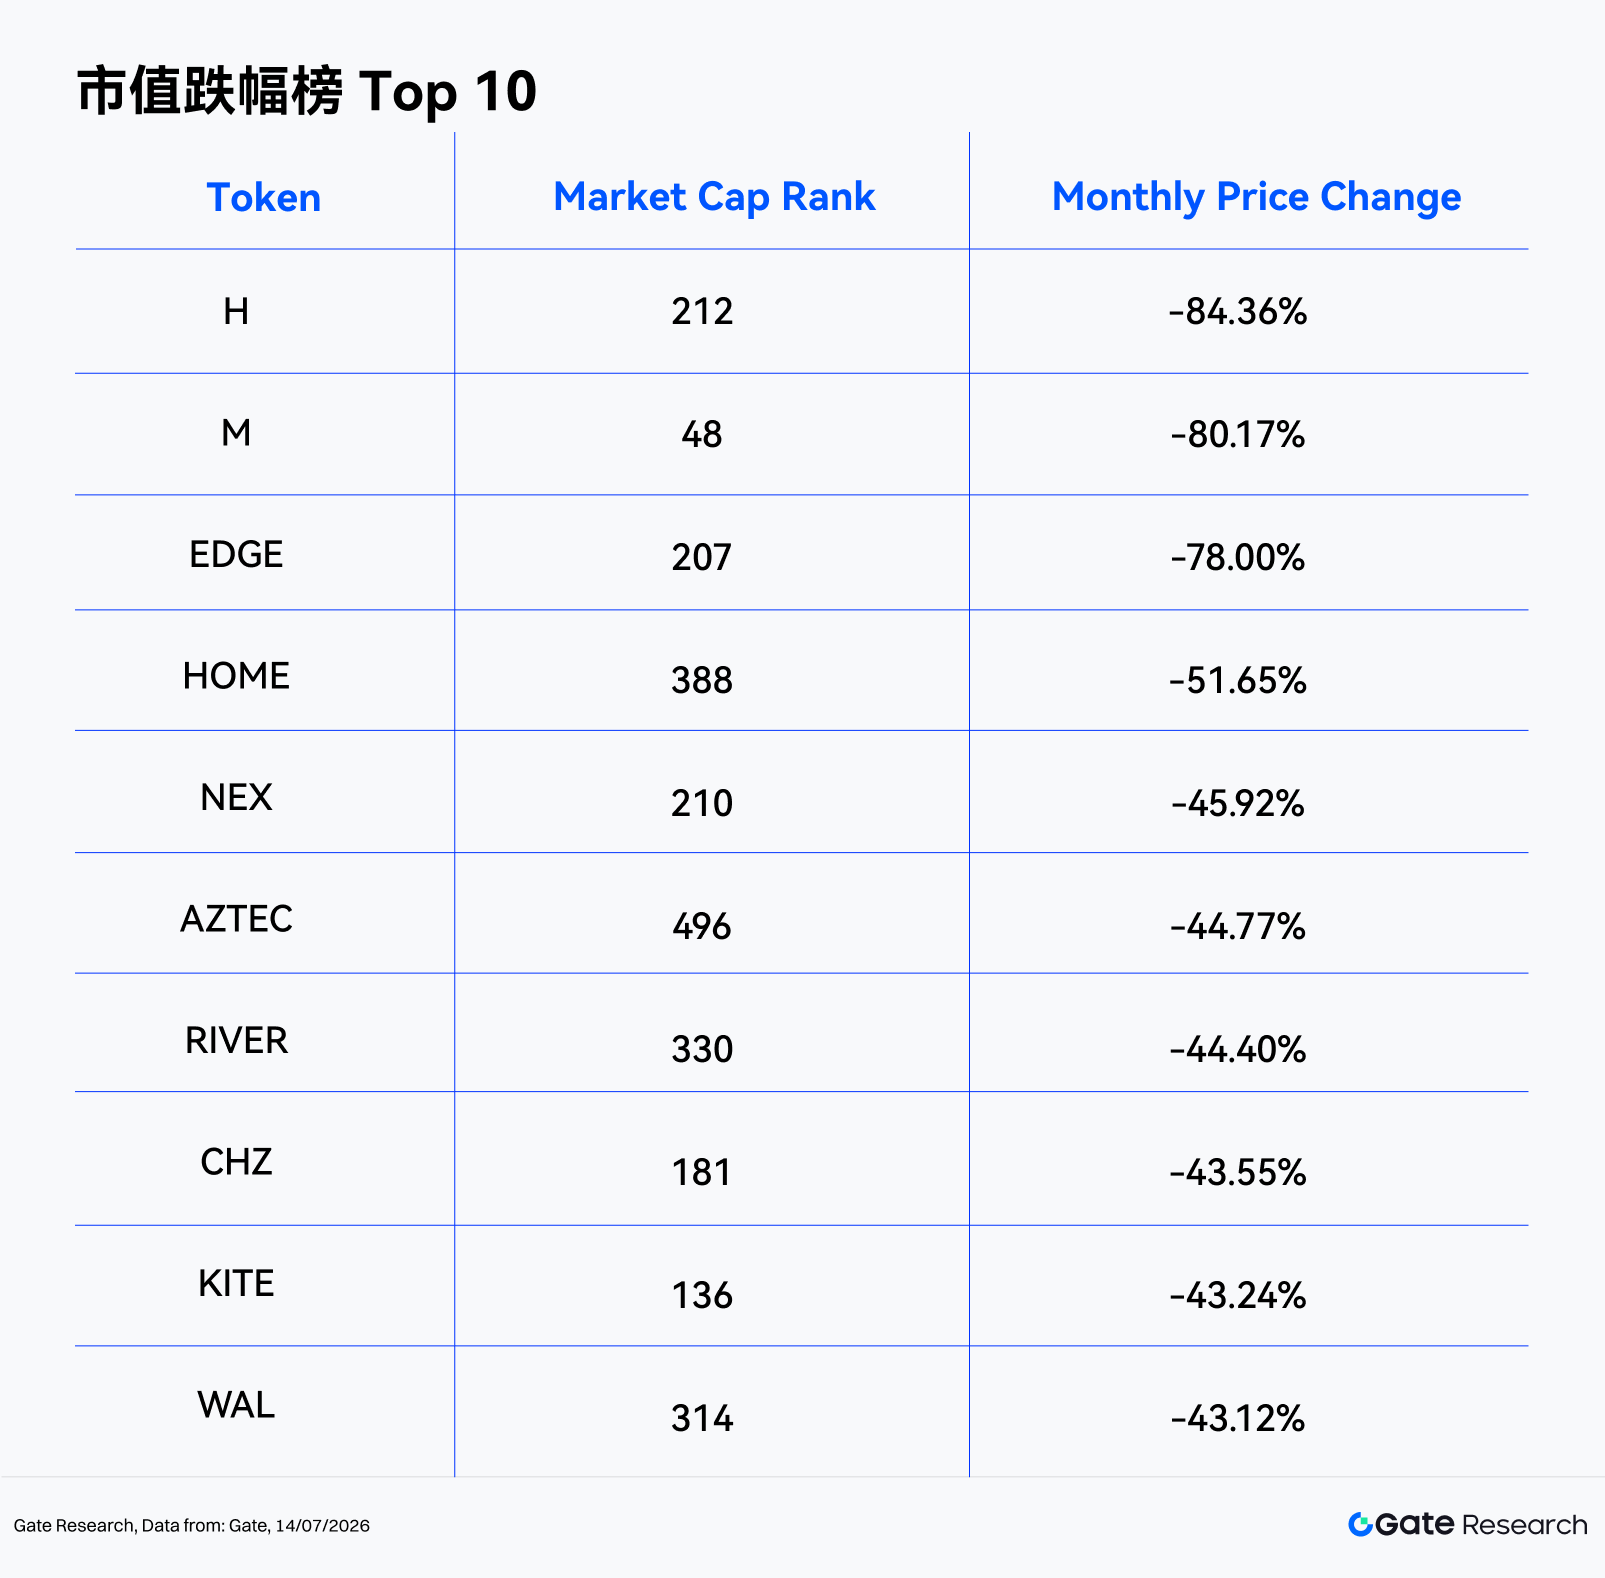
• The gainers list was dominated by low-cap, high-volatility, event-driven tokens, led by CYDX (+35,729.13%), ANSEM (+23,901.60%), and VELVET (+1,548.44%). The losers list, conversely, concentrated on assets experiencing liquidity withdrawal, fading narratives, or a lack of new catalysts, with H (-84.36%) and M (-80.17%) leading the declines.
• In terms of volume, the average Volume Spike across 450 valid samples was 2.54x, but the median was only 0.49x. Only 17 tokens saw volume spikes exceeding 3x, and 8 tokens exceeded 10x. TEMPLE (289.05x), CX (259.13x), and MTBILL (128.15x) topped the volume expansion list. Among these, CX, VELVET, and SYN represent strong "price and volume synergy" cases, while ELF and CELO showed "volume spikes with price declines," warranting caution for potential distribution or liquidity pressure.
1. Crypto Market Snapshot
In June 2026, the global crypto market weakened again after a period of recovery in May. The total crypto market cap fell from approximately $2.56T on June 1st to around $2.16T on June 30th, a monthly decline of 15.74%. The monthly high occurred on June 1st, and the low on June 29th, indicating market pressure persisted almost throughout the entire month, with only limited signs of stabilization appearing near the end.
BTC steadily declined from its early-month high of around $73,570, touching a monthly low of approximately $58,189 and closing the month around $58,519, a full-month decline of about -20.5%. This price action brings BTC back toward its lowest range since 2024. Market risk appetite cooled significantly, with funds flowing from crypto assets towards AI, semiconductors, and potential major IPO themes. The correlation between BTC and US tech risk assets shifted from a supporting factor in May to a suppressing factor in June. Spot BTC ETFs continued to face net outflow pressure. Public reports indicate major products experienced consecutive outflows from late May to early June, with IBIT seeing outflows of approximately $3.1B between May 18 and June 3. Overall, Bitcoin funds saw six-week outflows totaling about $5B–$6B. Institutional fund signals evolved from the "bullish start, bearish end" pattern in May to sustained deleveraging and risk-off positioning in June.
Macro-wise, the market narrative in June shifted from "weakening dollar and risk recovery" to "high interest rate expectations, geopolitical risks, and risk asset repricing." The hawkish policy stance of newly appointed Fed Chair Warsh dampened rate cut expectations. This, combined with a cooling AI trade, escalating geopolitical conflicts, and stronger-than-expected US employment data, pushed long-end yields and dollar pressure higher, weighing on crypto assets as high-beta risk assets. On the regulatory front, while the CLARITY Act continued to be discussed as a core framework for digital asset market structure reform, the prospects for its passage within the year remain uncertain. The marginal support from regulatory tailwinds on market sentiment was clearly weaker than the pressures from fund outflows and macro conditions.
On-chain, according to DeFiLlama data, total DeFi TVL across all chains fell from approximately $80.1B at the end of May to around $70.4B on June 30th, a monthly decline of roughly -12.1%. This suggests that the decline in mainstream asset prices led to a passive contraction in collateralized assets. The total stablecoin market cap remained high, above $300B, standing at around $311.7B by mid-July, with USDT accounting for approximately $184.2B (about 60% market share). This indicates that on-exchange cash hasn't exited en masse but is leaning towards a wait-and-see or risk-off allocation. In terms of DEX spot trading volume, DeFiLlama reported approximately $222.7B for June across all chains, with a daily average of about $7.4B, maintaining a certain level of activity despite the market downturn. However, the volume structure continued to tilt towards leverage and event-driven activity. On-chain perpetual swap platforms like Hyperliquid maintained high traffic amidst the geopolitical conflicts and high volatility in June, even seeing short-term volume surges for contracts related to SpaceX and oil prices, highlighting that on-chain derivatives have become the primary venue for speculation and risk transfer during this decline.
2. Full Overview of Price Changes This Month
Major assets widely declined. BTC and ETH fell over 20%, with BNB and XRP dropping -21.14% and -20.54%, respectively. In contrast, SOL showed relative resilience with a decline of -8.81%. However, DOGE (-26.85%), ADA (-38.06%), BCH (-33.65%), and XLM (-32.70%) saw significant drops, indicating that high-beta mainstream assets bore heavier losses during the risk-off phase.
Unlike the "recovery rally" in May, the core characteristic of the June market was the coexistence of broad-based declines and localized extreme speculation. On one hand, stablecoins and a few RWA/yield-bearing assets remained relatively stable. On the other hand, within the small-to-mid-cap space, extreme rallies like those seen in CYDX, ANSEM, and VELVET still occurred. The market hasn't completely lost short-term trading opportunities, but these opportunities stem more from low-liquidity, strong event-driven, and short-cycle capital games rather than a broad Beta recovery.
The market this month was characterized by "broad declines, strong divergence, and distorted averages." Among the 493 effective sample tokens, 126 rose, 350 fell, and 17 remained largely flat; the proportion of gainers was only 25.56%, while losers accounted for 70.99%.
• Market Cap Top 1–100: This tier has the strongest liquidity but failed to provide effective defense in June. Blue-chip assets weakened together, dragging down overall risk appetite significantly. Structural highlights were mainly from a handful of assets like BEAT (+133.5%), ADI (+50.9%), LIT (+35.8%), DEXE (+22.1%), and WLD (+20.9%). On the losing end, represented by M (-80.2%), ADA (-38.1%), MNT (-35.6%), BCH (-33.7%), and XLM (-32.7%), it shows that even within the top-tier assets, divergence was severe.
• Market Cap 101–200: The median decline was -11.10%, but the average was lifted to +5.80% due to the extreme rally in VELVET (+1,548.4%). The true performance of this tier was clearly weaker than the average suggests. Aside from VELVET, GWEI (+63.3%), LAB (+54.0%), and JTO (+43.3%) contributed most of the positive returns. On the downside, CHZ (-43.6%), KITE (-43.2%), and IOTA (-42.2%) experienced deep corrections, indicating that mid-to-high-cap projects still face significant valuation pullback pressure in the absence of new catalysts.
• Market Cap 201–300: The median decline was -7.75%, but the average was inflated to +249.59% by extreme rallies in ANSEM (+23,901.6%), CX (+983.4%), BTW (+296.4%), and BP (+217.2%). This bracket was a primary source of average distortion in June, with a few tail-end assets contributing the vast majority of positive returns. However, deep corrections like H (-84.4%), EDGE (-78.0%), and NEX (-45.9%) were also concentrated here.
• Market Cap 301–400: The median decline was -11.90%, but the average surged to +369.65% due to exceptional rallies in CYDX (+35,729.1%), SYN (+1,039.8%), BAS (+110.3%), MAGMA (+70.9%), and MWC (+55.1%). This tier had the most imbalanced structure overall. On one hand, extreme rallies were significant enough to distort the average; on the other hand, assets like HOME (-51.7%), RIVER (-44.4%), and WAL (-43.1%) highlight the prominent downside tail risk associated with liquidity withdrawal.
• Market Cap 401–500: This was the weakest tier in terms of median performance. While VIT (+110.6%), DEGEN (+68.7%), and NAT (+36.9%) still offered localized resilience, assets like AZTEC (-44.8%), DEEP (-42.0%), and PURR (-39.5%) also saw significant losses.
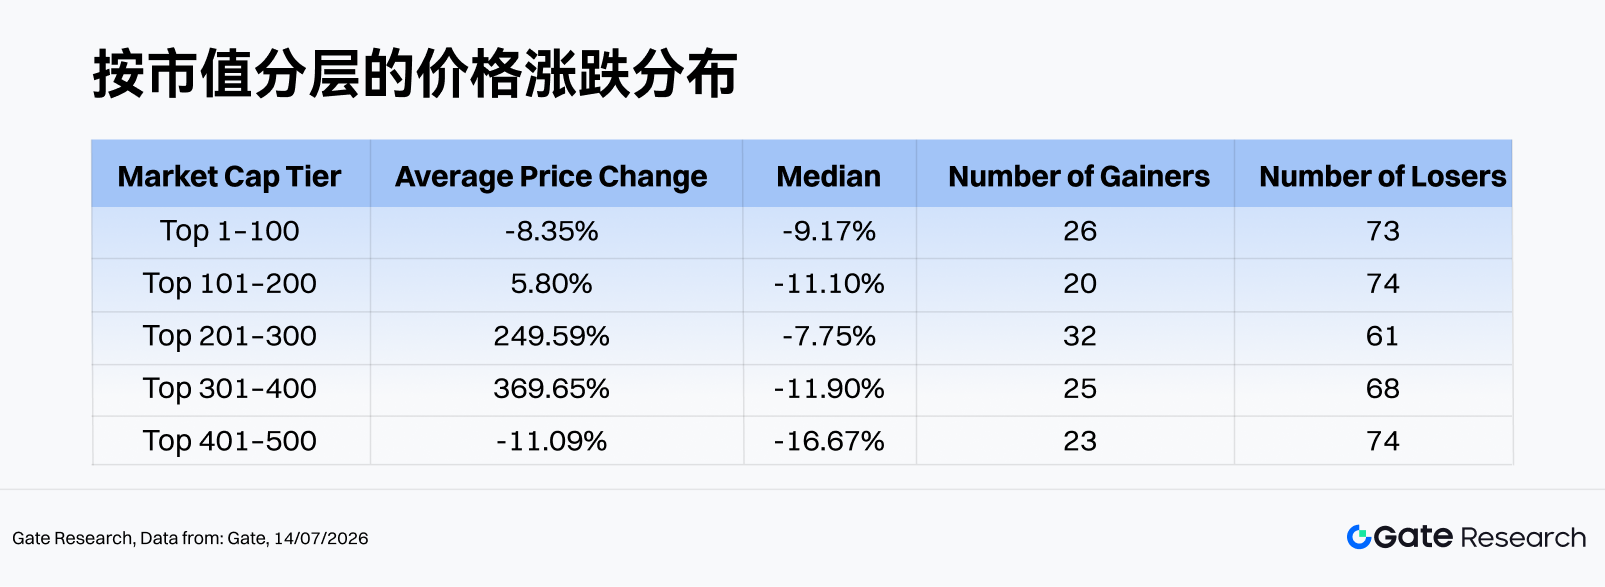
Note: The market cap distribution is based on CoinGecko data. The top 500 tokens by market cap are grouped into segments of 100 (e.g., Rank 1–100, 101–200, etc.). The price change percentage for each token between June 1, 2026 and June 30, 2026 is calculated, and the average for each group is computed as the average gain indicator for that market cap range. The full-text gain/loss table is based primarily on daily closing prices; there may be deviations from hourly average prices or intraday extremes. For tokens with extremely low unit prices, tick noise can lead to distorted gains of several thousand times, which have been excluded from the average calculation.
2.1 Gainers & Losers Leaderboard
2.1.1 Gainers: Extreme Tail-End Assets Dominate Averages
The June gainers list was highly concentrated among low-cap and mid-to-late rank assets. CYDX ranked first with +35,729.13%, followed by ANSEM with +23,901.60%. Both represent extreme, event-driven market moves that significantly impacted the overall sample average. VELVET (+1,548.44%), SYN (+1,039.79%), and CX (+983.43%) also exhibited clear impulsive rally characteristics.
SYN (+1,039.8%, Market Cap Rank 321) belongs to the cross-chain interoperability and bridge protocol sector. Its June performance benefited from the renewed heating up of the cross-chain infrastructure narrative, forming a typical rally pattern of "low market cap + strong turnover + narrative rotation." Given that Synapse itself has a clear application scenario for cross-chain asset transfers, funds in a weak market are more likely to view it as an infrastructure catch-up trade. However, after such a significant short-term gain, profit-taking pressure warrants attention.
BP (+217.2%, Market Cap Rank 213) is an asset related to the Backpack ecosystem. It attracted strong capital attention during the month, driven by narratives around the exchange, wallet, and consumer-grade crypto entry points. Compared to pure Meme assets, BP has a clearer platform ecosystem vision. However, its market cap ranking remains in the mid-to-late stages, implying high liquidity elasticity. Its price increase was more driven by concentrated capital inflows. Whether this can continue depends on the growth of the Backpack ecosystem's user base, trading activity, and further realization of the token's use cases.
Distribution-wise, only BEAT among the top ten gainers was in the Top 100 market cap ranks; the rest were mostly concentrated after Rank 200. This indicates that the June market lacked trend-driven rallies led by blue-chip assets, with capital favoring high-odds gambles on small-cap stocks. While such trades offer extremely high short-term elasticity, they typically come with risks like insufficient order book depth, widened slippage, and rapid retracement speed.
2.1.2 Losers: Liquidity Withdrawal & Narrative Fading
The losers list also exhibited clear tail-end risk characteristics. H (-84.36%), M (-80.17%), and EDGE (-78.00%) posted the deepest losses. HOME, NEX, AZTEC, RIVER, CHZ, KITE, and WAL also experienced corrections of over 40%. Notably, M is in the Top 100, indicating that this correction wasn't limited to small-cap assets; some higher-cap projects also faced concentrated selling pressure.
M (-80.2%, Market Cap Rank 48) is a token from the MemeCore ecosystem. Its decline this month was most characteristic of an event-driven shock. The token experienced a flash crash of approximately 70% in a very short period, coinciding with market doubts regarding insider manipulation, liquidity structure, and exchange due diligence, leading to a rapid discounting of investor confidence. As M had previously entered the Top 100 by market cap, its valuation base was relatively high. When its core narrative and price stability were challenged, selling pressure was more concentrated than typical long-tail Memes, ultimately resulting in a deep decline characterized by "valuation reversion from a high base plus a crisis of confidence."
CHZ (-43.6%, Market Cap Rank 181) is a representative token in the sports fan token ecosystem, primarily relying on the fan economy narrative of sports clubs via Chiliz / Socios.com. CHZ lacked major new tournaments or platform-level catalysts in June. Combined with the overall decline in market risk appetite, capital tended to withdraw from such mid-cap assets with slower growth rhythms and limited short-term trading elasticity.
Overall, the common features among the losers list are a lack of new catalysts, prior valuation or narrative exhaustion, and insufficient liquidity absorption capacity during capital exodus. In an environment where over 70% of assets are declining, weaker assets are more prone to a negative feedback loop of "declining further and losing more capital."
2.2 Top 100 Market Cap Leaderboard Review
Among the top 100 tokens by market cap, the number of strong performers was limited. BEAT (+133.48%) was the clear leader, followed by ADI (+50.90%), LIT (+35.84%), DEXE (+22.07%), and WLD (+20.90%). AAVE, RAIN, JUP, and BDX also maintained positive returns, but their gains were significantly lower than the extreme long-tail assets.
On the downside, M (-80.17%) was the biggest drag within the Top 100. ADA (-38.06%), MNT (-35.64%), BCH (-33.65%), XLM (-32.70%), ALGO (-32.65%), PEPE (-31.26%), and DOT (-30.36%) also saw significant losses. The widespread retreat of mainstream high-beta assets was a core reflection of the weakening market sentiment in June.
2.3 Relationship Between Market Cap Rank and Price Change
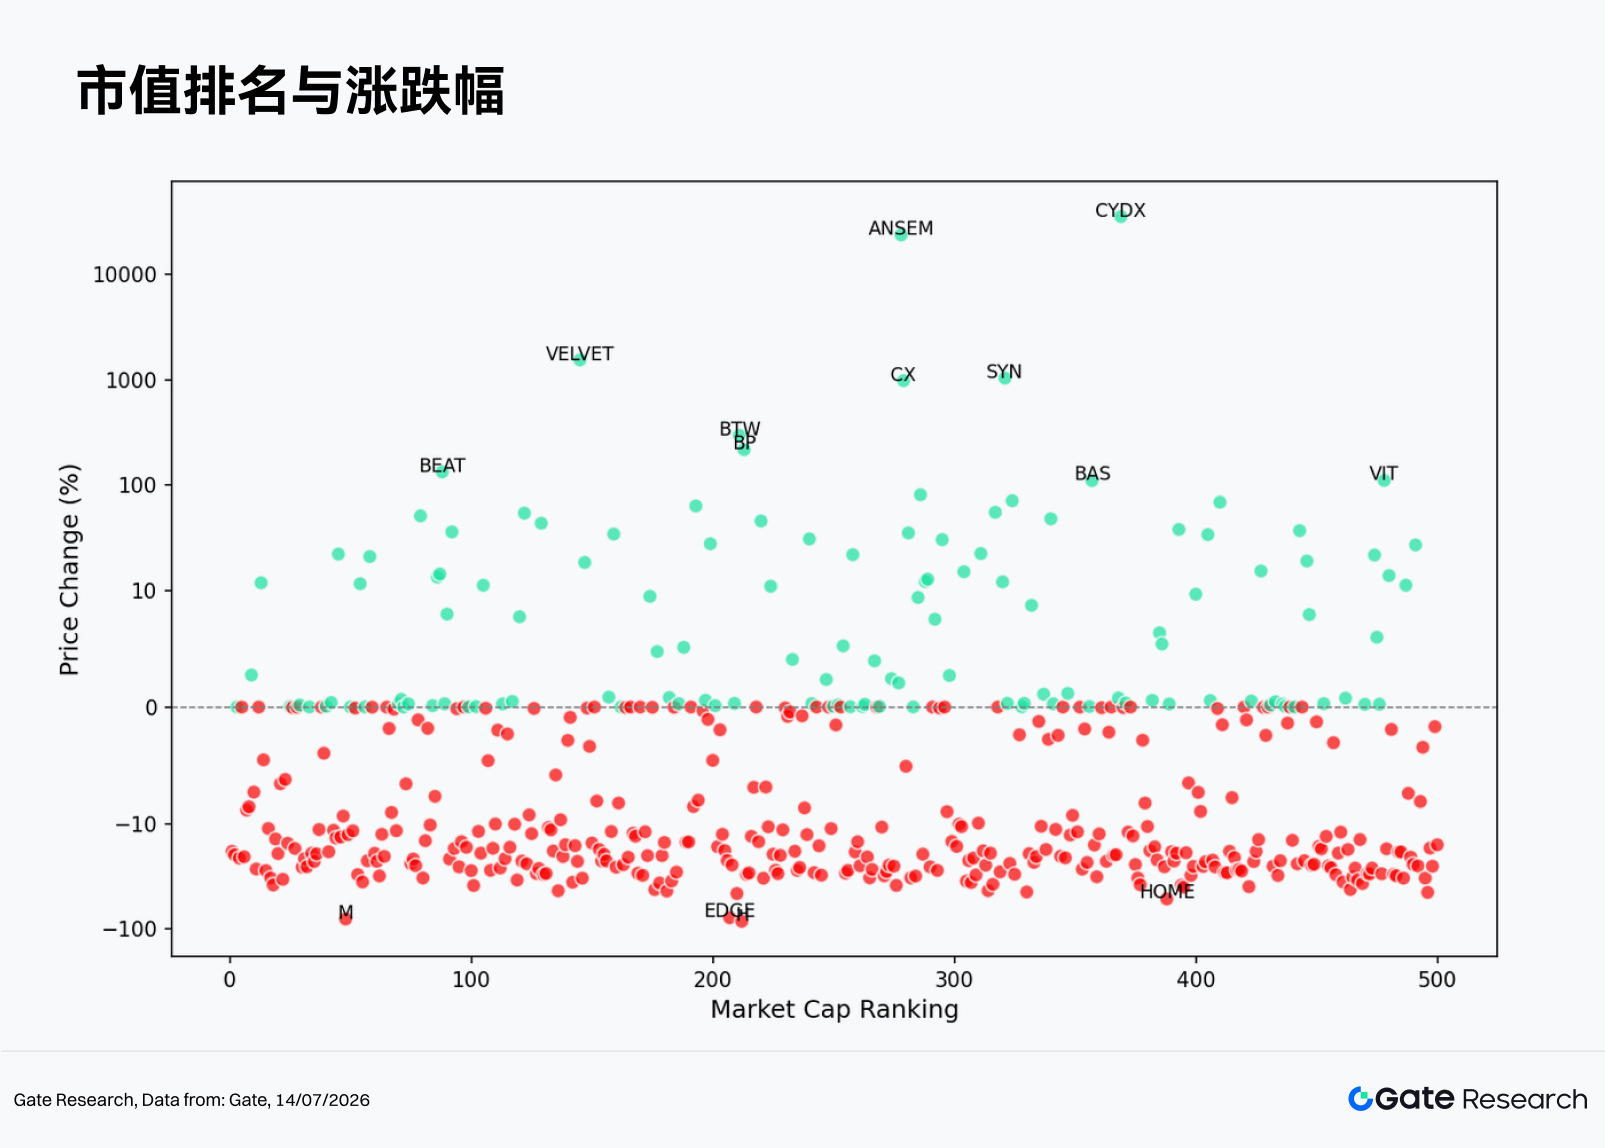
Looking at the scatter plot of market cap rank (X-axis) versus price change (Y-axis), negative return points in June covered almost all market cap ranges. 73 out of the Top 100 tokens declined, indicating that top-tier assets failed to provide meaningful safe-haven characteristics. A few extreme outliers appeared in the upper part of the Rank 200–400 range, constituting the main source of the overall average being pulled up. However, the median for this range remained negative, demonstrating that the vast majority of tokens did not participate in the extreme long-tail rallies.
In other words, the main contradiction in the June market was not that "low-cap assets were generally stronger," but rather that "a very few low-cap coins were extremely strong, while most were relatively weak." If investors only observe the average, they risk overestimating the market's profit-making potential. By observing the median and the winning percentage (percentage of gainers), the defensive nature of the capital environment becomes clearer.
The average and median declines for Top 1–100 were both negative, showing that top assets failed to act as a defense. The averages for Top 101–400 appeared strong, but the medians were still negative, mainly because individual extreme outliers like ANSEM, CYDX, SYN, and CX significantly inflated the averages. The Top 401–500 simultaneously exhibited higher tail risk and deeper median declines, indicating that low-cap tokens are more susceptible to rapid retracement when lacking sustained capital inflows.
3. Analysis of Volume Expansion This Month
3.1 Trading Volume Growth Analysis
Using the average daily trading volume in May as a baseline and comparing it with the daily volume towards the end of June, we


