
1亿资金,撬动万亿市值:币圈玩法正在席卷股市
- 核心观点:当前一级市场(美股、港股、A股)的AI与科技公司IPO普遍呈现“低流通、大叙事、高市值”特征,市场定价正从基于财报的“定价”转向基于叙事的“炒作”,这一模式与加密市场高度相似,并可能面临解禁后的流动性风险。
- 关键要素:
- 低流通盘成为普遍趋势:智谱上市初期流通盘不足4%,SpaceX仅4.3%,纳斯达克为此废除10%最低公众持股门槛,低流通使少量买盘即可大幅拉升股价(首日涨幅67.4% vs 非低流通的47.9%)。
- 传统财报定价框架失灵:智谱、CoreWeave等AI公司收入高速增长但严重亏损(智谱亏损是收入4.4倍,市销率超1200倍),DCF模型因参数敏感度极高而失效,市场转向交易模型、算法等难以量化的“叙事”。
- 各方利益驱动低流通:创始人借此维持控制权并推高账面市值(如SpaceX马斯克持股85%投票权),投行通过小流通盘制造高首日涨幅赢得声誉,基石投资者通过锁定筹码制造稀缺性获利(智谱11家基石拿走70%流通盘)。
- 加密市场低流通教训的复刻:2024年新代币流通量低至6%-20%,但Binance Research警告约1550亿美元代币将在2030年前解锁,2025年84.7%代币价格低于上线估值的现象,预示股价可能面临解禁后的下跌压力。
- 解禁风险与对冲手段:回溯数据显示美股IPO锁定期结束后6个月中位数回报下跌约10%,SpaceX员工已通过零成本领口等期权策略提前对冲,但Michael Burry称做空成本过高,市场做空压力已显拥挤。
Original Author: Jia Liu
Low float, big narratives, high valuations – these are becoming the common characteristics of speculative trading in this financial cycle.
Zhipu AI has seen its share price rise up to 25 times since listing on the Hong Kong Stock Exchange less than six months ago. But if you look at its share structure, you'll find a more critical yet easily overlooked number: in the early days of its listing, the shares truly freely tradable on the market were only about 17.35 million, representing less than 4% of the total share capital. A company with a market cap of a trillion Hong Kong dollars actually has a daily trading chip pool worth only a few hundred billion Hong Kong dollars.
This is a typical but not unique case, and it can even be considered a microcosm of this market cycle's gameplay.
Just over ten days ago, SpaceX went public with a valuation of $1.77 trillion, but only 4.3% of its shares were publicly floated. To accommodate its listing, Nasdaq directly abolished the 10% minimum public float threshold that had been in place for decades. SPCX's market cap peaked at over $2 trillion, yet its daily trading volume was only about $100 million.
Cerebras, a US AI chip company, sold only about 15% of its issued shares during its IPO in May, but the stock rose to more than double the issue price on its first day. Figma, with its new issuance and secondary share sales totaling less than 10% of its total share capital, saw a 250% gain on its first day of trading.
Low float, big narratives, high valuations. The structure that the crypto market has been playing with for several years is now being fully replicated by the traditional stock market. Similar structures are appearing simultaneously in the US stock market, Hong Kong stock market, and A-share market, with narratives extending from AI, chips, and large language models all the way to stablecoins.
The Era of Pricing Based on Financial Reports Is Over, Again
In February 2000, a sock-puppet dog appeared in a Super Bowl commercial. It was Pets.com, which spent $1.2 million on a 30-second ad slot. At that time, its annual revenue was less than $6 million, and its losses exceeded $60 million. Nine months later, the company liquidated, and the sock puppet became the most iconic tombstone of the internet bubble.
The market lesson from that era was written into almost every investment textbook: valuations without revenue support are bubbles, and narratives cannot replace financial reports.
For the next two decades, this lesson dominated the market. Pricing methods based on financial report data, such as DCF, PE, PEG, and discounted free cash flow, became orthodox. Warren Buffett was once again hailed as a god after the 2008 financial crisis. "Buying without looking at financial reports" became synonymous with speculation.
But looking at the new technology sectors from 2025 to 2026 today, we find a fact: the most sought-after companies in these industries are actually losing money.
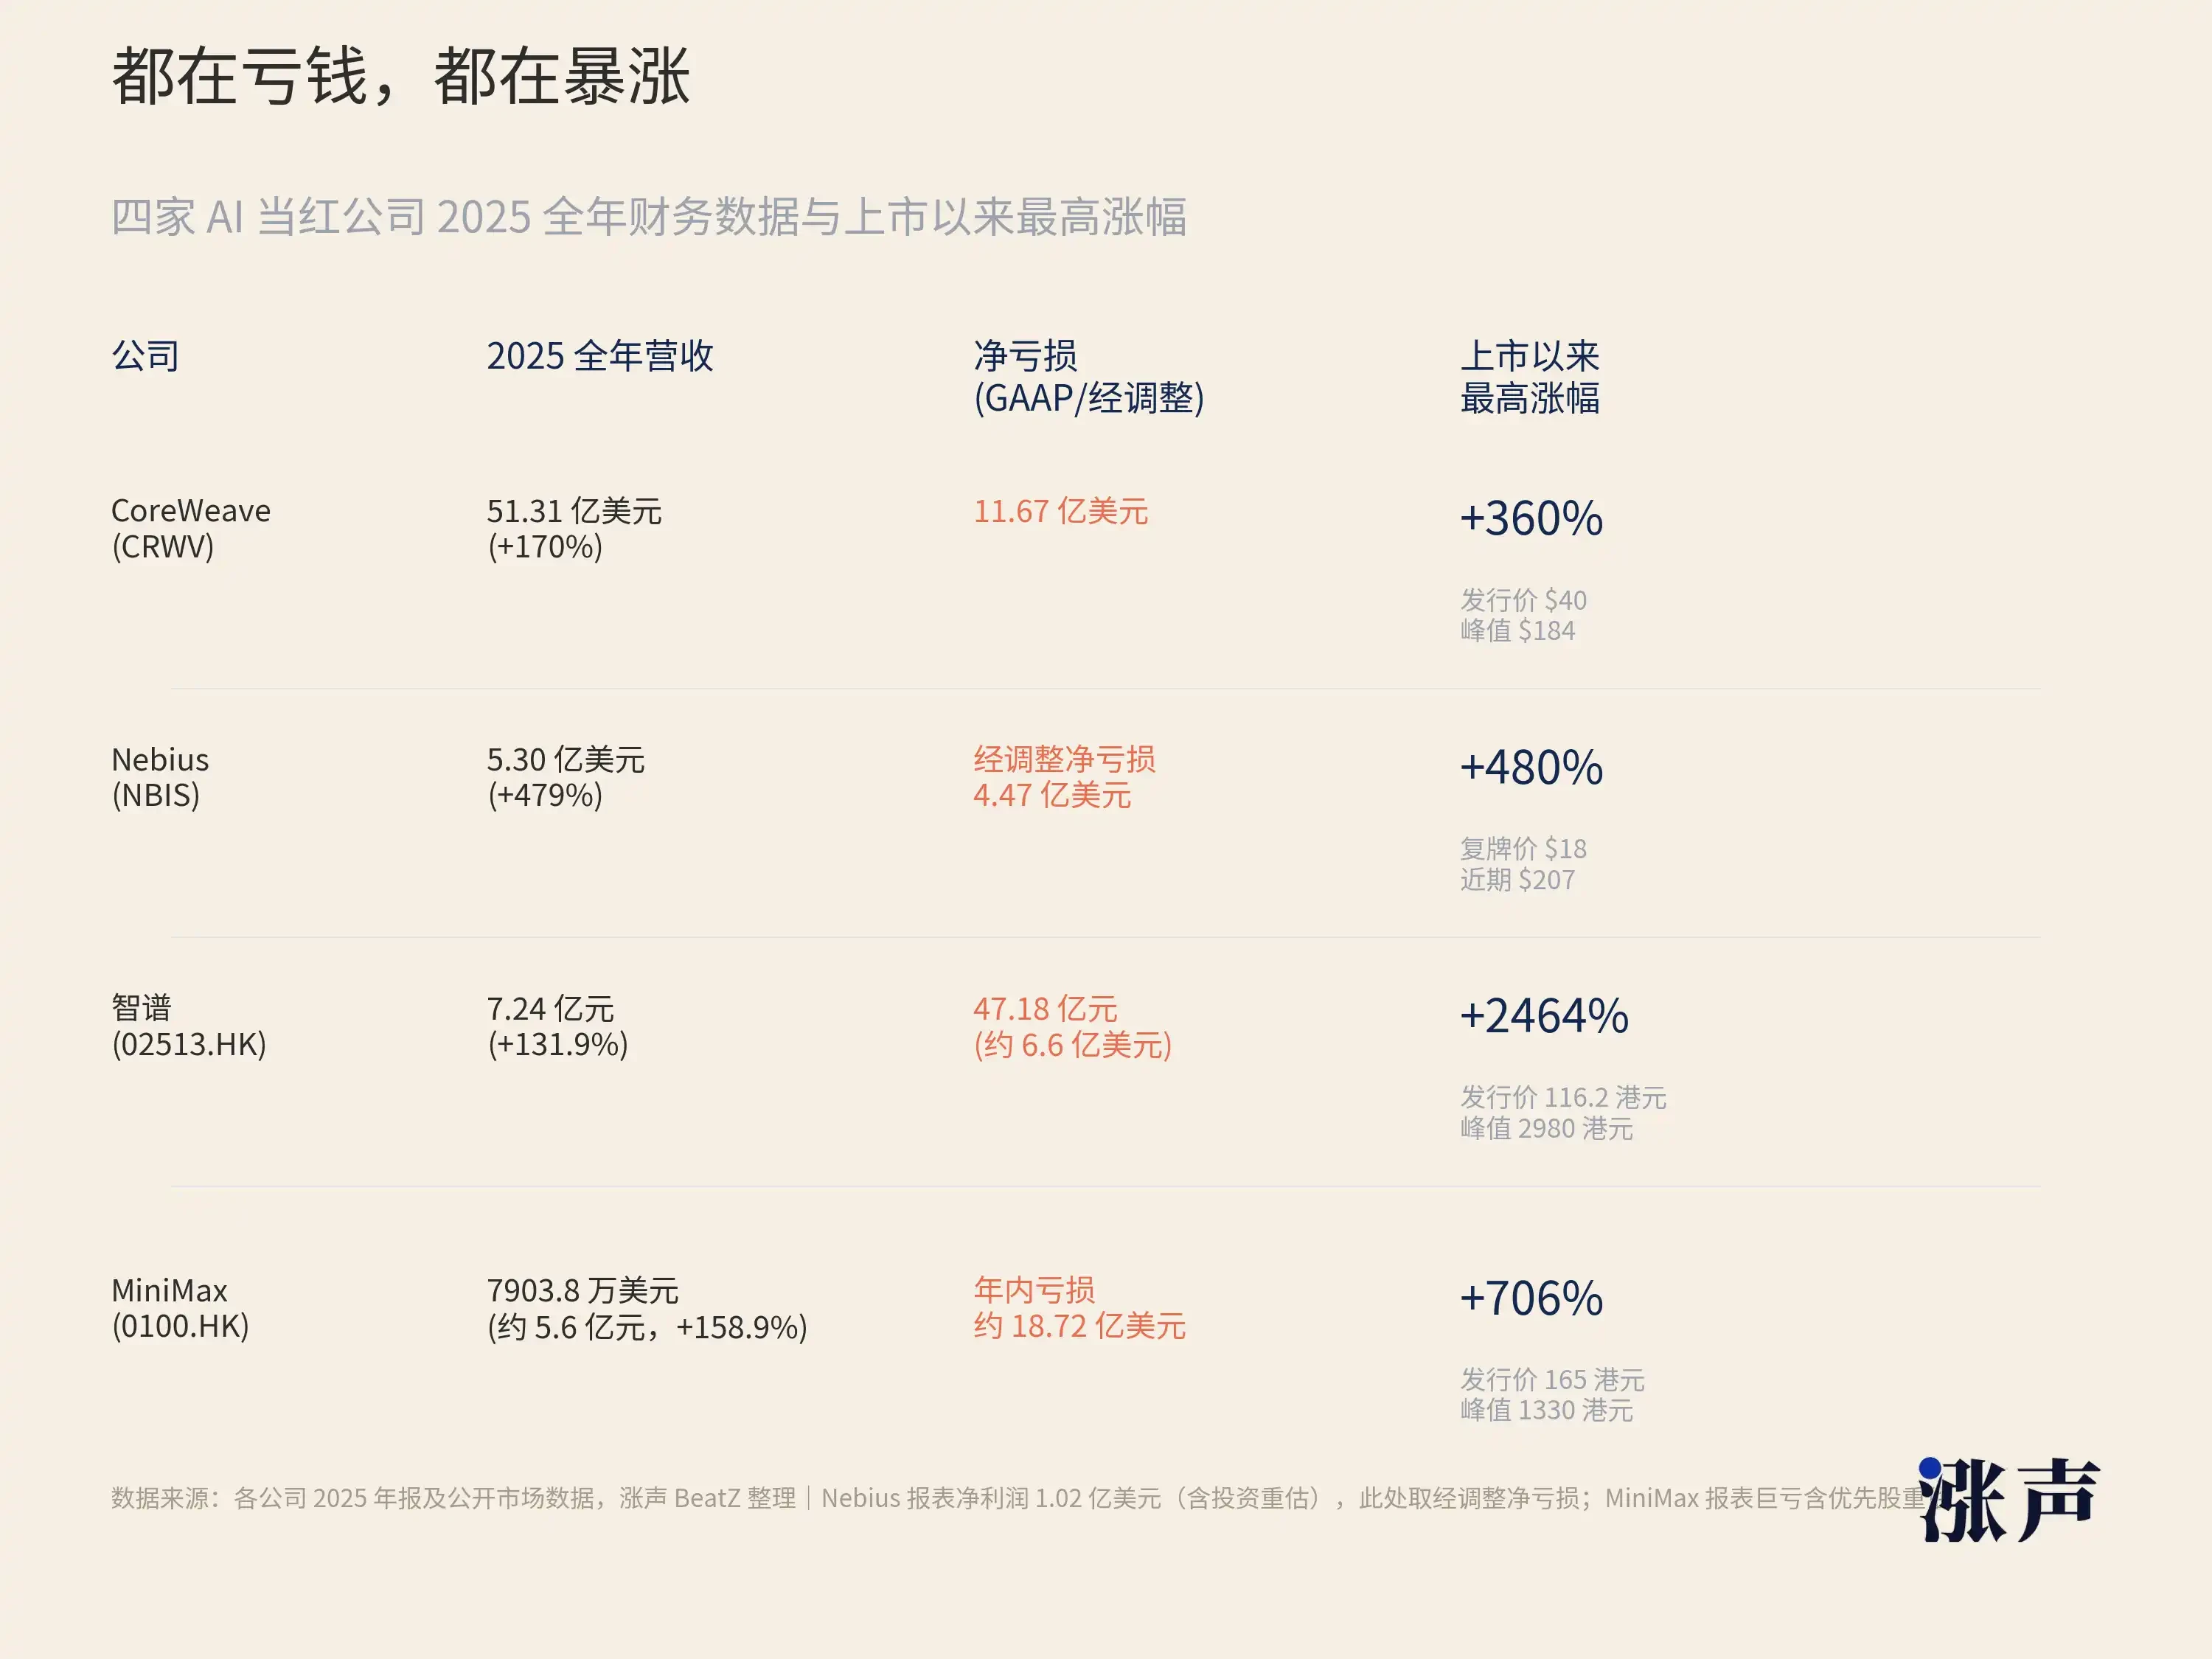
Take CoreWeave, for example. This AI computing infrastructure company, invested in by Nvidia, had revenue of $16 million in 2022. By 2025, its revenue reached $5.1 billion, multiplying over 300 times in three years. The revenue growth rate is astonishing, but its net loss also expanded from $31 million to $1.2 billion. In the first quarter of 2026, the company reported revenue of $2.1 billion and a net loss of $740 million, with a debt-to-equity ratio of 10.7. By traditional bank credit standards, such a balance sheet is not healthy. Yet, after its listing, its stock price once surged by 190%.
The situation is similar for Nebius. This company, formerly Russia's Yandex, pivoted to AI cloud services after a split. In the first quarter of 2026, it had revenue of $399 million, up 684% year-over-year, but still reported an adjusted net loss of $100 million. Over the past 12 months, its stock price has risen over 510%.
Let's turn our attention back to the Chinese market.
Zhipu AI's full-year revenue in 2025 was 724 million RMB (approximately $100 million), but its net loss was 3.182 billion RMB, or 4.4 times its revenue. In other words, for every 1 RMB it earns, it spends far more than 1 RMB on computing power and R&D. Another AI stock listed in Hong Kong during the same period, MiniMax, surged 109% on its first day, with subsequent gains exceeding 700%. Its full-year revenue was $79.038 million (about 560 million RMB), even less than Zhipu.
Similarly, the GPU company Biren Technology (listed in Hong Kong), the domestic GPU company Muxi Co., Ltd. (listed on A-shares), and Moore Threads (listed on the STAR Market) saw first-day gains of 120%, 693%, and 425%, respectively. These new stocks with stunning gains are all either severely loss-making or not yet profitable.
If you use P/E ratio to value these companies, many don't even have the premise for calculation because their profits are negative. Using P/S ratio, Zhipu's is over 1200 times, SpaceX's is about 95 times. Using DCF, a slight change in the discount rate or terminal growth rate can swing the conclusion from 100 billion to 10 billion. The model is so sensitive that it loses its guiding significance. Damodaran, the author of the DCF textbook, valued SpaceX at $1.2 trillion, which is 30% lower than its IPO pricing. He himself admitted that when dealing with this generation of IPOs, even minor parameter adjustments can lead to wildly fluctuating results.
Some might say that the early internet era didn't care about P/E ratios either; Amazon was unprofitable for twenty years before making money. This is nothing new. True, but there is a key difference between this cycle and the internet era: the market now isn't even using alternative indicators to P/E for pricing; it's trading purely on narratives.
Although investors in the internet era didn't look at P/E, they looked at user growth, GMV, and page views. Essentially, they were still using a set of quantifiable intermediate indicators to anchor valuations. Today's AI companies also have indicators like ARR, but ARR can't explain Zhipu's 1200 times price-to-sales ratio. This frantic speculative trading has long escaped the gravity of financial report fundamentals, pricing all expectations for the next three to five years into the present.
The old pricing framework is starting to fail with this new class of assets. The investment logic of financial markets and investors worldwide has also undergone tremendous change.
Model weights, algorithmic capabilities, developer ecosystems, and computing power scheduling capabilities – these are the true core assets of an AI company, but none can be written into a balance sheet. The coding ability of GLM-5.2 made the CEO of Vercel say he was "almost shocked." This statement won't appear on Zhipu's income statement. CoreWeave is sitting on a $100 billion order backlog, but this doesn't change the fact that it had a net loss for the quarter. Nvidia's GPUs are called the oil of the AI era, and the pricing of oil never just looks at current quarter production; it also considers reserves, demand curves, and geopolitics.
The core assumption of traditional pricing methods is that future cash flows can be extrapolated from historical financial data. This assumption works very well in industries like consumer goods, finance, and real estate.
But the revenue curve for AI companies is not linearly extrapolatable. It depends on sudden leaps in model capability, network effects from open-source ecosystems, and sudden shifts in policy and industry cycles. After the release of GLM-5.2, Zhipu's narrative status could change overnight. Llama's open-sourcing rapidly amplified Meta's AI influence. US chip restrictions against China turned Biren and Muxi from marginal companies into "leaders in domestic substitution." These variables are difficult for any financial model to pre-incorporate.
At the same time, the market's tolerance for narrative-driven trading is rising, because in the past few years, those who believed in narratives have actually made money.
Those who bought Nvidia in early 2023 without looking at financial reports made ten times their money. Those who bought Zhipu in early 2026 without looking at financial reports made 24 times. When an "incorrect" method consistently produces "correct" results, the market will revise its methodology, not the outcome.
The Money Propping Up High Valuations Isn't Actually That Much
Nasdaq conducted a study tracing data from 1980 to 2020. In the 1980s, the average public float for US IPOs was about 30% of total share capital. By 2020, this number had dropped to about 20%.
A June 2026 report from J.P. Morgan provided a broader macro figure: new shares issued in IPOs, plus shares from early investors allowed to be sold after lock-up expiration, together accounted for only about 1% of the total market capitalization.
IPO floats are getting smaller and smaller. This is a trend that has persisted for almost three decades.
Nasdaq also found an inverse relationship between float size and first-day gains. In years with smaller floats, first-day gains were larger.

Our own compiled sample of US IPOs from 2024-2026 shows the same characteristic. Defining "low float" as "current float / total share capital less than 30%," among the sample where first-week performance was calculable, 67.4% of low-float IPOs saw gains on the first day, 65.2% were still up on the 3rd trading day, and 63.6% were still up on the 5th trading day.
The corresponding ratios for non-low-float IPOs were only 47.9%, 48.9%, and 49.6%.
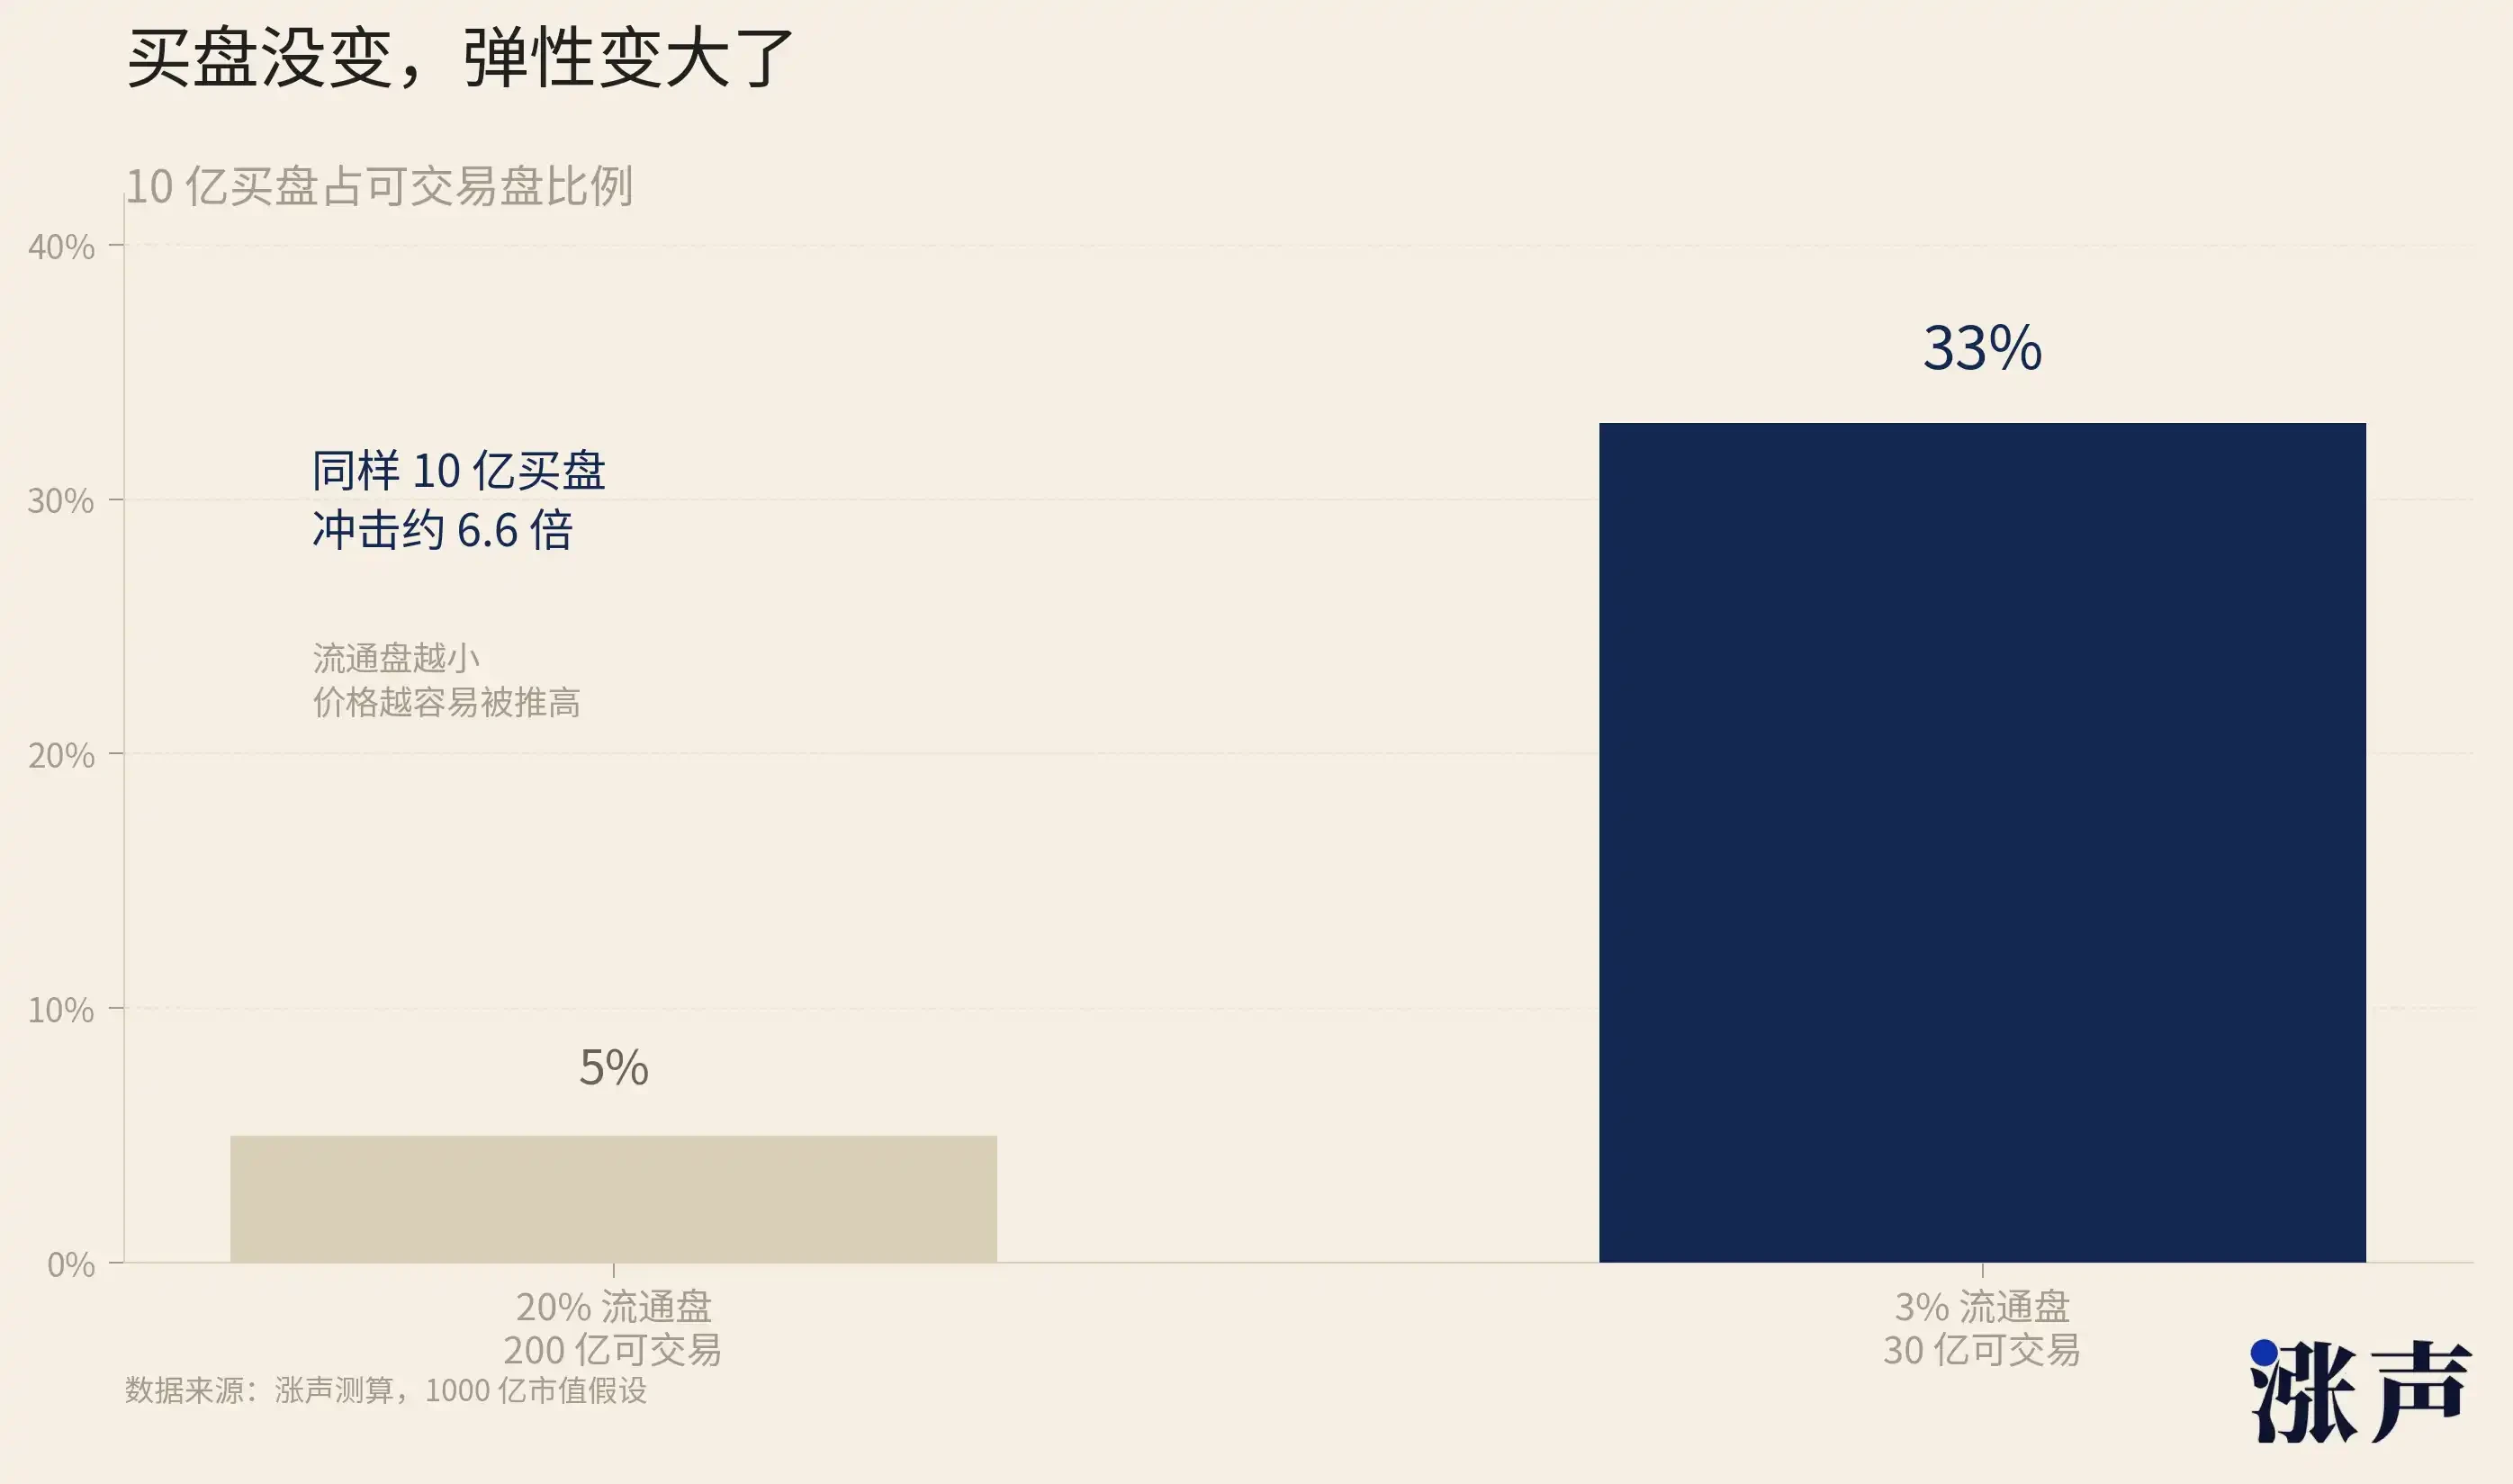
With fewer chips available to buy, the same buying pressure has a greater impact, making price elasticity stronger.
The logic is simple. The same $1 billion buy order hitting a float of $20 billion is just a ripple; hitting a float of $3 billion is a tsunami. Reducing the float from 20% to 3% isn't a linear change; it's a qualitative shift in price elasticity.
Newly listed companies are increasingly favoring low floats because it's the result of maximizing benefits for all relevant parties.
First, consider the founder. The smaller the float, the more stable the control. Elon Musk of SpaceX controls about 85% of the voting power through Class B shares, and the 4.3% public float means outside investors have almost no governance influence. He can simultaneously serve as CEO, CTO, and Chairman; he can merge xAI into SpaceX without shareholder approval; he can hold the company's strategic direction entirely in his own hands. The smaller the float, the weaker the voice of external shareholders, and the greater the founder's freedom.
Scarcity also directly inflates the market cap number. A company's market cap isn't determined by all its shares, but by the price of the last trade multiplied by the total shares outstanding. If only 3% of the chips are trading, and that 3% is bid up to an absurd price, the entire company's market cap is calculated based on that price.
The book value of the 97% of untraded shares held by the founders and early shareholders all inflates accordingly. This inflated market cap can be used for fundraising, as acquisition currency, and to attract talent. SpaceX went public with a $1.77 trillion valuation, a number that appears in all its job postings and on the table in all partnership negotiations.
This phenomenon is not limited to small-cap stocks.
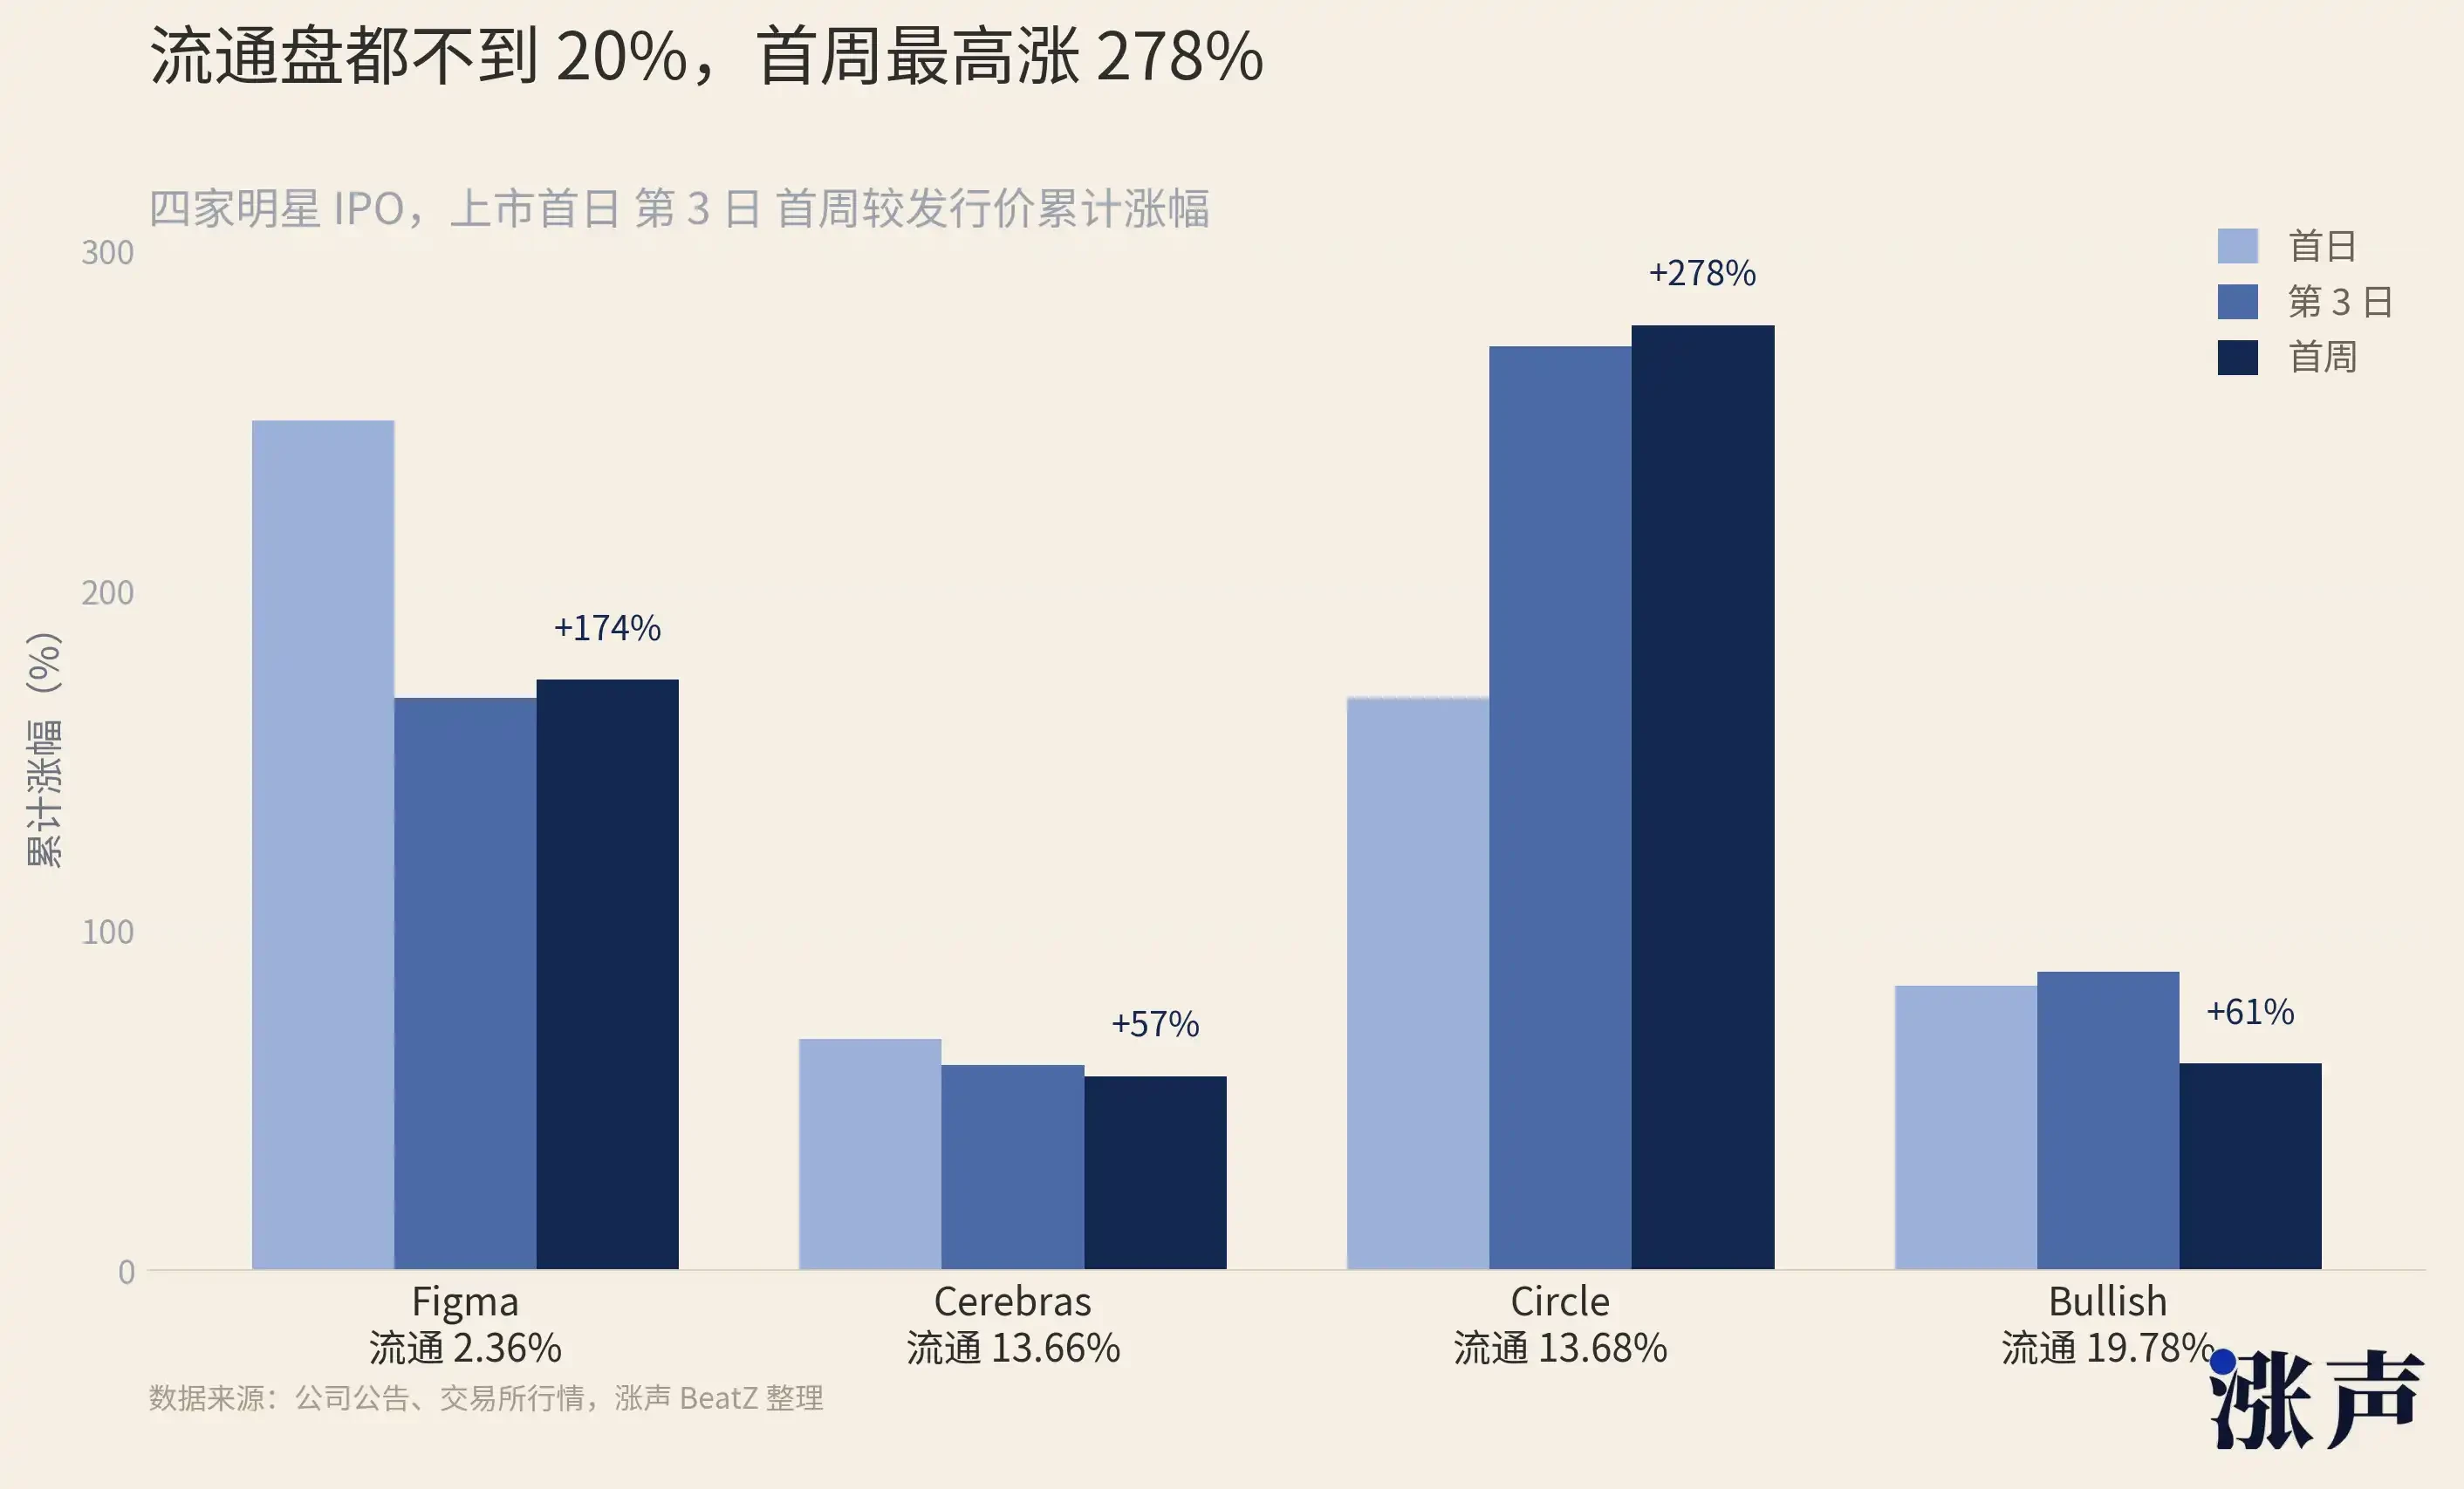
Figma (FIG), a collaborative design software platform, had a public float of only 2.36%. It surged 250% on day one, was up 168.48% on day three, and up 173.7% after one week.
Circle (CRCL), the stablecoin and blockchain financial infrastructure company behind USDC, had a public float of 13.68%. It surged 168.48% on day one, was up 271.77% on day three, and up 278.06% after one week.
Bullish (BLSH), a digital asset trading platform and market infrastructure company, had a public float of 19.78%. It rose 83.78% on day one, was up 87.95% on day three, and up 60.84% after one week.
Cerebras (CBRS), an AI computing infrastructure company, had a public float of 13.66%. It rose 68.15% on day one, was up 60.35% on day three, and up 57.13% after one week.
Next, consider the investment bank. The "first-day gain" is a core metric for gauging the success of an underwriting. Media headlines, client reviews, and the bank's reputation are all tied to this number. The smaller the float, the easier it is to generate a large first-day gain. Goldman Sachs designed SpaceX's 4.3% float. It rose 19% on day one, and everyone called it a great IPO. If the float were 20%, the same buying pressure spread across five times the chips might have resulted in only a 4% gain, and the media headlines would be completely different.
The incentive structure of investment banks naturally favors low floats – a smaller float makes the first-day gain look better, enhancing the bank's reputation.
Then there are the cornerstone investors. The cornerstone system in Hong Kong is essentially a trade-off: "I help lock up your chips, and you guarantee me an allocation." The cornerstone investor's benefit is securing a definite IPO allocation (without worrying about downscaling or balloting), at the cost of a 6-month lock-up. But this cost often turns into a reward – because the cornerstones lock up most of the float, very few chips remain for trading, making the stock price easy to push up.
When the lock-up expires after 6 months, if the stock has risen several times due to the low float, the cornerstone's return far exceeds a normal IPO. The cornerstone system ties "helping the company lock up chips" with "making more money for oneself," perfectly aligning the interests of both parties.
Zhipu's 11 cornerstone investors (including Hillhouse Capital, Taikang Life Insurance, GF Fund, etc.) took 70% of the already small public float, resulting in a final floating share ratio of less than 4%. All are locked up for 6 months. While helping Zhipu lock up its float, they are also creating scarcity premiums for themselves.
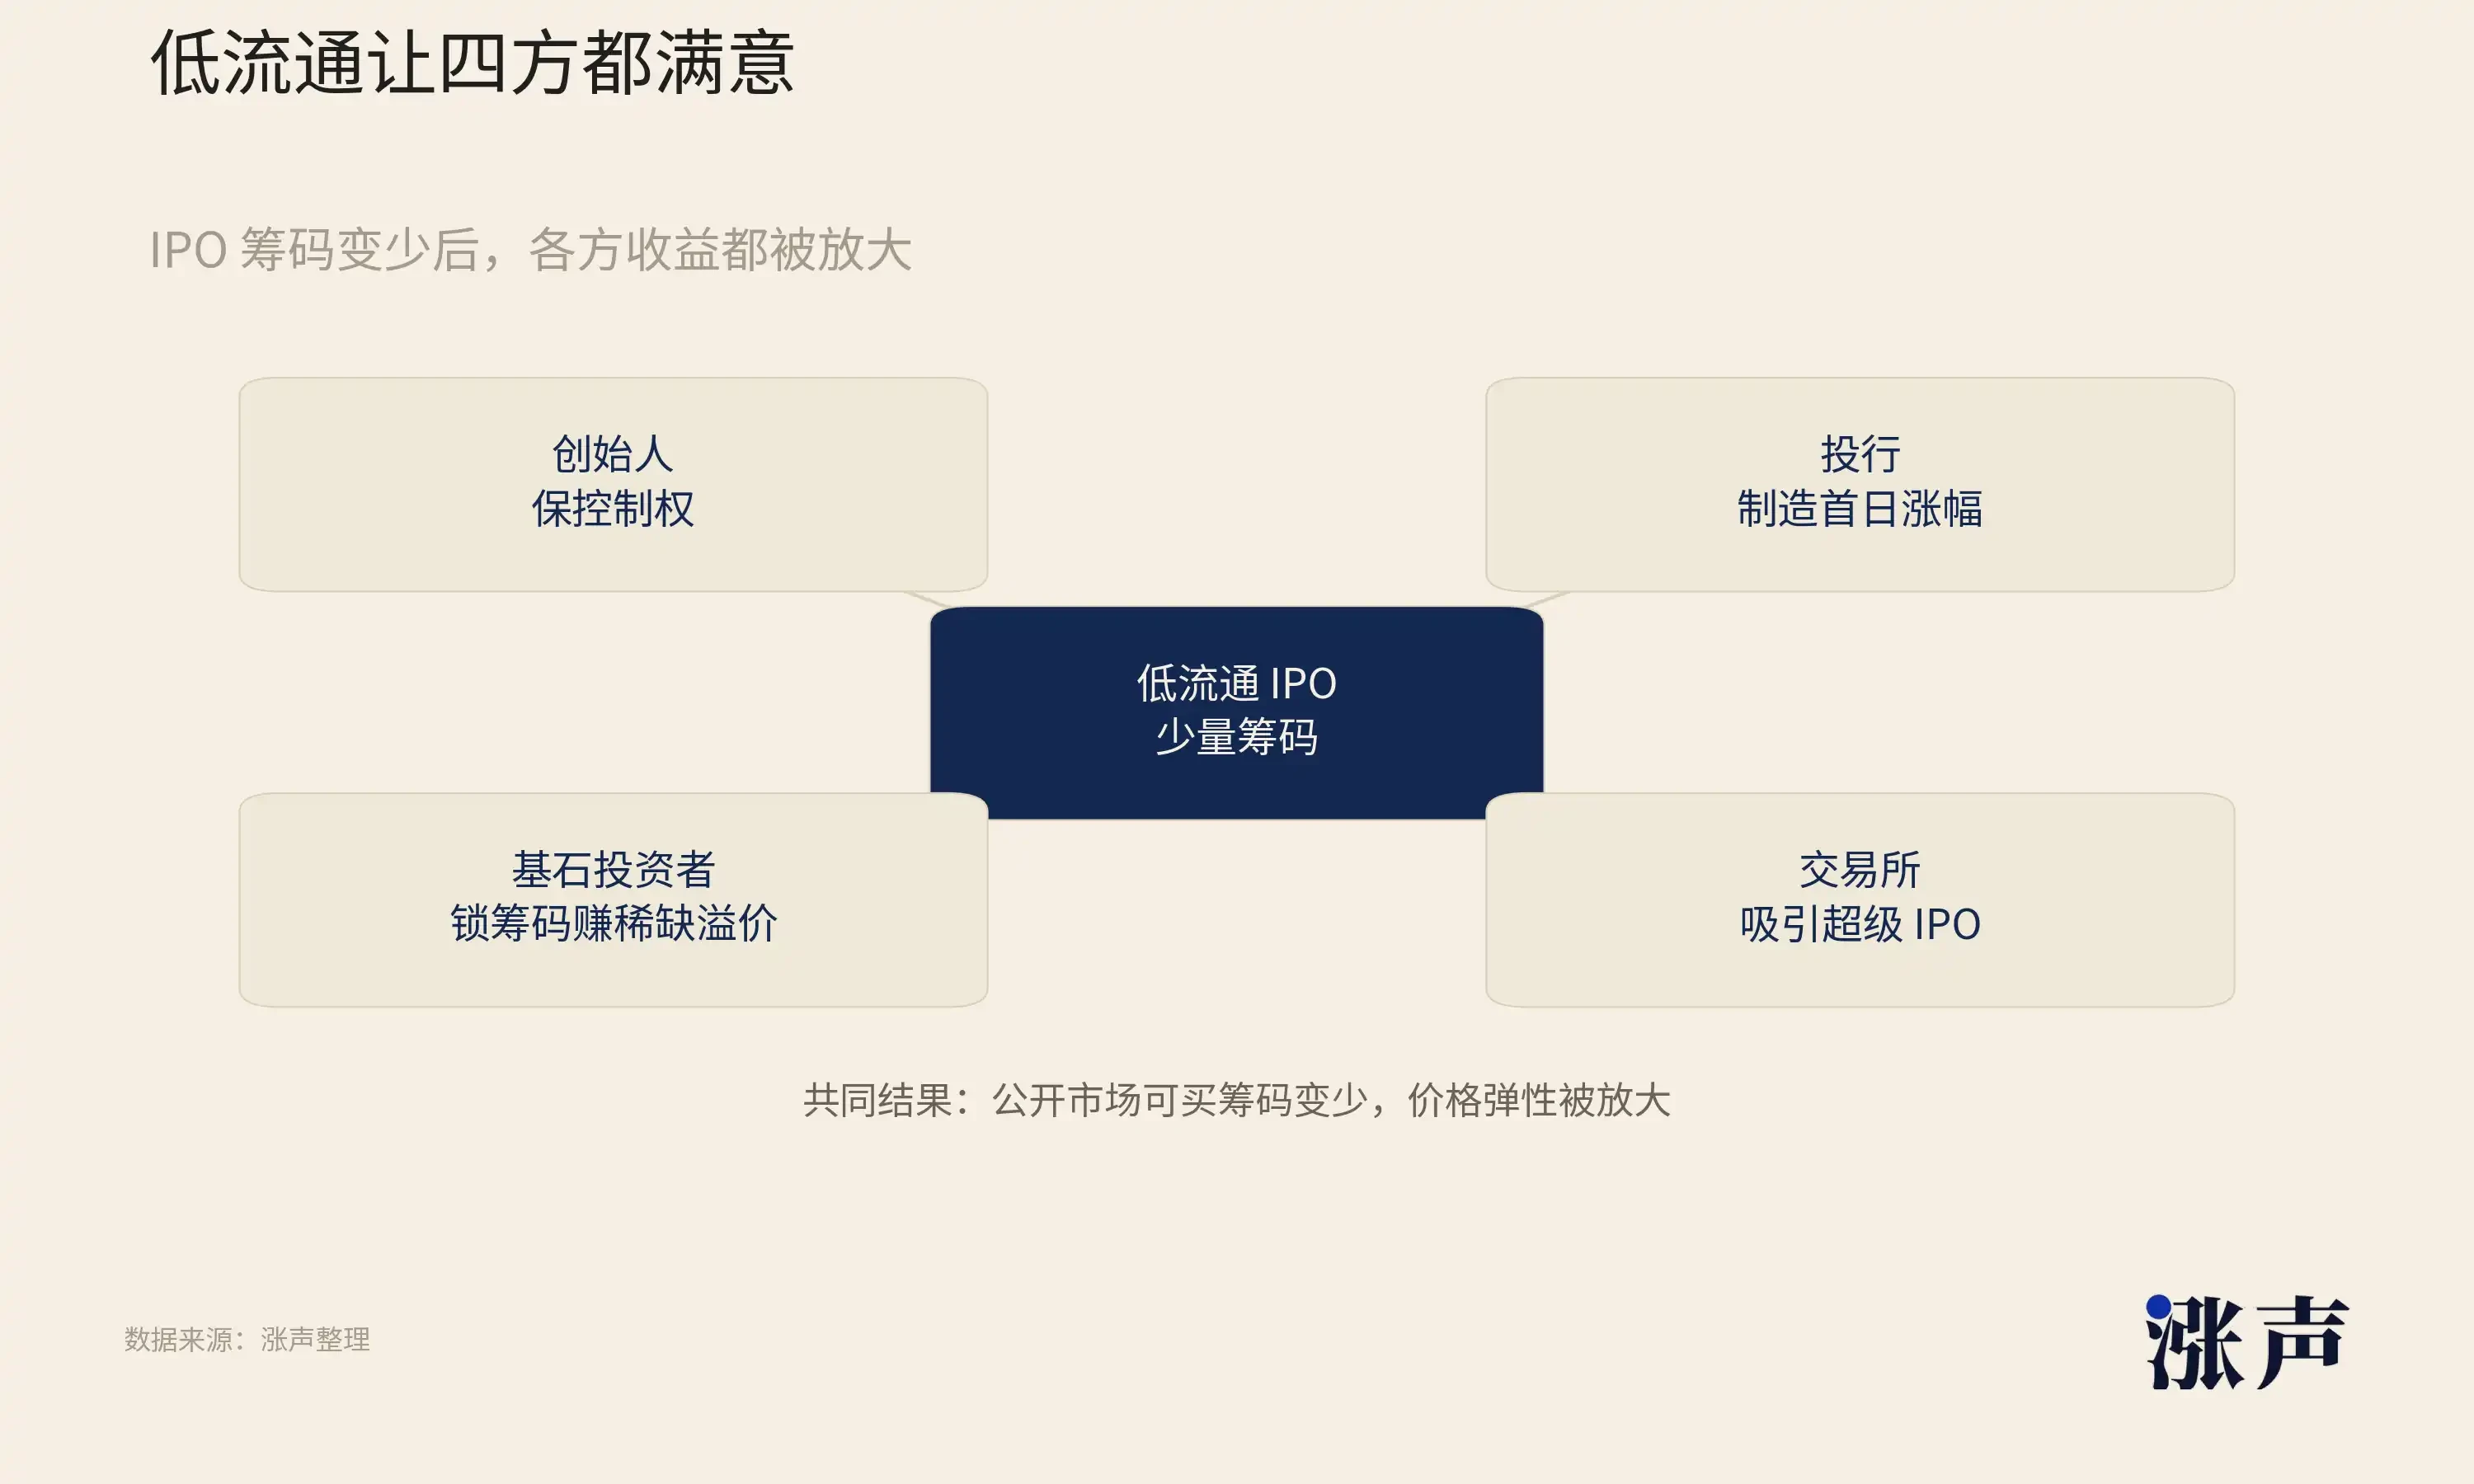
We can therefore even observe a systemic turning point from the Nasdaq trading platform, which abolished the 10% minimum public float threshold.
This rule had existed for decades. A listed company needed to have at least 10% of its shares in public hands to ensure sufficient market liquidity and protect the interests of public investors. The S&P 500 is stricter, requiring its constituent stocks to have a certain minimum public float. MSCI requires 15%. The Russell series requires 5%.
The precedent effect of this is far-reaching. If Nasdaq can abolish the 10% threshold for SpaceX, what obstacle remains for the next company wanting to list with a 3% float? If the largest US trading platform finds low floats acceptable, will other platforms follow suit? Hong Kong Stock Exchange's cornerstone system already allows locking up most IPO chips. If Nasdaq also loosens restrictions, will we see a global competition where trading platforms compete to be more friendly to low floats in order to attract the best IPO candidates?
Primary Investment, Secondary Hedging: The Stock Market Begins to Replicate Old Crypto Tropes
In the 1990s, as the options market matured, the zero-cost collar became a standard tool for the wealthy. You hold a stock, buy a put option to protect downside (costs money), and simultaneously sell a call option to earn back the cost (collects premium). The two sides offset, locking in a price range for free. In the late 1990s, Michael Dell used variable prepaid forwards to cash out a portion of his Dell shares without triggering taxes, reducing his holdings, but getting cash upfront.
But previously, this was used only by a few super-wealthy individuals and founders. Now, after SpaceX's listing, wealth management firms are publicly offering this plan to thousands of employees, on a completely different scale. Wealth managers like Bernstein and Mercer are now directly providing guides teaching SpaceX employees how to execute collars. This level of普及 is unprecedented.
A report from Bernstein includes a sobering set of data. They reviewed all US IPOs raising over $50 million in the past decade and found that six months after the lock-up expiration, the median return was a decline of about 10%. One in ten IPOs fell by at least 62% within six months of the lock-up expiry. The conclusion is direct: if you are a SpaceX employee holding locked shares, statistically, the price when you are able to sell will likely be lower than it is today. So


