
AI Real Growth vs. BofA's 70% Bear Market Signal: Should You Run from U.S. Stocks?
- Core Thesis: The U.S. stock market is currently caught in a contradiction between historical top-risk signals and strong AI fundamentals. The AI bull market is not over, but has transitioned from a "buy growth" phase to a "prove growth delivery speed" phase, where odds have worsened and the margin for error has narrowed.
- Key Factors:
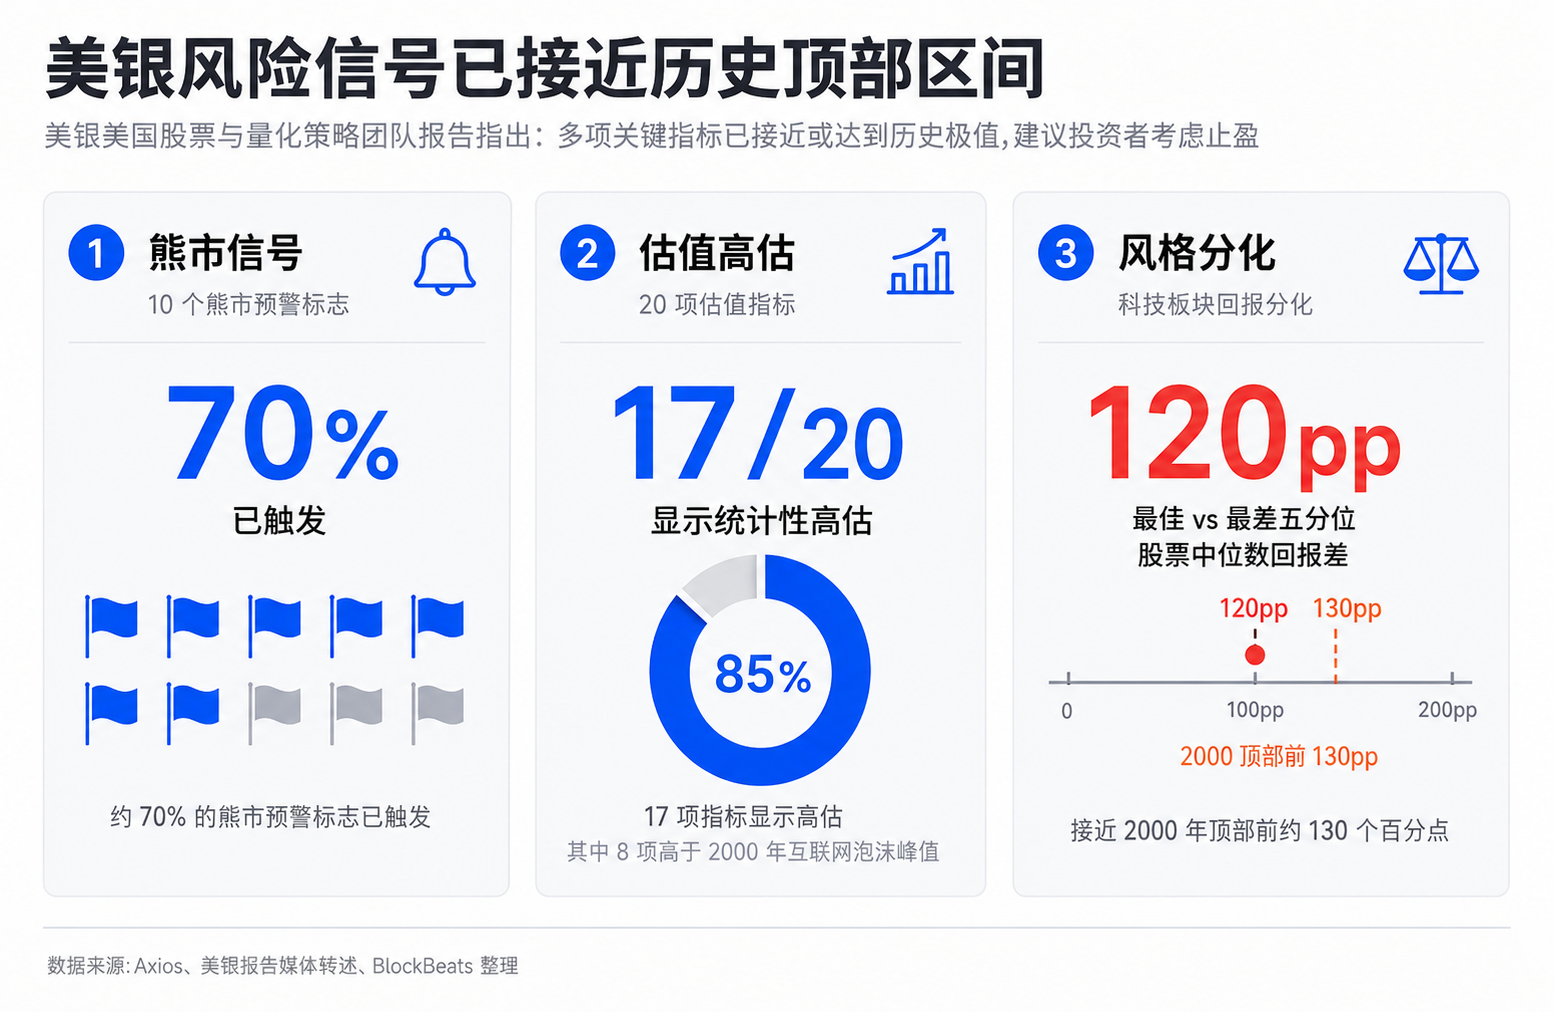
- A Bank of America report indicates that approximately 70% of its 10 tracked bear market warning signals have been triggered. Of the 20 valuation metrics for the S&P 500, 17 show statistical overvaluation, with 8 exceeding levels seen at the peak of the 2000 internet bubble.
- Market breadth has deteriorated. The return gap between the best and worst quintiles of tech stocks is roughly 120 percentage points, close to the 130 percentage points seen before the March 2000 peak. The index's rise is heavily dependent on a few AI leaders.
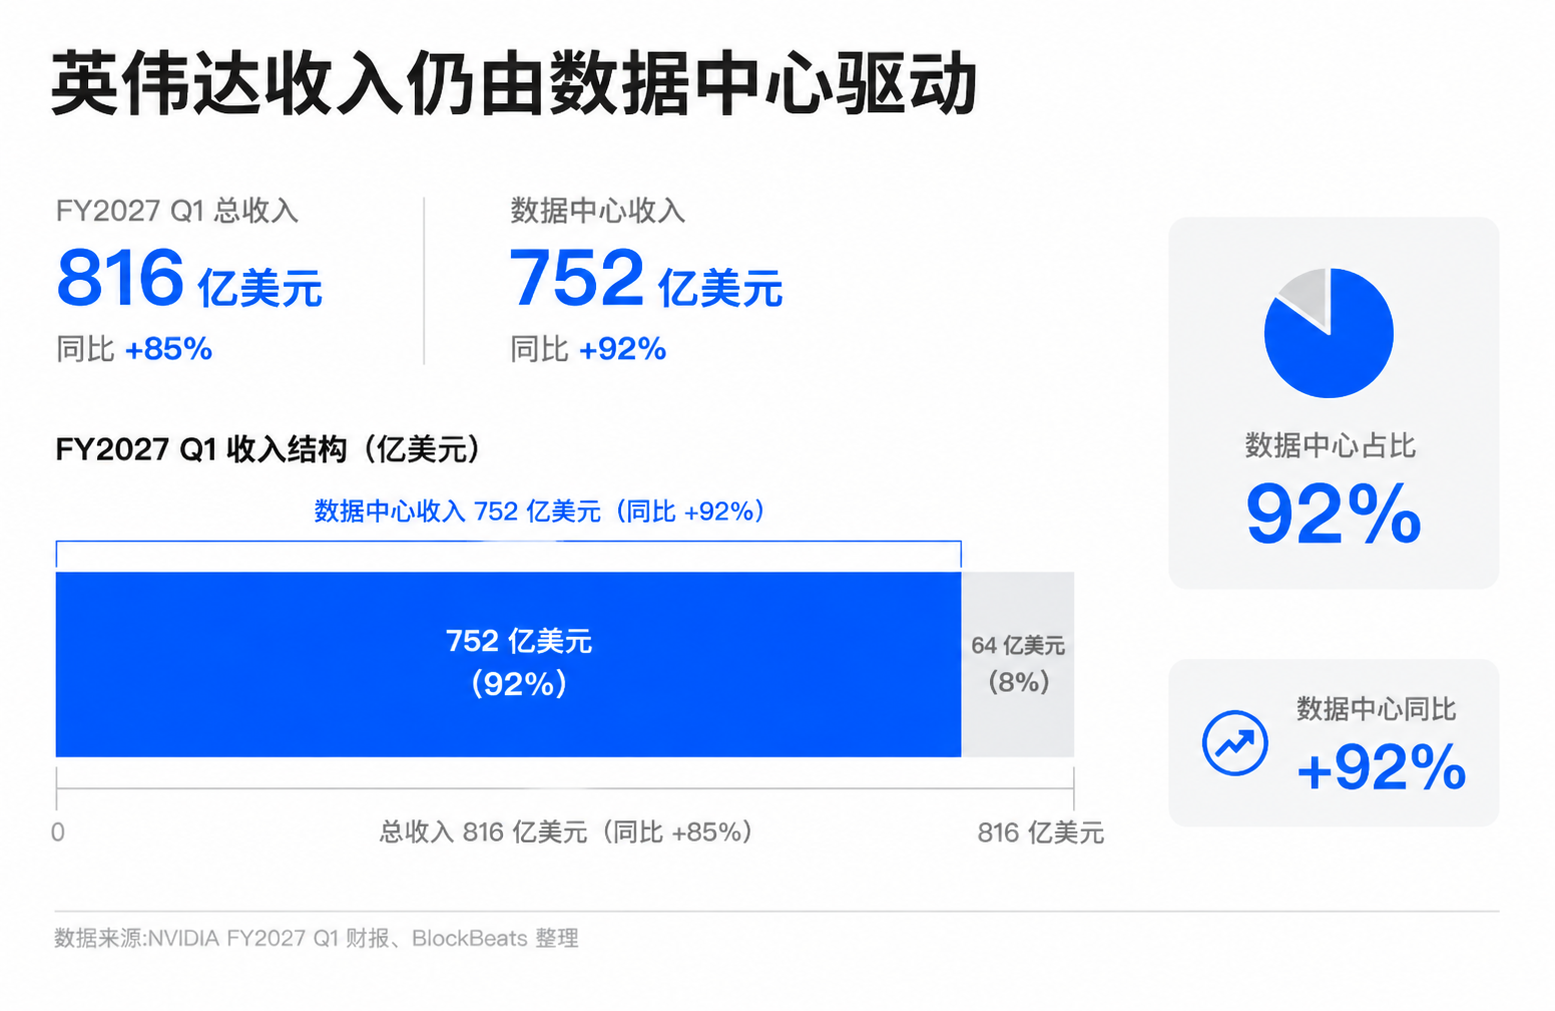
- AI fundamentals remain strong. Nvidia's FY2027 Q1 revenue reached $81.6 billion, with data center revenue of $75.2 billion, up 92% year-over-year. Cloud vendors continue to increase capital expenditures. This is fundamentally different from the 2000 bubble, which lacked viable business models.
- The core risk lies in prices already reflecting too much future growth. The market is beginning to demand that AI investments translate into higher revenue, profit margins, and free cash flow. The pressure of capital expenditure on free cash flow has become a focal point.
- Earnings reports in the second half of the year will be a key verification window. We need to observe whether tech companies' AI revenue can sustain growth, whether profit margins are being eroded by capital expenditure, and whether market breadth can improve to digest valuation risks.
TL;DR
- Bank of America warns of excessive risk signals in U.S. stocks, advising investors to take profits and control risk.
- AI leaders still have revenue and capital expenditure support, but the market has already priced in a lot of future growth.
- Related tickers: SPY, QQQ, NVDA, MSFT, GOOGL, AMZN, META, AVGO, AMD, SOXX.
U.S. stock investors are now facing a situation that goes beyond simple bullish or bearish views.
On one side is Bank of America's U.S. Equity and Quantitative Strategy team, led by Savita Subramanian. On June 5, the team published a client note titled "Too many red flags. Take profits." According to an Axios report on June 9, the note suggests that risk signals in U.S. stocks are already excessive, offering a more direct portfolio recommendation: take profits.
On the other side is the still-strong AI fundamentals. Microsoft, Google, Amazon, and Meta continue to increase AI and data center capital expenditures. Nvidia's data center demand remains the core anchor of the semiconductor cycle. Unlike the 2000 dot-com bubble, the current market leaders are giants with substantial cash flow, profits, cloud revenue, and chip orders.
So the real question has shifted from "Is AI a bubble?" or "Is BofA calling the top?" to another, more difficult question: When historic top signals coexist with genuine AI growth, how should investors understand the current risk in U.S. stocks?
The answer might be more uncomfortable than simply turning bearish: The AI bull market may not be over, but it has transitioned from a "buying growth" phase to a "testing the speed of growth delivery" phase.
BofA Warns of Deteriorating Odds
The value of BofA's report lies in placing the current market within a historical risk structure, rather than predicting an exact top.
According to multiple financial media outlets citing the BofA report, approximately 70% of the 10 bear market warning signals it tracks have been triggered. This ratio is close to the average level seen before several peaks in the S&P 500 since 1990. BofA's framework also shows that 17 out of 20 valuation metrics for the S&P 500 indicate statistical overvaluation, with 8 exceeding peaks from the 2000 dot-com bubble. The CAPE (Cyclically Adjusted Price-to-Earnings ratio), or P/E10, is around 40, placing it in an extremely high historical range.
Each of these numbers can be argued against individually. High valuations don't guarantee a drop tomorrow. Historical signals are not always accurate. The stronger profits of AI companies indeed make today different from 2000. However, when valuation, market breadth, style divergence, and momentum all show extreme readings simultaneously, BofA's key message is closer to: the market can still be held, but the risk-reward profile has deteriorated.
Market breadth is the key factor here. The index is still at highs, but the rally is increasingly reliant on a handful of AI and tech leaders. The current U.S. stock market exhibits a narrow leadership characteristic similar to historical market peaks: a few stocks contribute the majority of the index's gains, the percentage of S&P 500 components trading above key moving averages has declined, and many individual stocks are not near their own highs. The strength shown by the index masks the declining internal participation.
Style divergence is also reinforcing the same signal. BofA notes that the median return difference between the best and worst quintile of tech stocks is approximately 120 percentage points, the highest since February 2000, and close to the 130 percentage points seen before the March 2000 peak. This looks more like capital concentrated betting on a few narratives of certainty, rather than the broad-based diffusion seen in typical bull markets.
For investors holding SPY, QQQ, NVDA, or SOXX, the most dangerous aspect of this structure is the lower margin for error. The index can certainly continue to rise. But when gains are increasingly determined by a few stocks, any deviation in earnings, guidance, capital expenditure returns, or valuation assumptions by a single leader can be amplified into a drawdown for the entire portfolio.
AI This Time Cannot Simply Be Compared to 2000
If one only looks at BofA's valuation and breadth signals, it's easy to directly compare the current market to the year 2000. But this comparison only tells half the story.
A typical feature of the 2000 dot-com bubble was that many companies lacked mature business models, and investors were primarily trading on the vision of "the internet changing the world." Today's AI leaders are different. The cloud and AI businesses of Microsoft, Google, Amazon, and Meta are reflected in real revenue, capital expenditure plans, and data center demand. Nvidia is not just a narrative center; it is also a chip supplier with highly concentrated profits and cash flow.
Nvidia's latest earnings report provides the strongest support for the bulls. The company's FY2027 Q1 earnings report, announced in May 2026, showed quarterly revenue of $81.6 billion, with data center revenue of $75.2 billion, up 92% year-over-year. Faced with these numbers, simply labeling the AI rally a "bubble without fundamentals" lacks conviction.
AI optimists, including management teams of large tech companies and growth investors, base their rebuttal to the bubble theory on this point. They argue that this rally is more like an infrastructure cycle: training and inference demand drives GPUs, networking, storage, power, data center construction; cloud providers use higher capex for future AI service revenue; and enterprises further integrate AI into software, advertising, search, office, and development processes.
This framework has a factual basis. Over the past few earnings seasons, large cloud providers have consistently emphasized strong AI demand, with their cloud businesses maintaining growth. Nvidia's data center revenue has become a key pillar of the U.S. stock market's earnings growth narrative. Broadcom, AMD, and data center/power infrastructure companies are also part of this investment chain. The market's willingness to assign higher valuations to these companies stems not just from a compelling story but from the realization of orders, revenue, and profits.
This is also why BofA's signals cannot be crudely interpreted as "the AI bull market is over." If underlying fundamentals continue to improve, a high-valuation rally can persist longer than historical experience suggests, especially in a market where passive flows, index weightings, and institutional allocations collectively reinforce the dominance of leaders. The strong getting stronger is itself a part of the flow mechanism.
But AI being real does not mean its valuations are safe. A common misunderstanding arises here: the assumption that if a technological revolution is genuine, its price cannot be expensive. Historically, many bubbles were built precisely on real technologies being priced too early and too fully. The internet genuinely changed the world, but investors who bought many internet stocks in 2000 still experienced a prolonged period of valuation compression.
The central disagreement in the current AI rally is shifting from "Is AI useful?" to "How many years of future growth has the market already priced in?" BofA's historical signals are important precisely because they remind investors: even if the fundamentals are real, risk still rises when prices have already discounted too much good news.
Pressure Shifts to Revenue and Cash Flow
The AI bull market enters its most difficult phase, not because demand suddenly disappears. The real change is that the market begins demanding more proof.
Over the past two years, investors were willing to pay high valuations for AI leaders because the growth path seemed clear: cloud providers increase capex, chip companies sell more high-end GPUs, data center and networking equipment companies receive orders, and future enterprise applications unlock larger revenues. Entering 2026, the market needs to see not just continued investment, but whether that investment translates into sufficiently high revenue, profit margins, and free cash flow.
Capital expenditure is the focal point of this issue. Microsoft, Google, Amazon, and Meta continue to increase AI and data center investments, the direction is clear, but estimates of specific scale vary significantly among different institutions and media. More importantly, investors are beginning to worry about the pressure higher capex places on free cash flow and return on invested capital. This cannot be simply stated as "AI investments cannot be recouped," but as the investment curve steepens, the market's demands on the return curve also increase.
For Microsoft, Google, Amazon, and Meta, continuing to increase AI investment is strategic necessity. Whoever stops risks falling behind in cloud, search, advertising, office suites, models, and developer ecosystems. However, from a shareholder perspective, the higher the capex, the more future earnings reports need to prove that these investments generate revenue growth, stable margins, and resilient cash flow.
The logic is slightly different for the semiconductor chain represented by Nvidia, Broadcom, AMD, and SOXX. They are direct beneficiaries of the AI investment cycle, with orders and profits materializing earlier. But precisely because the market already views them as core winners of the AI infrastructure cycle, any sign of cloud providers slowing capex, delaying purchases, or emphasizing investment discipline will cause semiconductor valuations to react first.
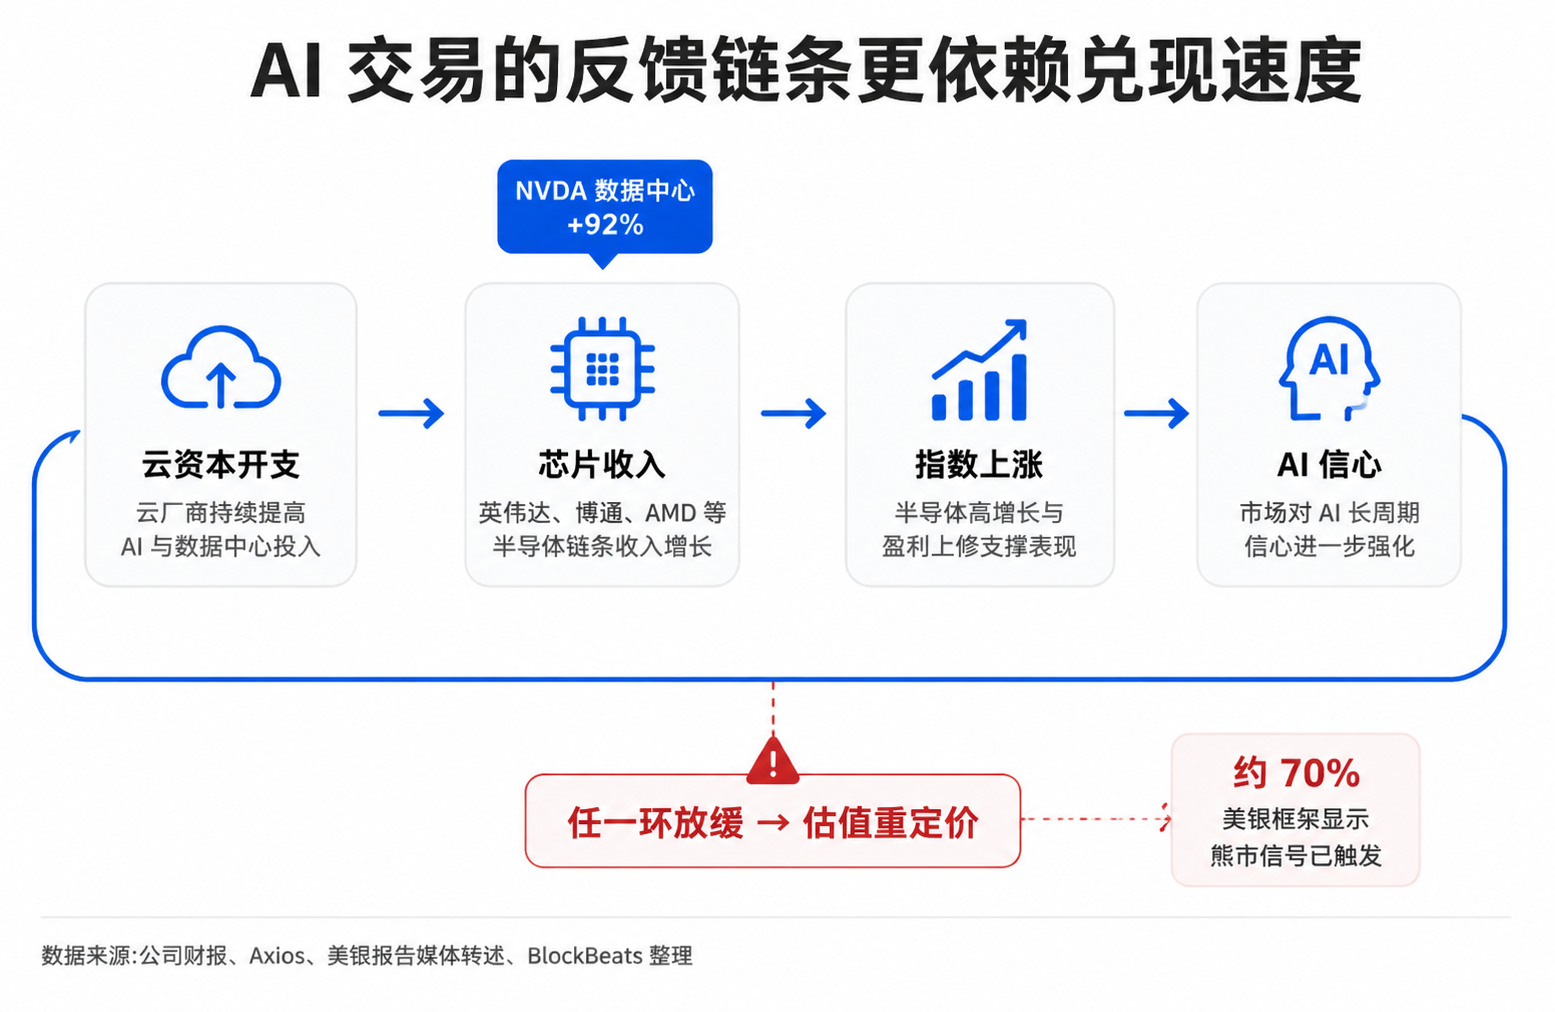
This creates a more fragile feedback loop. Cloud giants increase capex, supporting chip company revenues. Chip companies' high growth supports index gains. Index gains and earnings upgrades, in turn, reinforce market confidence in the long AI cycle. If any link in this chain shows signs of slowing, the market may not face "the end of AI," but rather valuations needing to realign with the pace of delivery.
H2 Earnings Need to Prove Growth Can Cover Risks
BofA's 70% bear signal will not automatically become a market top, and the strong earnings of AI leaders will not automatically eliminate valuation risks. What truly needs verification next is whether sustained growth can offset these risk signals in valuation and market structure.
The most immediate window for observation is the earnings season in the second half of 2026. Investors need to see continued growth in AI revenue for large tech companies, while profit margins are not significantly eroded by capital expenditure and depreciation pressures. Cloud providers, while continuing to invest, also need to demonstrate that customer demand remains strong. For semiconductor companies like Nvidia, Broadcom, and AMD, orders and guidance will reflect whether the pace of downstream investment is slowing.
Another variable is market breadth. If the S&P 500 and Nasdaq continue to hit new highs, but fewer stocks participate in the rally, and high-P/E stocks systematically outperform low-P/E stocks, BofA's described historical top structure will become harder to ignore. Conversely, if earnings growth broadens to more sectors and the index relies less on a few AI leaders, risk signals have a chance to be gradually absorbed by time and earnings performance.
For ordinary investors, the current environment is more suitable for portfolio and concentration checks. A simple "bullish on AI" or "bearish on U.S. stocks" stance will not suffice. AI may still be the most important investment theme for years to come. But with valuations, breadth, and capital expenditure pressure all elevated simultaneously, continuing to hold it has shifted from an early trend discovery to a bet on the speed of delivery.


