
BitMart Insights: January Crypto Market Review and Hotspot Analysis
- Core View: The crypto market exhibited a range-bound, volatile pattern in January. Market activity showed signs of recovery, but there was significant divergence between bullish and bearish sentiments, lacking a clear trend. On the macro front, the Federal Reserve maintained a cautious and steady policy stance, while US stocks fluctuated at high levels. Internally, the crypto market made key progress on structural issues such as stablecoin regulation, the evolution of technical standards, and changes in platform governance.
- Key Elements:
- Market Performance: Both the total market capitalization and trading volume of the crypto market showed range-bound volatility in January. Spot ETFs for BTC and ETH saw net inflows of $2.23 billion and $500 million respectively, indicating a recovery in institutional allocation demand.
- Regulatory Dynamics: The CLARITY Act made procedural progress in the Senate, but partisan divisions remain evident. World Liberty Financial applied for a national trust bank charter, accelerating the compliance process for stablecoins.
- Technical Progress: The ERC-8004 standard officially launched on the Ethereum mainnet, working in conjunction with the x402 micropayment protocol to lay the foundation for a decentralized AI agent economy.
- Platform Governance: Platform X banned InfoFi projects, leading to a sector-wide pullback. This reflects the platform's adjustment of incentive and traffic distribution logic, strengthening its control over its own ecosystem.
- Capital Flows: The total circulating supply of stablecoins saw a slight decline. However, emerging stablecoins like USD1 experienced significant counter-trend growth, indicating structural capital migration within a存量博弈 (stock game) environment.

TL,DR
- The Federal Reserve maintained interest rates unchanged this month, adhering to policy independence. While inflation has moderated, it remains above target. The job market shows resilience but new job additions have slowed. The overall policy stance remains cautious and steady. U.S. stocks experienced volatile upward movement at high levels, driven by AI and earnings expectations, but political uncertainty, fiscal expansion, and external risks continue to cause market disturbances. Looking ahead to February, if inflation continues to decline, U.S. stocks are expected to fluctuate upwards, but volatility from policy divergence and geopolitical risks still warrants caution.
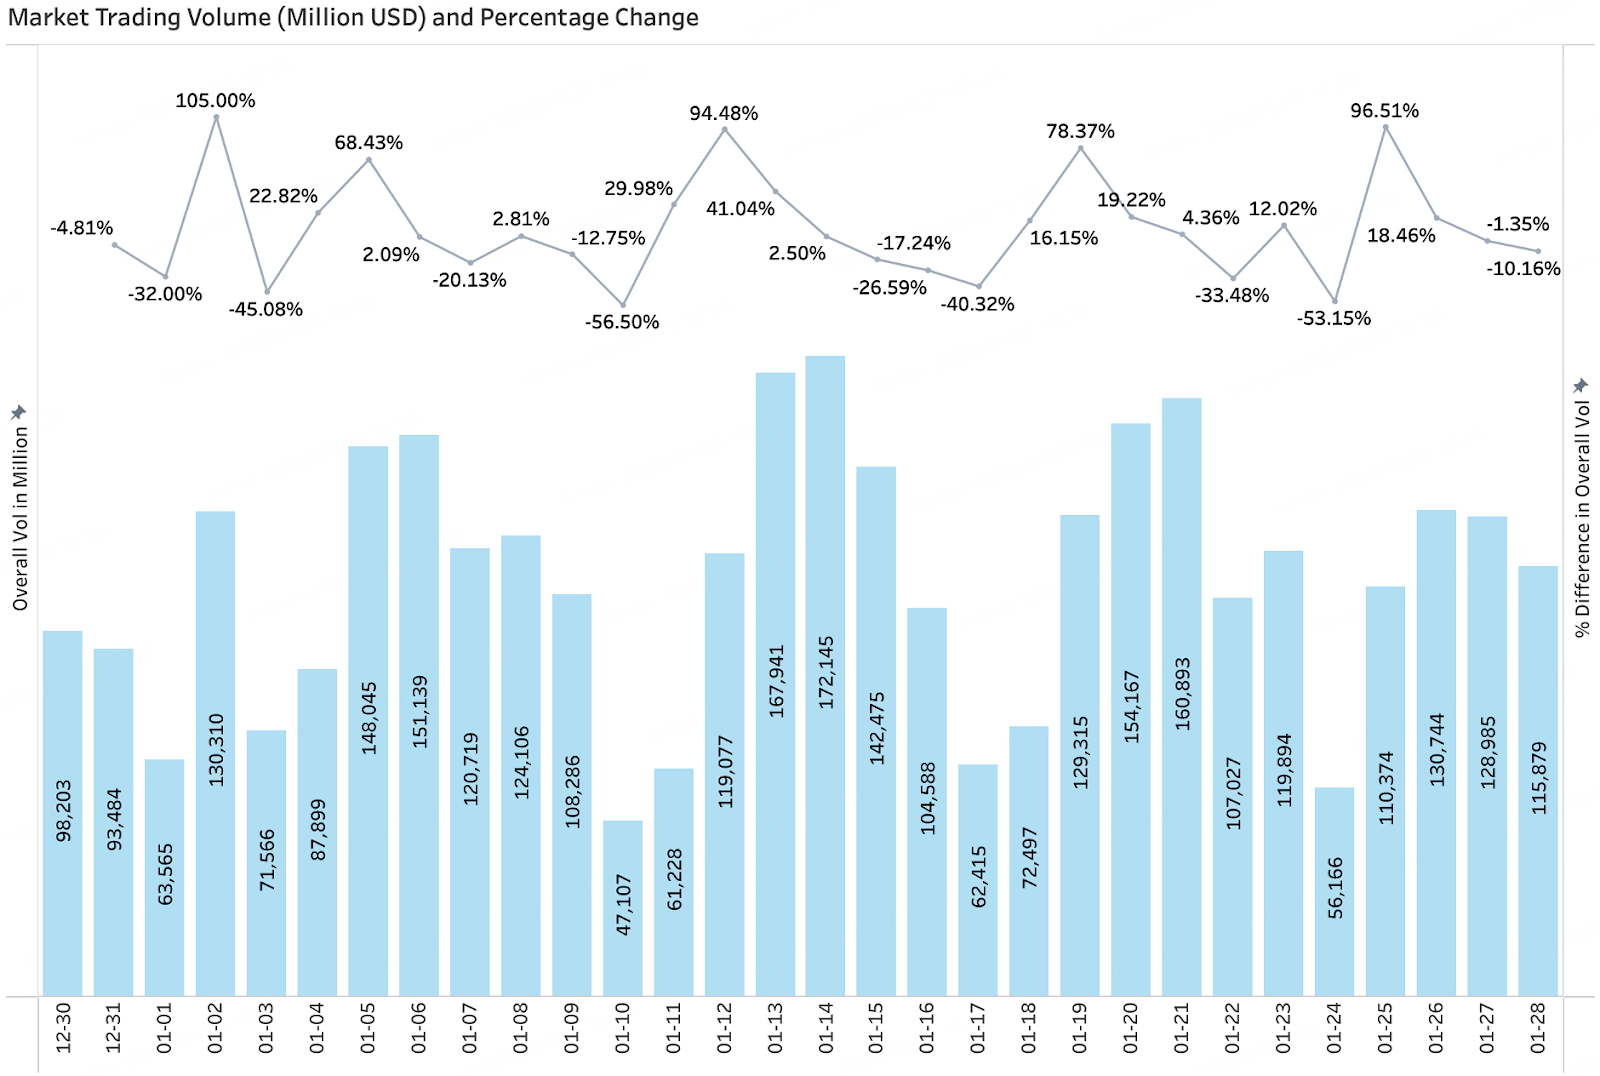
- In January, both trading volume and total market capitalization in the crypto market exhibited range-bound volatility. Volume spikes lacked sustainability, reflecting a recovery in market activity but persistent divergence between bulls and bears, making it difficult to establish a clear trend in the short term. Newly launched popular tokens were still dominated by VC-backed projects, with Brevis, Sentient, Fogo, etc., showing relatively active performance, while the popularity of meme projects lacked staying power.
- In January, BTC and ETH spot ETFs recorded net inflows of $2.23 billion and $500 million respectively, indicating a recovery in institutional risk appetite and renewed demand for mainstream asset allocation. Meanwhile, the total stablecoin circulating supply slightly decreased, but USDT remained stable. Some emerging stablecoins like USD1 and USDE experienced counter-trend growth, reflecting structural capital migration in a market with limited incremental funds.
- Both BTC and ETH broke below key technical levels, with short-term momentum weakening. Any rebound is more likely a technical correction. Key support levels to watch are around $84,000 for BTC and $2,623 for ETH. Although SOL found support and rebounded near $117, it remains suppressed by moving averages, indicating a generally weak and volatile pattern. The risk of accelerated decline if support fails needs to be monitored.
- This month, stablecoins and regulatory issues became core market focuses. World Liberty Financial advanced its application for a national trust bank charter, while the CLARITY Act made procedural progress in the Senate but faced clear partisan division. Meanwhile, X's ban on InfoFi projects triggered a sector-wide pullback, indicating structural changes in platform incentives and traffic governance logic. On the technical front, ERC-8004 officially launched on the Ethereum mainnet, synergizing with the x402 micropayment protocol to lay the groundwork for a decentralized AI agent economy.
1. Macro Perspective
Policy Direction
The Federal Reserve decided to keep interest rates unchanged (maintaining the 3.50%–3.75% range) in its January meeting, showing confidence in the current economy while emphasizing it will continue to adjust policy based on data. Although the market is highly speculative about future rate cuts (some views anticipate possible cuts in M6–M9), policy remains cautious and steady in the short term, with no clear inclination towards significant easing. Fed officials have repeatedly stated their commitment to monetary policy independence, advising future chairs to uphold this principle to prevent political interference in inflation and employment decisions.
U.S. Stock Market Trends
U.S. stocks generally exhibited volatile upward movement at high levels in January. The S&P 500 historically broke through the 7000-point barrier, primarily boosted by the AI sector, strong corporate earnings expectations, and expectations of accommodative policy. Tech stocks led the gains, with heavyweights like Nvidia and Microsoft being key drivers. However, short-term volatility and sentiment divergence persist in the market, with pullback risks emerging especially amid geopolitical and bond market volatility news, but the overall trend remains structurally bullish.
Inflation Data
Latest data shows U.S. inflation has moderated but remains above target: CPI is around 2.6%–2.8% year-over-year, and core CPI also remains at moderate levels. Short-term base effects and rental factors may cause a sequential rebound, but the overall downward trend in inflation has not significantly changed. Structurally, tariffs and supply chain disruptions continue to impact consumer prices, and inflation expectations may remain in a "new normal" range of 2.5%–3% in the medium term.
Employment Data
Recent employment data presents a "contradictory" pattern: non-farm payroll growth was significantly below expectations, while the unemployment rate remained relatively stable or even slightly declined; wage growth still outpaces inflation, indicating companies are improving efficiency amid marginally contracting labor demand. The overall job market maintains resilience, but the growth in new job additions has slowed. Whether the labor market will continue to remain strong is a core variable for future Fed policy considerations.
Political Factors
Political uncertainty continues to cause market disturbances. On one hand, the debate over the Fed Chair appointment and discussions surrounding monetary policy independence have drawn market attention. On the other hand, the Trump administration's aggressive strategies on tariffs and trade policy have increased short-term market volatility, but in the long run, a shift towards negotiation and compromise to ease market sentiment is possible. The risk of a government shutdown is also seen as a potential short-term market suppressant.
Fiscal and External Risks
U.S. fiscal expansion and accommodative measures (such as the MBS purchase program) have positive effects on lowering real financing costs and supporting the real estate market, but may also create marginal upward pressure on the inflation center. Regarding external risks, U.S.-Europe trade friction, geopolitical events (like the Greenland land purchase topic), and global bond market volatility are short-term potential risk points; abnormal volatility in the Japanese bond market and yen also adds uncertainty to the global asset price transmission mechanism.
Outlook for Next Month
Entering February, the market will closely monitor trade negotiation progress, government shutdown negotiation outcomes, the Fed Chair appointment, and upcoming PCE and labor data. Against a backdrop of relatively stable fundamentals, U.S. stocks are expected to continue fluctuating upwards, but policy divergence and external risks may increase volatility. If inflation continues to hover in the 2.5%–3% range, it will open a window for a mid-year rate cut, but policy in the short term remains "data-driven, wait-and-see first." Overall strategy suggests focusing on tech sector earnings and AI growth logic, the safe-haven attributes of precious metals, and asset rotation opportunities driven by macro events.
2. Crypto Market Overview
Token Data Analysis
Trading Volume & Daily Growth Rate
According to CoinGecko data, as of January 28th, overall crypto market trading volume showed significant fluctuations. The average daily volume for the month was roughly concentrated in the $110 billion to $160 billion range, with multiple short-term volume spikes occurring, but these lacked sustainability, often quickly receding, reflecting the market's lack of a clear trend. From a trading structure perspective, active trading was driven more by short-term capital and event-driven factors rather than sustained entry of medium-to-long-term capital. Overall, January's trading volume indicates a recovery in activity but persistent divergence between bulls and bears, with the market more likely to maintain a range-bound pattern.
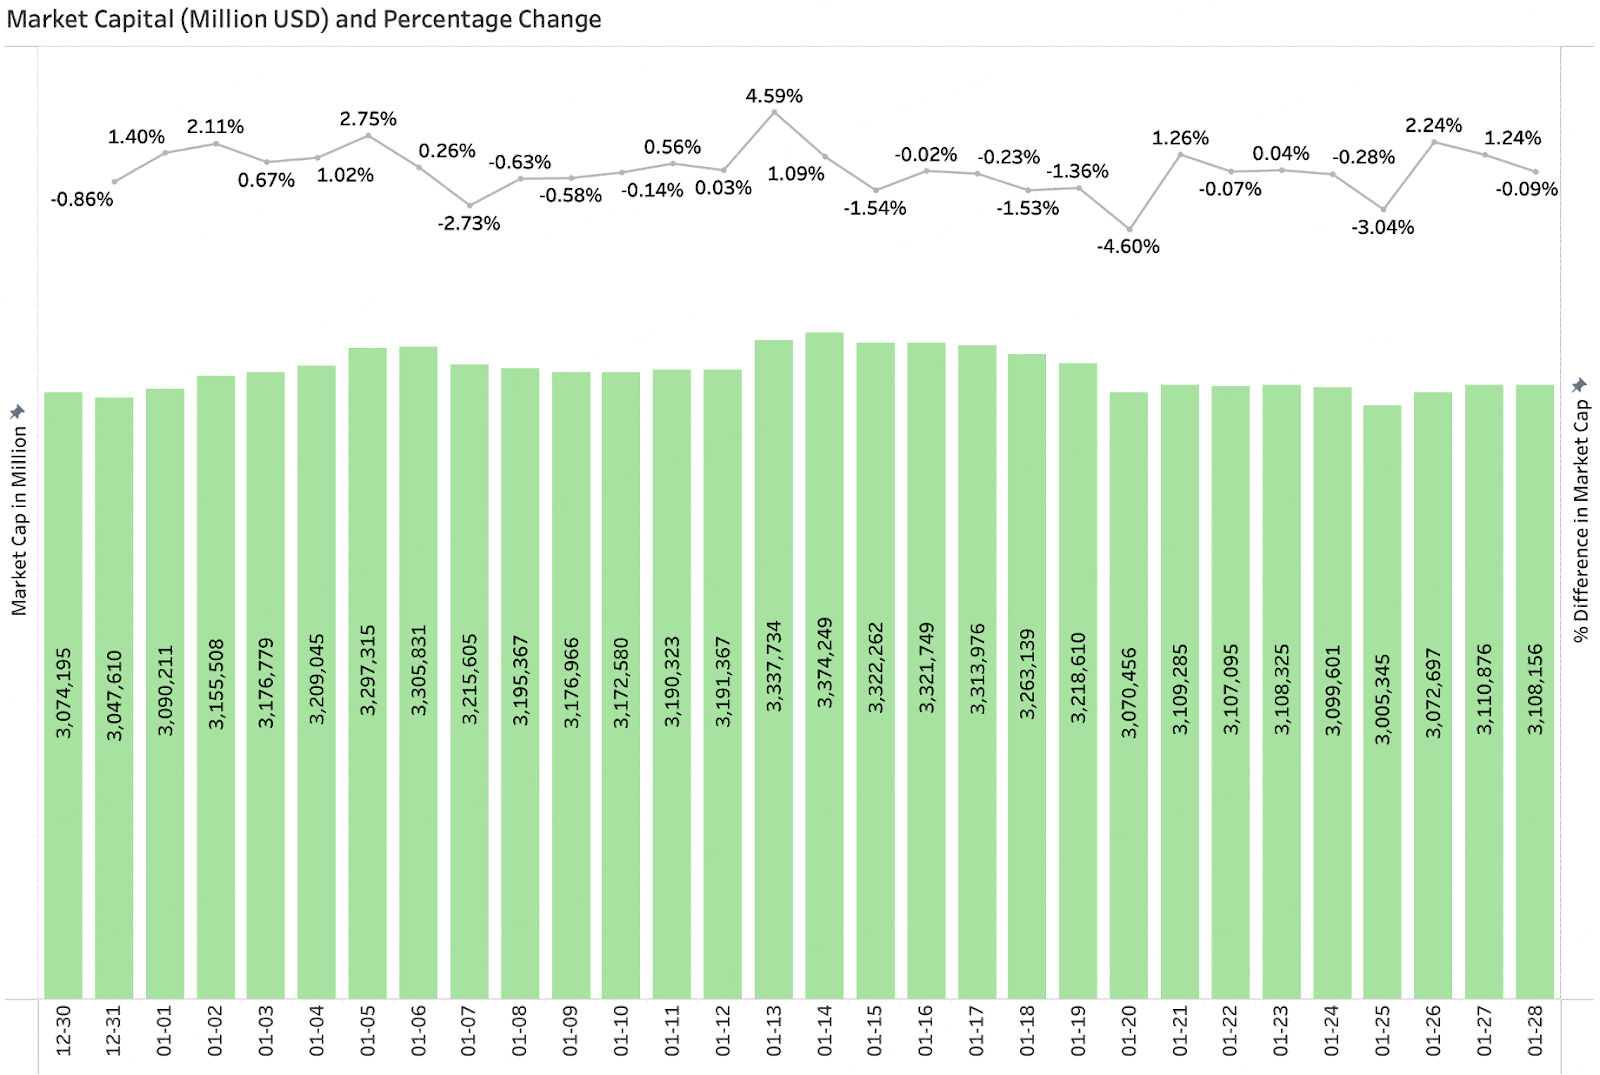
Total Market Capitalization & Daily Growth
According to CoinGecko data, as of January 28th, the overall crypto market capitalization exhibited volatile characteristics. The total market cap for the month mainly moved within the $3.00 trillion to $3.37 trillion range, with relatively controlled overall amplitude. Most trading days saw gains/losses around "±1%," with only occasional staged pullbacks or rebounds at specific points. After briefly touching a stage high mid-month, it failed to form an effective breakout, subsequently retreated, and entered a sideways consolidation phase. Overall, the performance of the total market cap in January reflects that the market has entered a relatively mature volatile stage with balanced forces between bulls and bears, more likely to maintain a range-bound pattern in the short term.
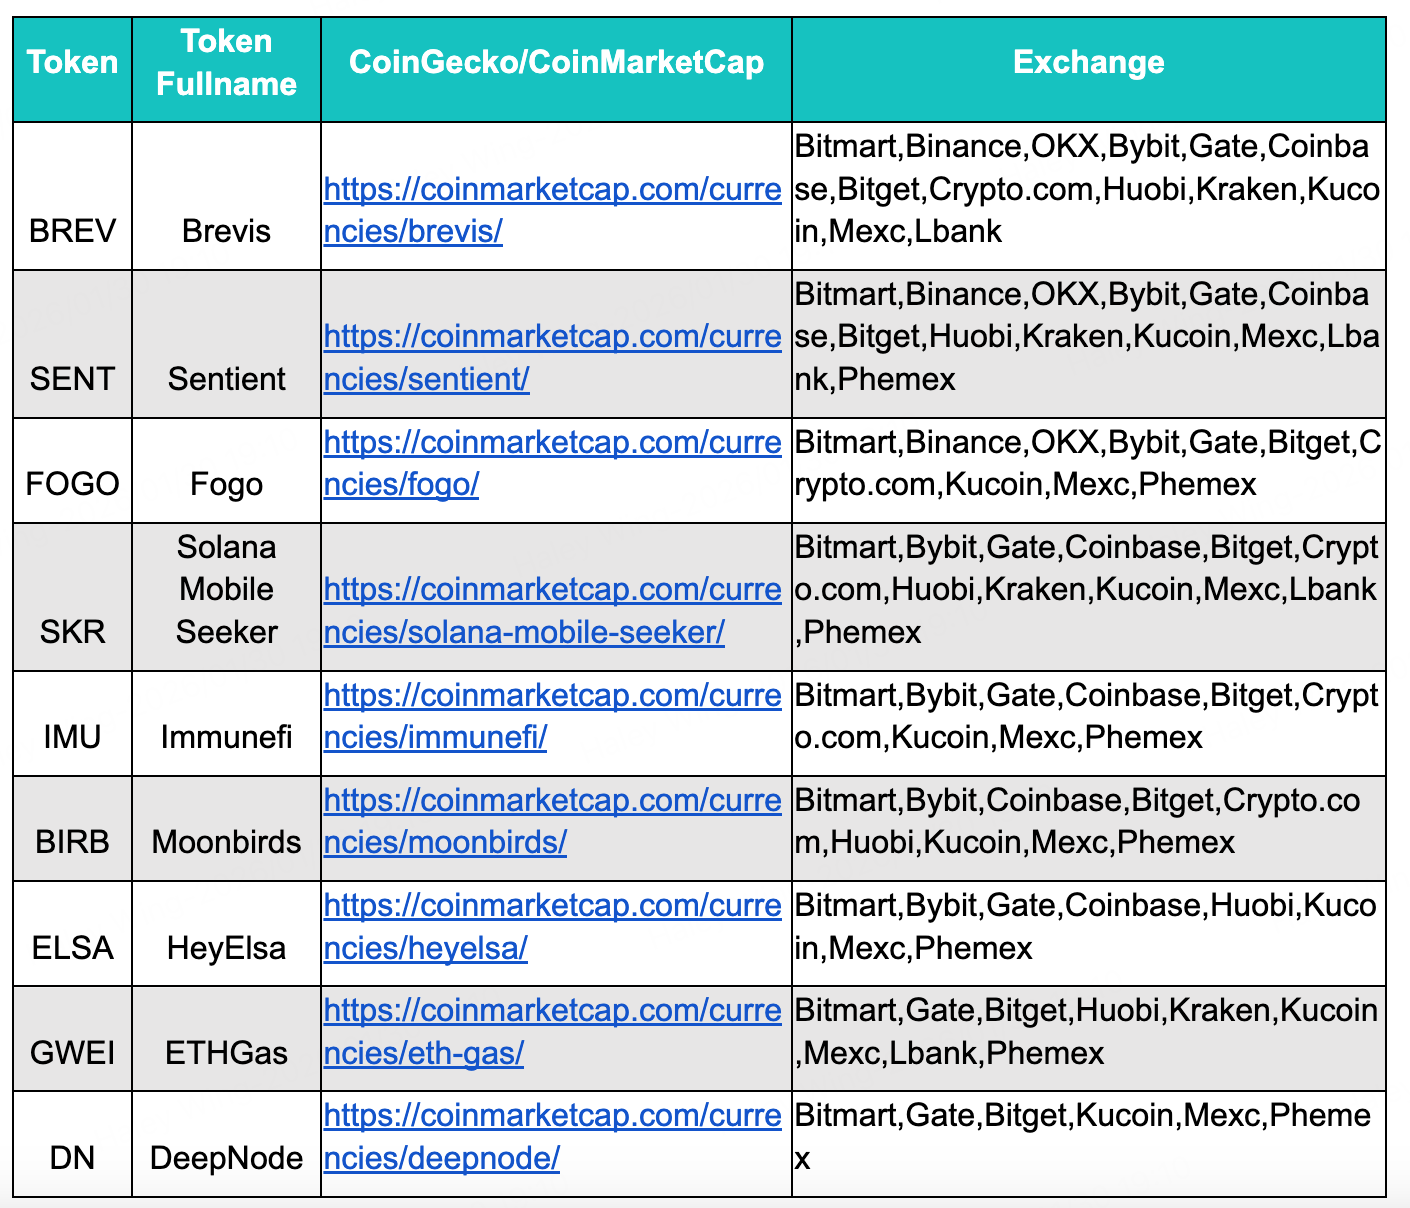
Popular Newly Launched Tokens in January
Popular newly launched tokens in January were still dominated by VC-backed projects, with meme activity lacking sustainability. Among them, projects like Brevis, Sentient, and Fogo stood out, showing relatively active trading volume post-launch.
3. On-Chain Data Analysis
BTC, ETH ETF Inflow/Outflow Analysis
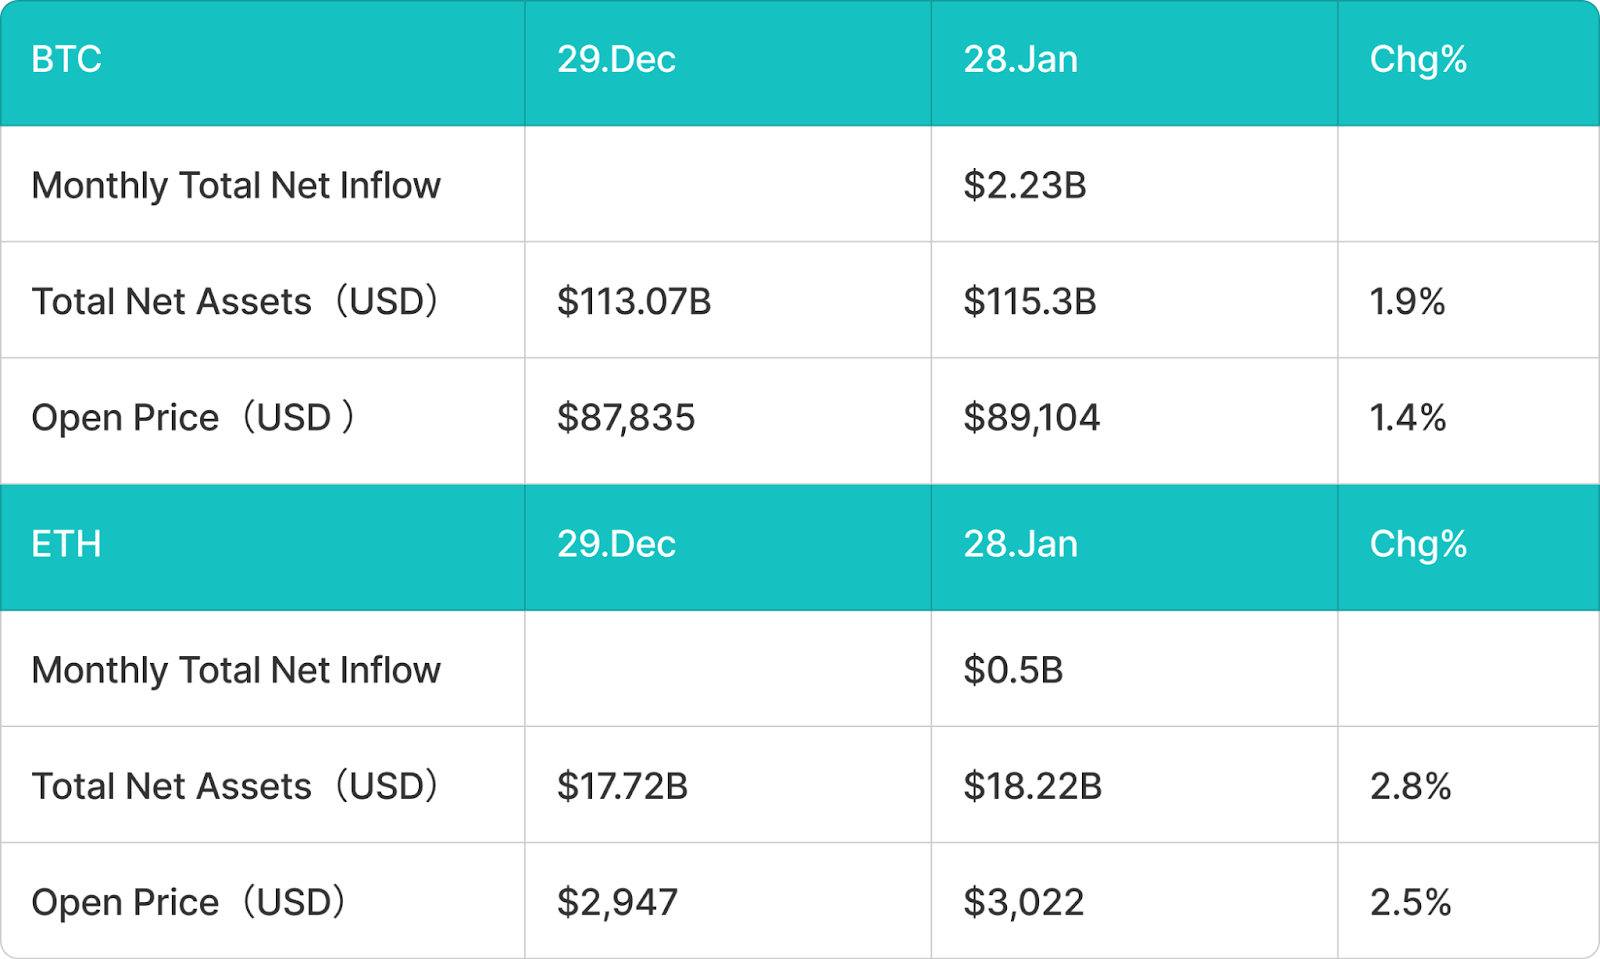
BTC Spot ETF Net Inflow of $2.23 Billion in January
This month saw a significant return of capital to BTC spot ETFs, with a single-month net inflow reaching $2.23 billion, indicating a marginal improvement in institutional capital sentiment. BTC price rose slightly, with the monthly opening price increasing from $87,835 to $89,104, a gain of about 1.4%, driving a synchronous rise in total ETF asset size. Total net assets grew from $113.07 billion to $115.3 billion, a month-on-month increase of 1.9%. After experiencing previous market volatility, overall risk appetite recovered somewhat in January, with funds flowing back into Bitcoin-related allocation tools, reflecting a renewed recognition of BTC's medium-to-long-term value among institutions.
ETH Spot ETF Net Inflow of $500 Million in January
ETH spot ETFs recorded a moderate net inflow this month, with a single-month inflow of approximately $500 million, indicating a steady recovery in market demand for Ethereum asset allocation. ETH price rose from $2,947 to $3,022, a monthly gain of about 2.5%, driving total ETF assets from $17.72 billion to $18.22 billion, a month-on-month increase of 2.8%. Compared to the previous period of capital outflows, ETH ETFs showed signs of stabilization and recovery in January, indicating that institutional investors' confidence in the Ethereum ecosystem and its medium-to-long-term application prospects is gradually being restored.
Stablecoin Inflow/Outflow Analysis
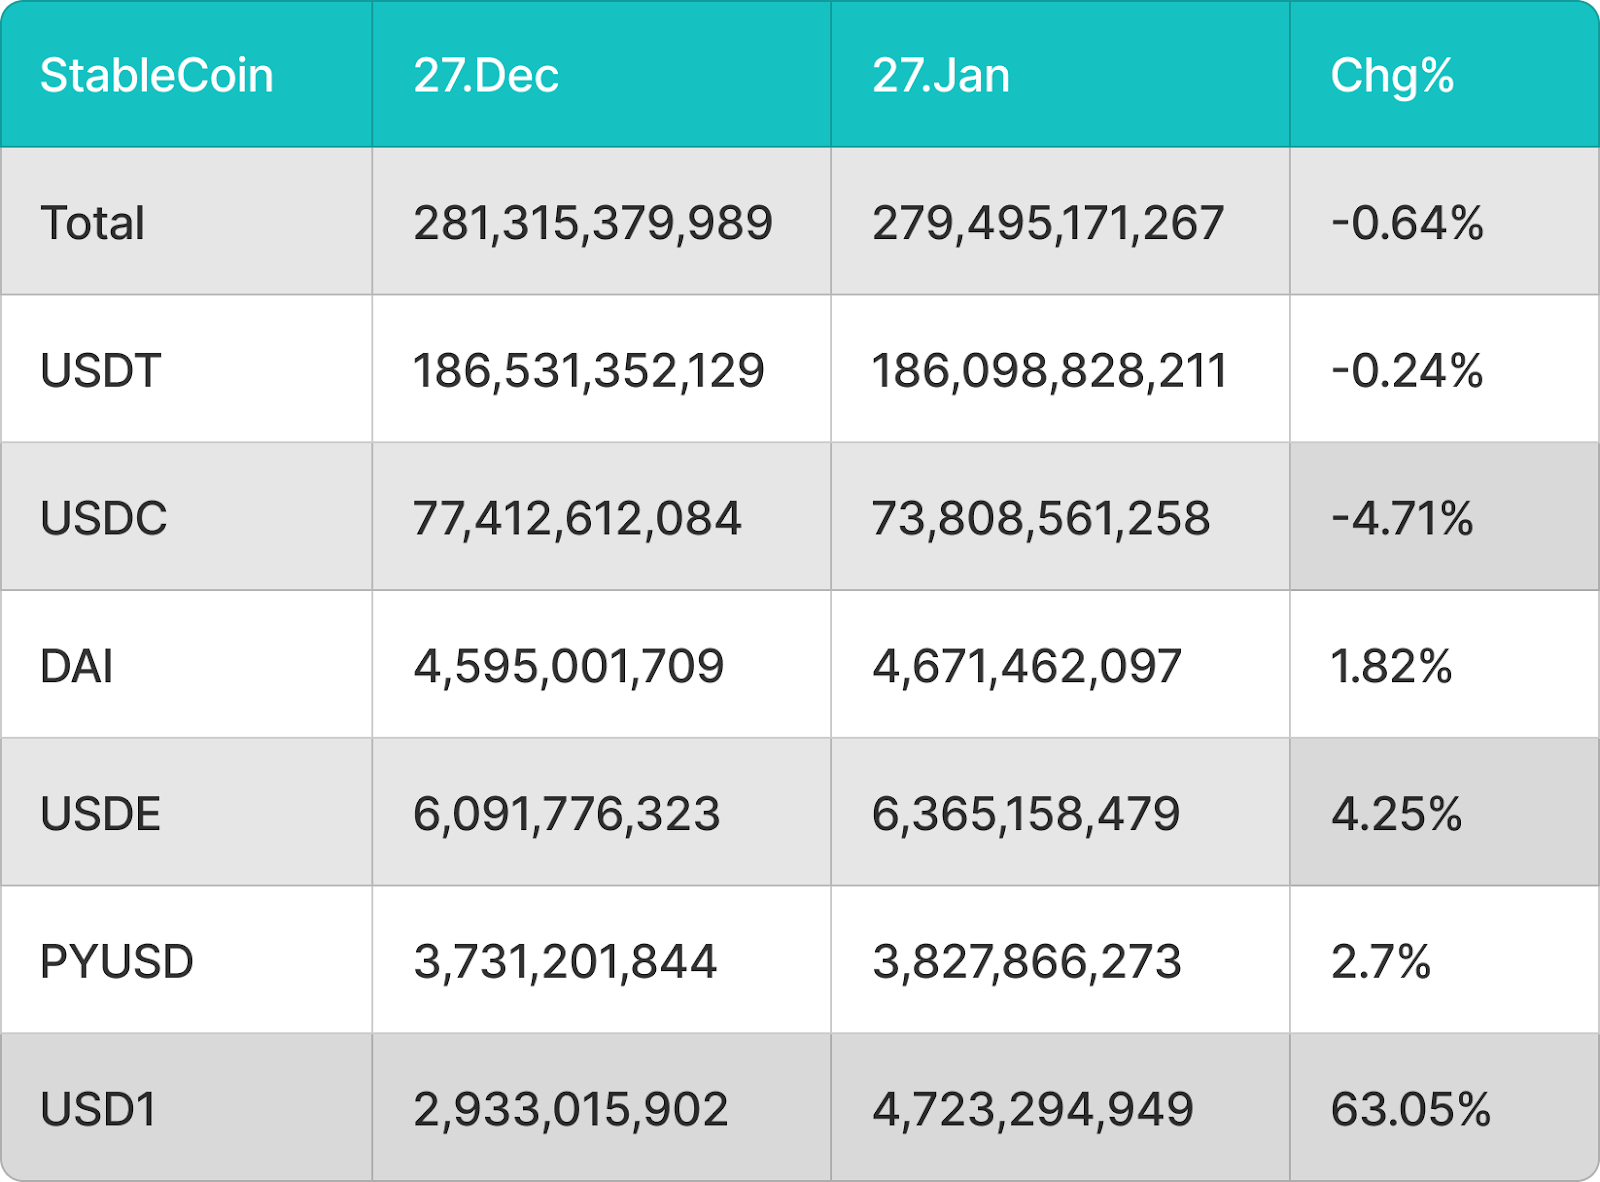
Total Stablecoin Circulating Supply Decreased by $1.82 Billion in January
Influenced by structural adjustments in the overall crypto market, incremental off-chain capital continued to slow, leading to a slight decline in the total stablecoin circulating supply. The total scale decreased from approximately $281.3 billion to $279.5 billion, a month-on-month drop of 0.64%. Among them, USDT remained relatively stable, with only a minor outflow of 0.24%, demonstrating its solid market position as a core settlement and store-of-value tool. USDC recorded a more noticeable outflow, decreasing by about 4.71% for the month, reflecting a migration of some funds from compliant stablecoins to other assets or on-chain scenarios.
Meanwhile, some non-mainstream or emerging stablecoins experienced counter-trend growth. USDE and DAI achieved modest expansions of 4.25% and 1.82% respectively, indicating a recovery in market demand for stablecoins with specific mechanisms. PYUSD continued its moderate growth, increasing by 2.7% month-on-month. Notably, USD1's circulating supply surged by 63.05% in a single month, becoming the fastest-growing stablecoin variety this month. This reflects that market capital, in a context of stock game competition, is undergoing structural migration towards new stablecoin products.
4. Price Analysis of Major Cryptocurrencies
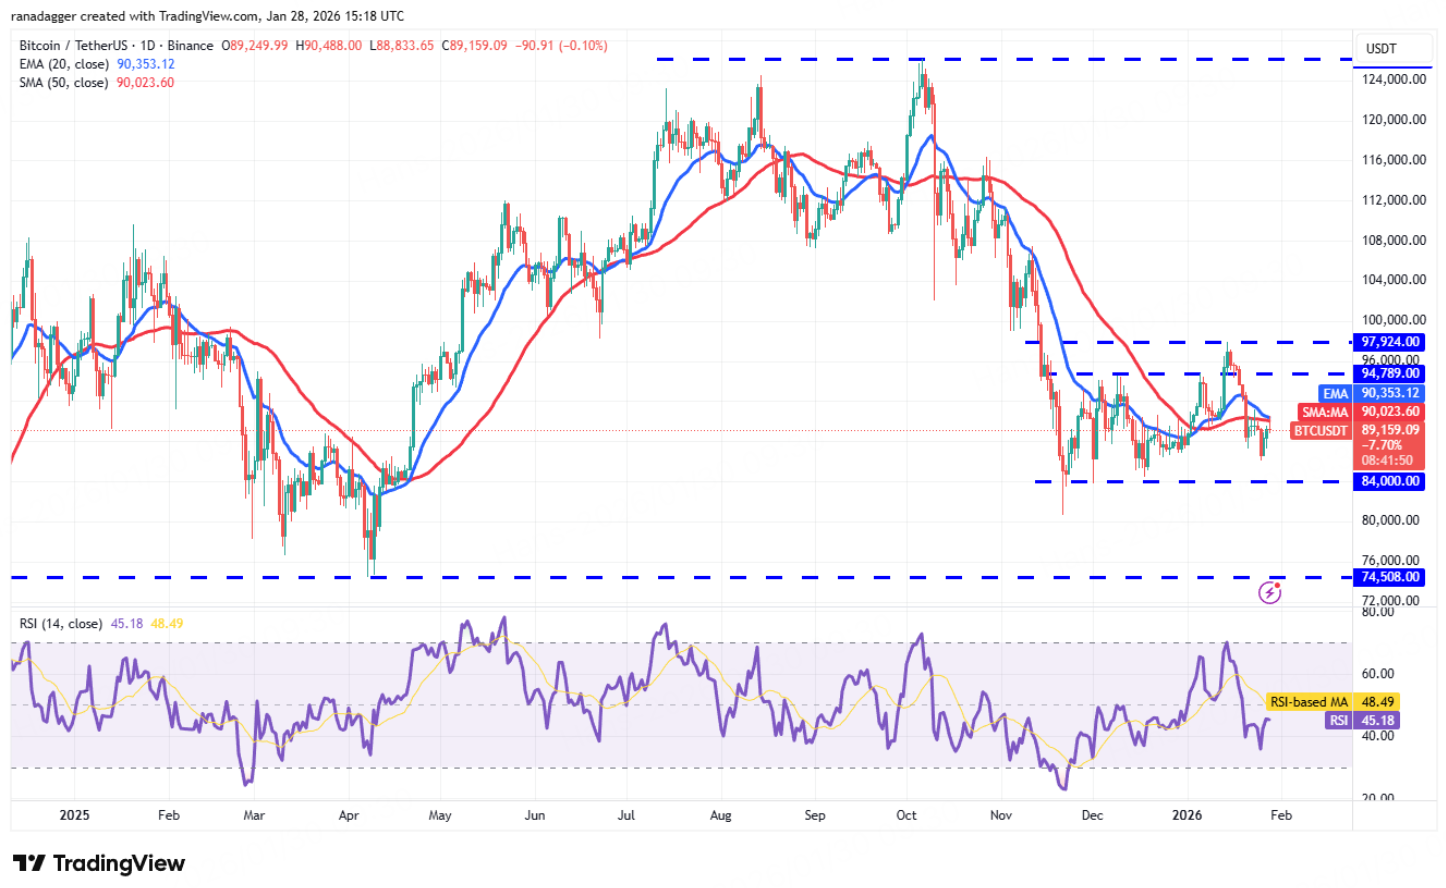
Bitcoin (BTC) Price Analysis
Bitcoin price faced resistance and retreated near the 20-day Exponential Moving Average (EMA, approximately $90,521), effectively breaking below the previous uptrend line, shifting the short-term structure from strong to weak.
From trend and momentum indicators, the 20-day EMA has started to flatten and shows signs of turning downward, with the RSI operating below the zero line, indicating bearish market momentum and that bears are taking the initiative in short-term trading. At this stage, any rebound is more likely to be seen as a technical correction, with prices expected to face sustained selling pressure in the moving average region.
In a bearish scenario, if BTC cannot quickly reclaim the moving average and falls again, the first support level to watch is around $84,000. If this level fails, the price may further test $80,600, potentially leading to a significant weakening of market sentiment. Conversely, if the Bitcoin price can reclaim and hold above the short-to-medium-term moving averages, forming an effective breakout, it would mean bearish momentum is weakening, and the trend could turn bullish again, testing the key resistance area around $97,924.
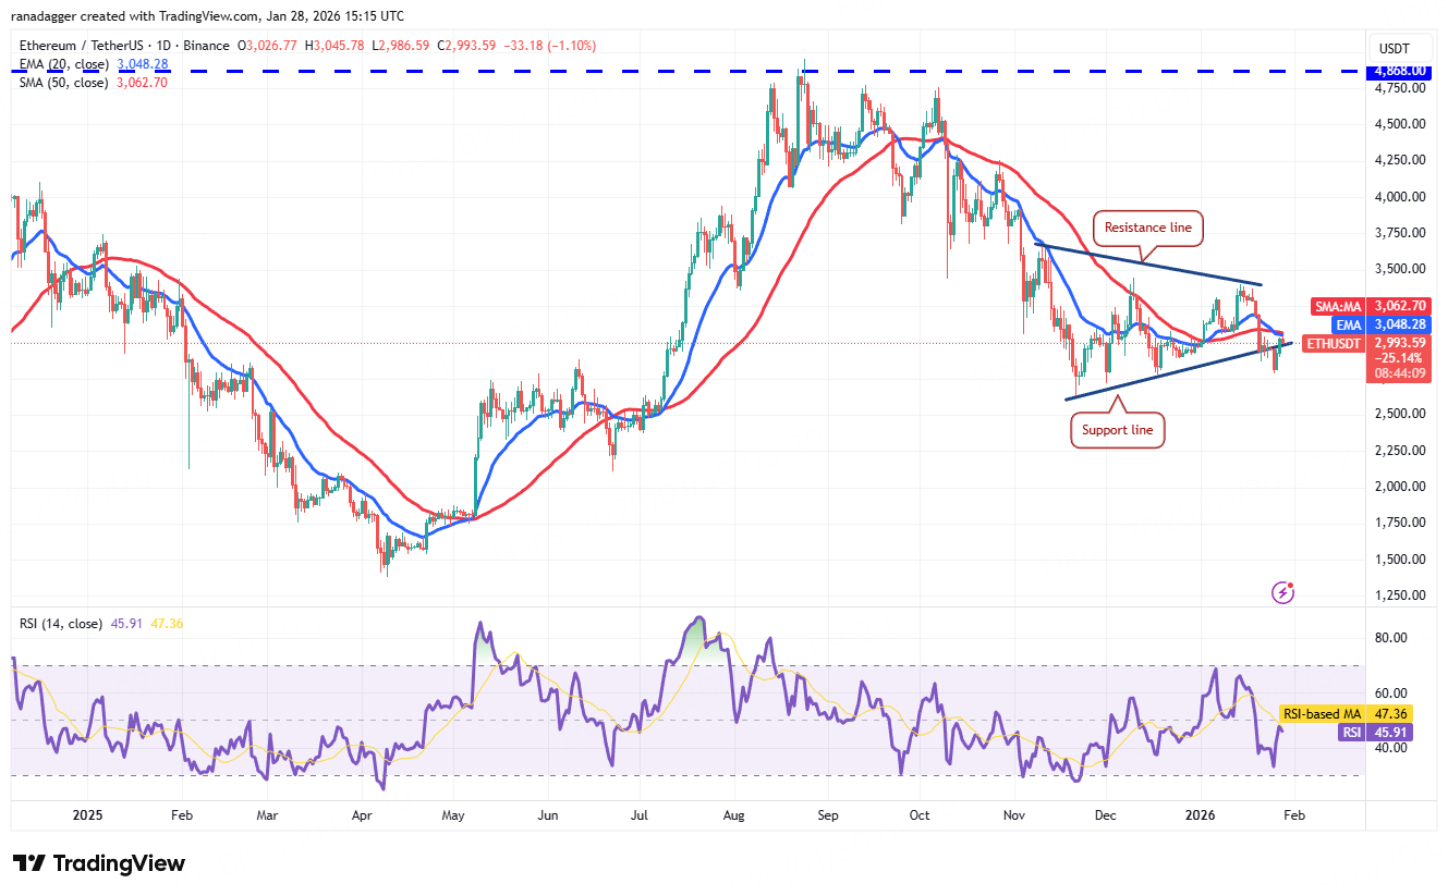
Ethereum (ETH) Price Analysis
Ethereum was previously operating within a symmetrical triangle consolidation pattern, but the price broke below the support line, disrupting the previous balance and indicating a short-term bearish bias.
Technically, a triangle breakdown typically signifies the completion of a directional choice. The current price is trading below the moving averages, indicating limited rebound momentum. Bulls may attempt to push the price back into the triangle in the short term, but significant resistance from bears is expected in the area where moving averages and former support converge.
If ETH weakens again during the rebound, the ETH/USDT downside target will point to the $2,623 level, which will become a key battleground for bulls and bears. On the other hand, if the price can quickly reclaim the moving averages and re-enter the triangle pattern, a "false breakdown" scenario needs to be considered, which could lead to an accelerated rebound and a test of the triangle's upper resistance area.
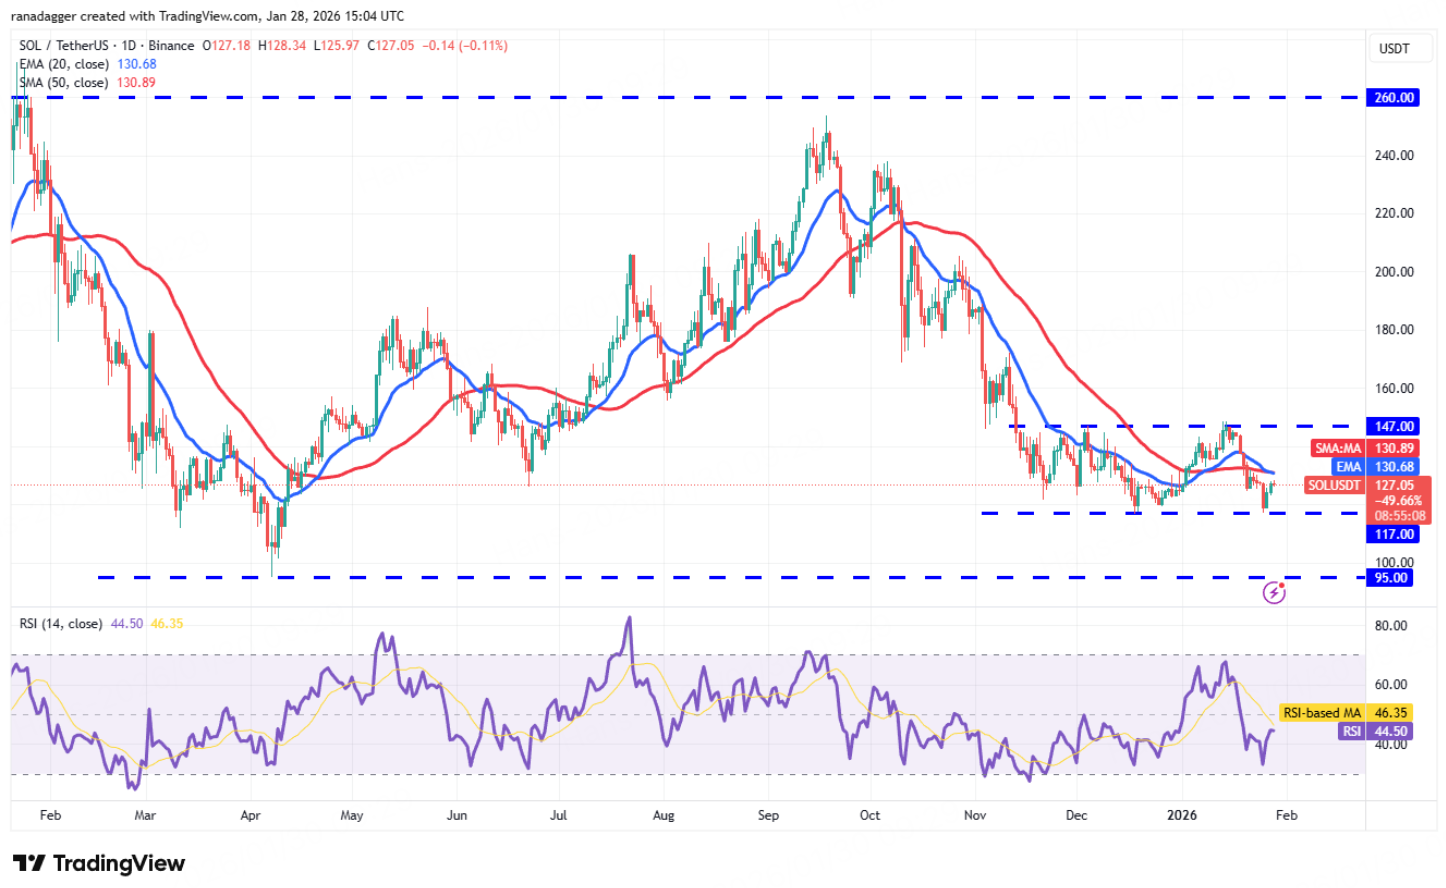
Solana (SOL) Price Analysis
Solana found clear support near $117 and initiated a rebound, indicating the presence of some medium-term buying interest in that area, and the short-term structure is not completely broken.
However, from a trend perspective, SOL is still trading below the major moving averages, and the current rebound is more of a technical correction. The primary resistance above is the 20-day EMA (approximately $131). If the price encounters resistance and falls back in this area, the risk of the downtrend continuing needs to be monitored.
In a bearish scenario, once the $117 support is effectively broken, SOL/USDT could accelerate its decline towards the strong support area around $95, at which point market volatility may significantly increase. If bulls can push the price to break above and hold above the moving averages, it would indicate a significant weakening of downward momentum, and SOL may re-enter a range-bound pattern, with a short-term trading range potentially between $117 and $147.
5. Hot Topics This Month
1. World Liberty Trust Applies to OCC for U.S. National Trust Bank Charter
This month, World Liberty Financial, through its subsidiary World Liberty Trust, submitted a de novo application to the U.S. Office of the Comptroller of the Currency (OCC) to establish a national trust bank for directly conducting USD1 stablecoin issuance, redemption, and digital asset custody business. Currently, USD1's circulating supply exceeds $3.3 billion, and it plans to offer free withdrawal conversion between USD and USD1 upon launch, indicating its attempt to expand stablecoin circulation and usage scenarios with minimal friction. This move signifies that stablecoin issuers are further aligning with banking regulatory frameworks, shifting the product narrative from "crypto asset tool" to "regulated digital dollar channel."
Simultaneously, related entities of World Liberty Financial have reached a cooperation agreement with Pakistan to incorporate USD1 into the regulated digital payment system for cross-border payments and settlements. This arrangement reflects the practical choice of emerging markets, under foreign exchange pressure and geopolitical financing constraints, to prioritize introducing dollar stablecoins to enhance cross-border settlement efficiency and reduce reliance on traditional clearing systems. Overall, if the charter application is approved, USD1 will achieve substantial expansion in compliance framework, institutional access, and cross-border payment scenarios. Whether its risk control and compliance transparency can match the growth in circulation scale will become a key focus for the future.
2. The 2025 Digital Asset Market Clarity Act Intensifies, Senate Advances but Divisions Widen
The "2025 Digital Asset Market Clarity Act" (CLARITY Act, H.R. 3633) achieved key progress in the Senate. The U.S. Senate Agriculture Committee formally advanced the bill's legislative process with a 12–11 party-line vote. Committee Chairman, Republican John Boozman, stated this was an important breakthrough after months of collaboration, "now is the time to move the bill forward." Democratic core negotiator Corey


