Who Pays the "Optimism Tax"? The Micro-Truth of Wealth Transfer in Prediction Markets
- Core Viewpoint: Analysis of transaction data from the prediction market Kalshi reveals that market efficiency does not rely entirely on rational behavior. Instead, there exists a systematic wealth transfer mechanism driven by behavioral biases. Irrational "takers" tend to overpay for low-probability affirmative outcomes (YES contracts), while rational "makers" capture this portion of the "optimism tax" by providing liquidity.
- Key Elements:
- Data confirms the existence of a "high-risk betting bias": Contracts trading at 5 cents have an actual win rate of only 4.18%, significantly lower than their implied probability of 5%, while contracts at 95 cents have a win rate as high as 95.83%.
- Wealth transfers from "takers" to "makers": Across 80 price levels, "takers" exhibit negative excess returns, while "makers" show positive returns at the same levels. This effect is most pronounced in high-engagement categories like sports and entertainment.
- Existence of "YES/NO asymmetry": At the same price point (e.g., 1 cent), the historical expected return for buying a "YES" contract is -41%, while for a "NO" contract it is +23%, a difference of 64 percentage points.
- Market maturity is key: In the platform's early days, "takers" profited. However, after the trading volume surge in 2024, professional market makers entered, leading to a reversal in the direction of wealth transfer, highlighting the importance of liquidity professionalism.
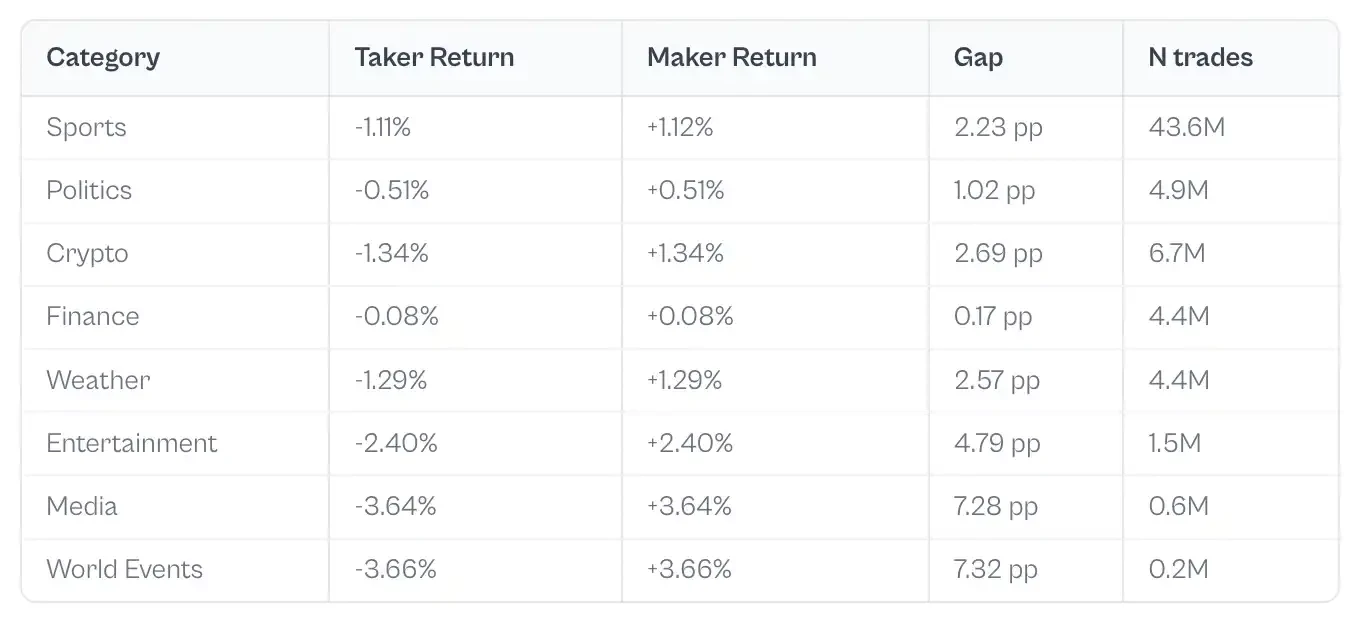
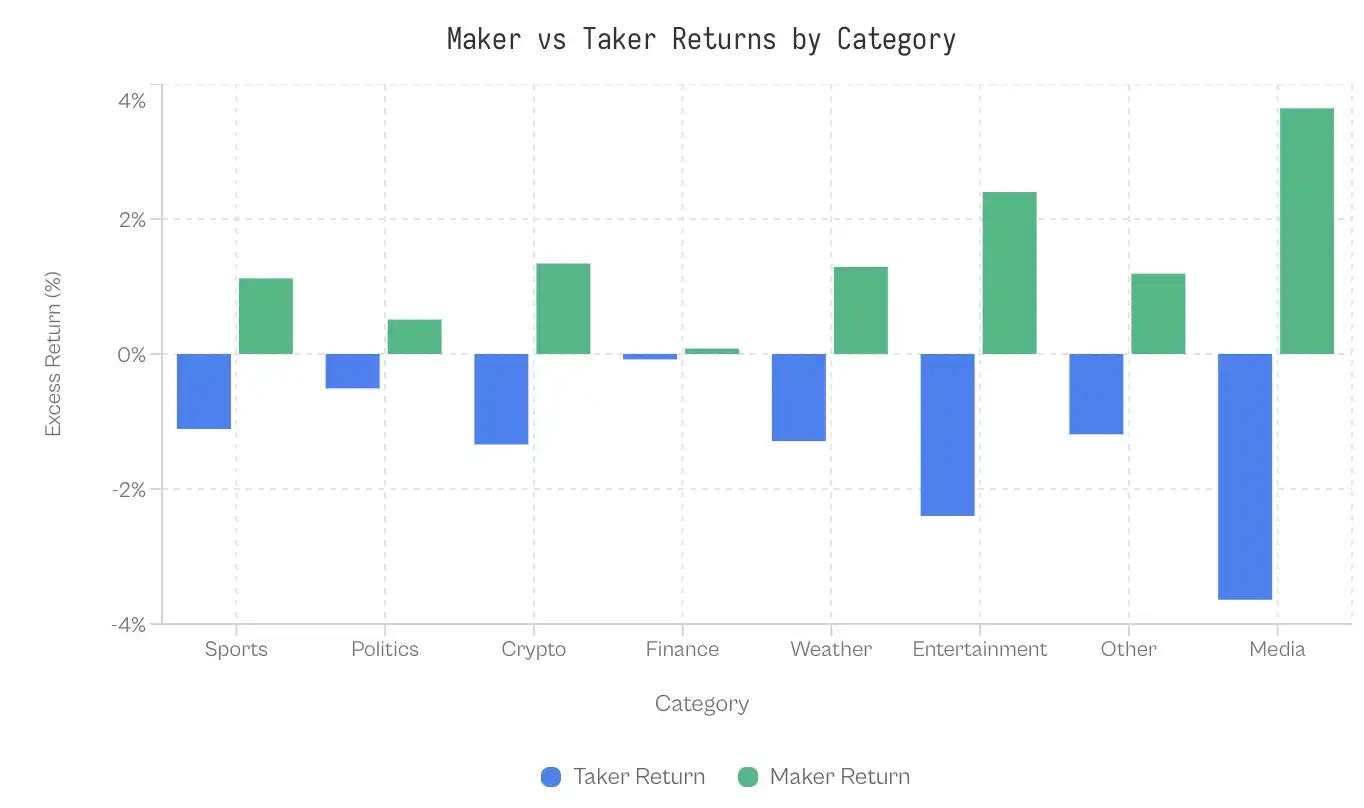
- Significant efficiency differences across market categories: Financial markets are close to efficient (gap of only 0.17 percentage points), while categories like entertainment and world events have the lowest efficiency (gap exceeding 7 percentage points), indicating that participant composition and emotional investment profoundly affect market efficiency.
Original Title: The Microstructure of Wealth Transfer in Prediction Markets
Original Author: Jonathan Becker
Original Compilation: SpecialistXBT, BlockBeats
Editor's Note: The author provides a detailed analysis of how the irrational preference of retail traders between "longshot outcomes" and "affirmative outcomes" contributes to the creation of an "optimism tax." This is not only a hardcore analysis of market microstructure but also a must-read guide for every prediction market participant to avoid pitfalls.
The following is the original content:
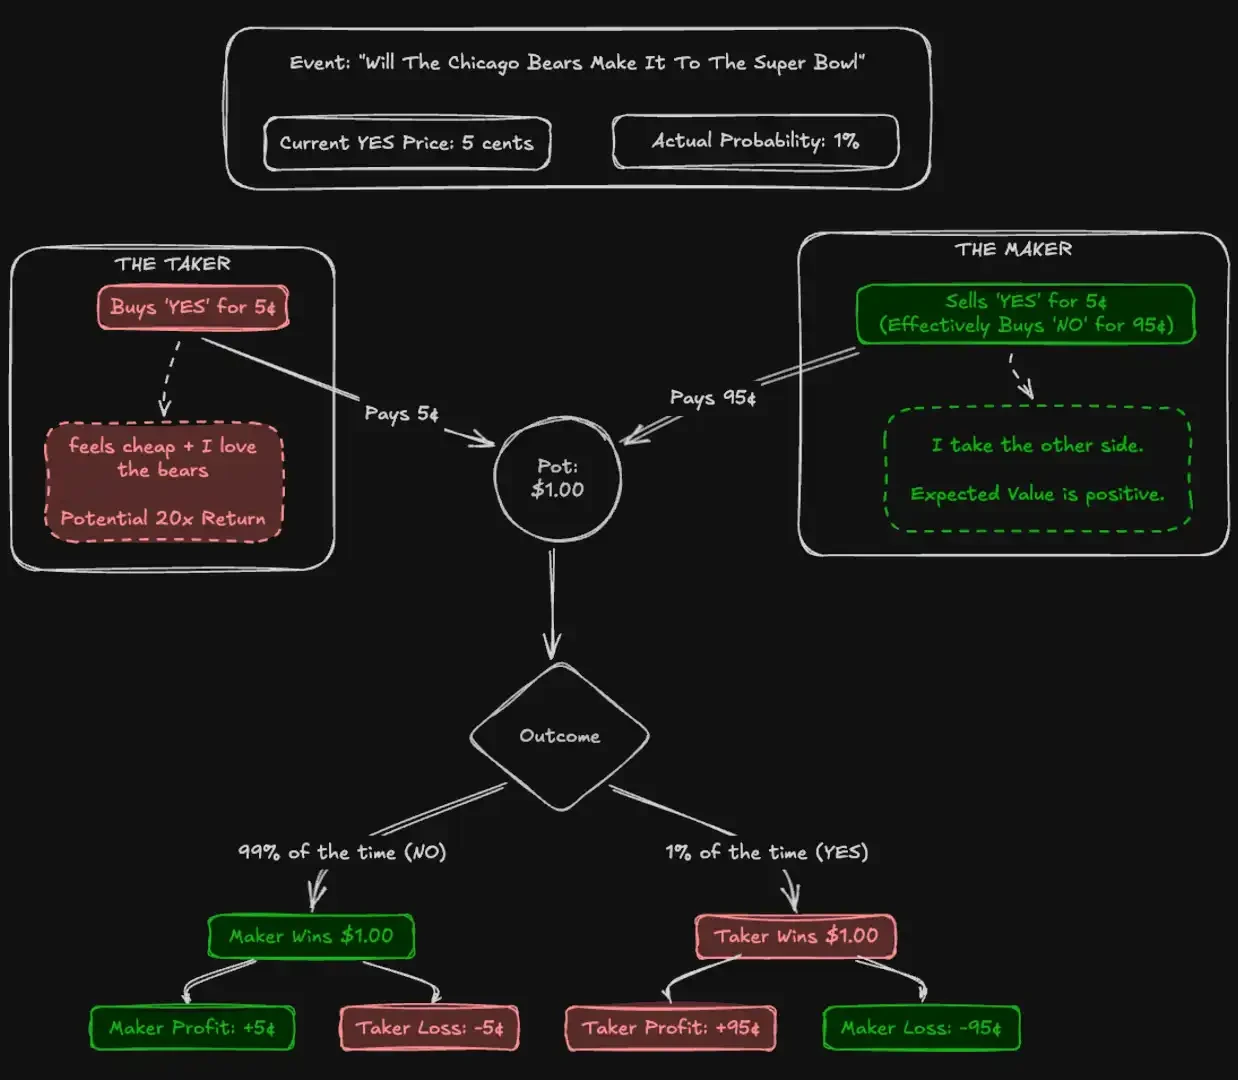
Slot machines on the Las Vegas Strip return about 93 cents for every dollar wagered. This is widely considered one of the worst odds in gambling. However, on Kalshi, a CFTC-regulated prediction market, traders have wagered massive sums on "longshot" contracts with historical returns as low as 43 cents per dollar. Thousands of participants voluntarily accept a far lower expected value than casino slots, simply to bet on their beliefs.
The Efficient Market Hypothesis posits that asset prices perfectly aggregate all available information. In theory, prediction markets offer the purest test of this theory. Unlike stocks, the intrinsic value of a prediction market contract is unambiguous: a contract either pays $1 or it doesn't. A price of 5 cents should precisely imply a 5% probability.
To test this efficiency, we analyzed 72.1 million trades covering $18.26 billion in trading volume. Our findings suggest that the wisdom of crowds relies less on rational actors and more on a mechanism of "harvesting errors." We document a systematic wealth transfer: impulsive "Takers" pay a structural premium for affirmative "YES" outcomes, while "Makers" capture an "Optimism Tax" simply by selling contracts into this biased order flow. This effect is strongest in high-engagement categories like sports and entertainment, while markets approach perfect efficiency in low-engagement categories like finance.
Contributions of This Paper
This paper makes three contributions.
First, it confirms the existence of a "longshot bias" on Kalshi and quantifies its magnitude across price levels.
Second, it decomposes returns by market role, revealing a persistent wealth transfer from Takers to Makers driven by asymmetric order flow.
Third, it identifies a "YES/NO asymmetry," where Takers disproportionately prefer affirmative bets on longshots (low-probability prices), exacerbating their losses.
Prediction Markets and Kalshi
Prediction markets are exchanges where participants trade binary contracts on real-world outcomes. These contracts settle at $1 or $0, with prices ranging from 1 to 99 cents serving as a proxy for probability. Unlike equity markets, prediction markets are strictly zero-sum: every dollar of profit corresponds exactly to a dollar of loss.
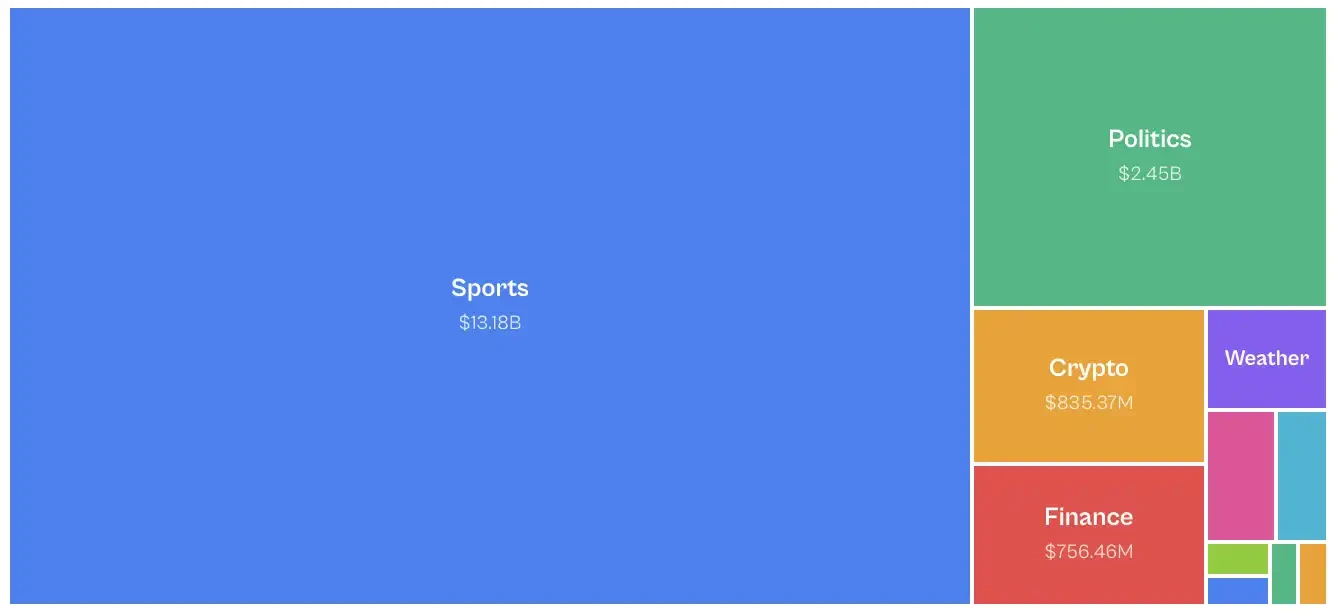
Launched in 2021, Kalshi is the first CFTC-regulated prediction market in the United States. The platform initially focused on economic and weather data, remaining niche until 2024. After a legal victory against the CFTC to list political contracts, the 2024 election cycle triggered explosive growth. Sports markets introduced in 2025 now dominate trading activity. Trading volume distribution across categories is highly uneven: Sports account for 72% of nominal volume, followed by Politics (13%) and Crypto (5%).
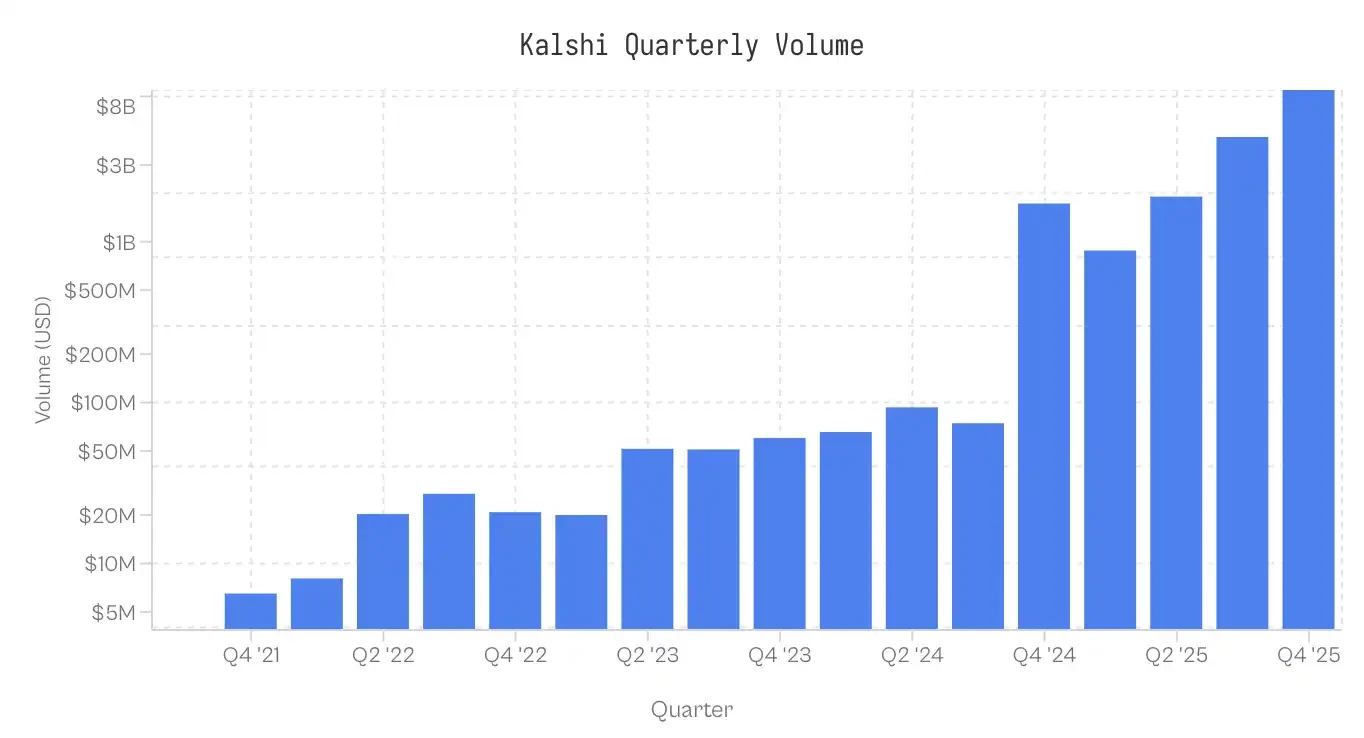
Note: Data collection ended at 17:00 ET on November 25, 2025; Q4 2025 data is incomplete.
Data and Methodology
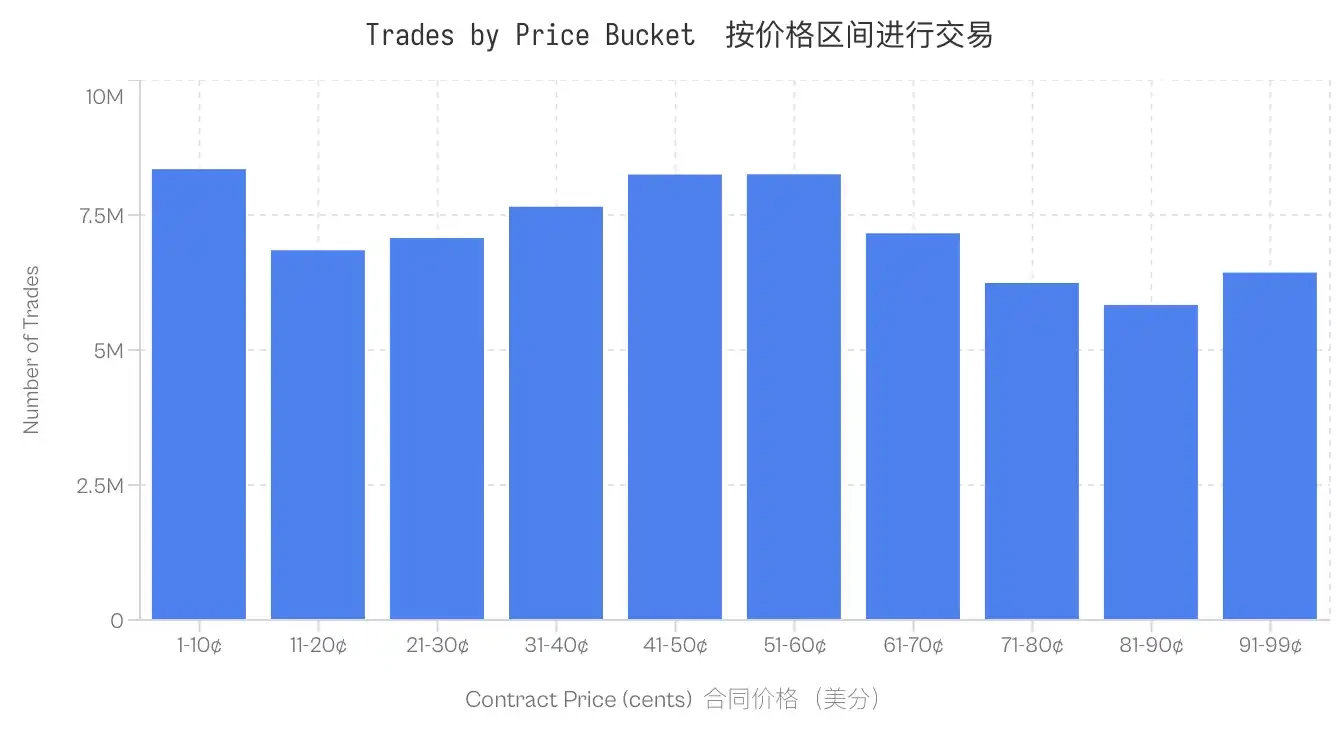
The dataset contains 7.68 million markets and 72.1 million trades. Each trade records the execution price (1-99 cents), the taker side (yes/no), contract quantity, and timestamp.
Role Assignment: Each trade identifies the liquidity consumer (Taker). The Maker takes the opposite side. If taker_side = yes and the price is 10 cents, it means the Taker buys YES at 10 cents; the Maker buys NO at 90 cents.
Cost Basis (Cb): To compare asymmetry between YES and NO contracts, we normalize all trades by risk capital. For a standard YES trade at 5 cents, Cb=5. For a NO trade at 5 cents, Cb=5. Unless otherwise specified, "price" mentioned in this article refers to this cost basis.
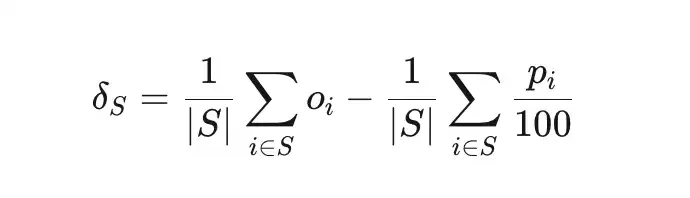
Mispricing (δS) measures the deviation between the actual win rate of a set of trades S and the implied probability.
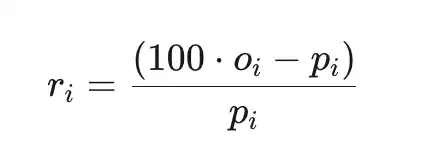
Total Excess Return (ri) is the return relative to cost (before platform fees), where pi is the price in cents, and oi∈{0,1} is the outcome.
Sample
Calculations are based only on settled markets. Markets that were voided, delisted, or remain open are excluded. Additionally, trades from markets with nominal volume below $100 are excluded. The dataset is robust across all price levels; even the least traded bucket (81-90 cents) contains 5.8 million trades.
Longshot Bias on Kalshi
Longshot Bias was first documented in horse racing by Griffith (1949) and formalized by Thaler & Ziemba (1988) in their analysis of pari-mutuel betting markets. It describes the tendency for bettors to overpay for low-probability outcomes. In an efficient market, a contract priced at p cents should have approximately a p% chance of winning. In a market with Longshot Bias, low-priced contracts win less often than their implied probability, while high-priced contracts win more often.
Data from Kalshi confirms this pattern. Contracts traded at 5 cents have only a 4.18% win rate, implying a -16.36% mispricing. Conversely, contracts at 95 cents have a 95.83% win rate. This pattern is consistent: all contracts priced below 20 cents underperform their odds, while those above 80 cents outperform.
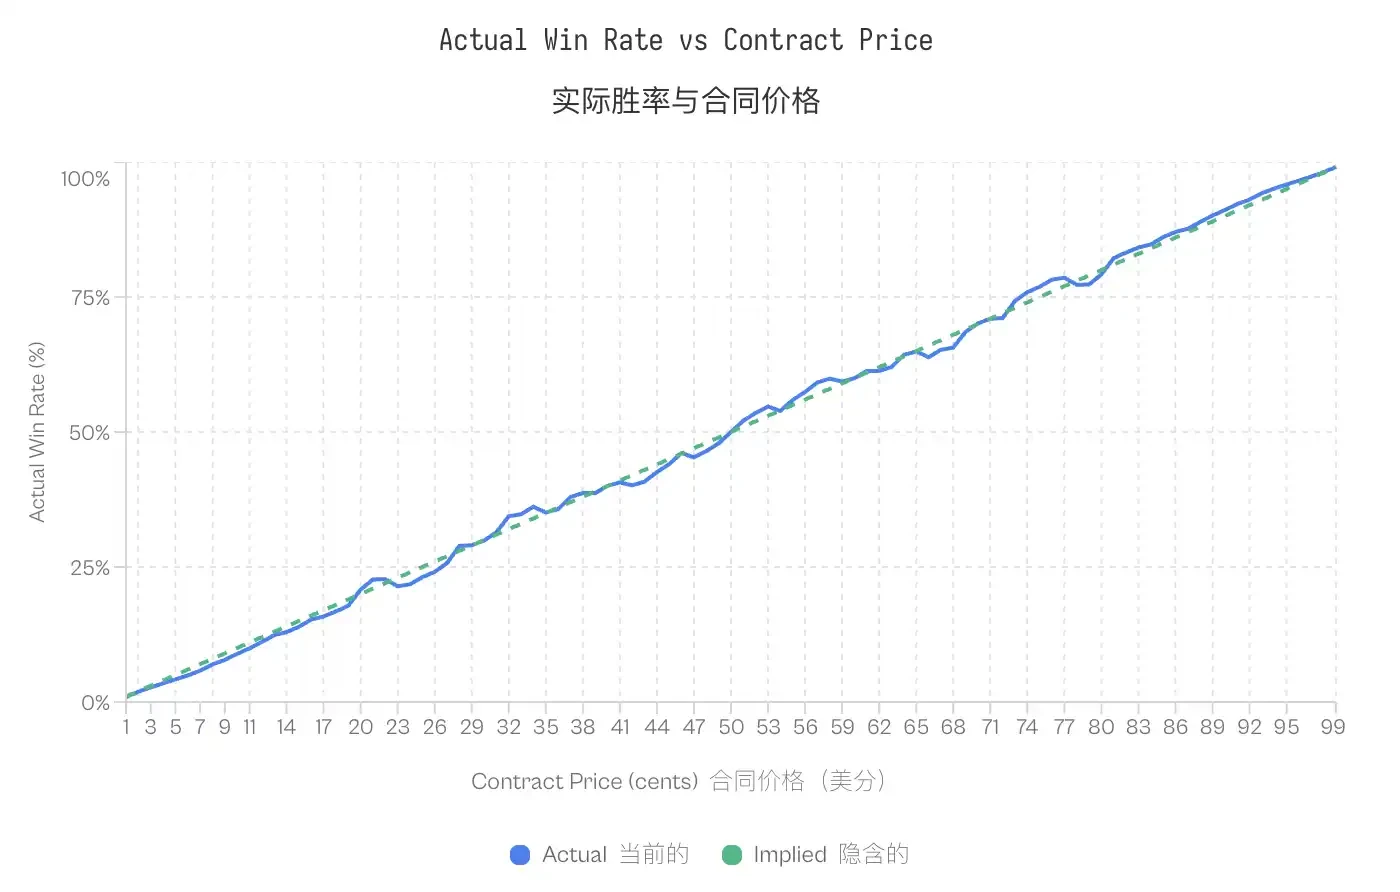 Note: Despite this bias, the calibration curve shows prediction markets are actually quite efficient and accurate, except for slight deviations in the tails (extremely low or high prices). The tight alignment between implied and actual probabilities confirms that prediction markets are well-calibrated price discovery mechanisms.
The existence of Longshot Bias raises a question unique to zero-sum markets: if some traders systematically overpay, who captures the surplus value?
Wealth Transfer from Makers to Takers
Decomposing Returns by Role Market microstructure defines two groups based on how participants interact with the order book. Makers provide liquidity by placing limit orders that rest on the book. Takers consume liquidity by executing against existing orders. Decomposing total returns by role reveals a stark asymmetry:
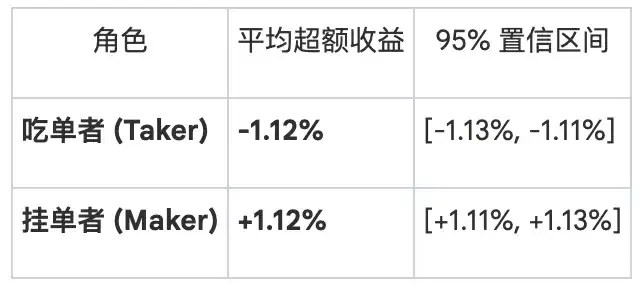
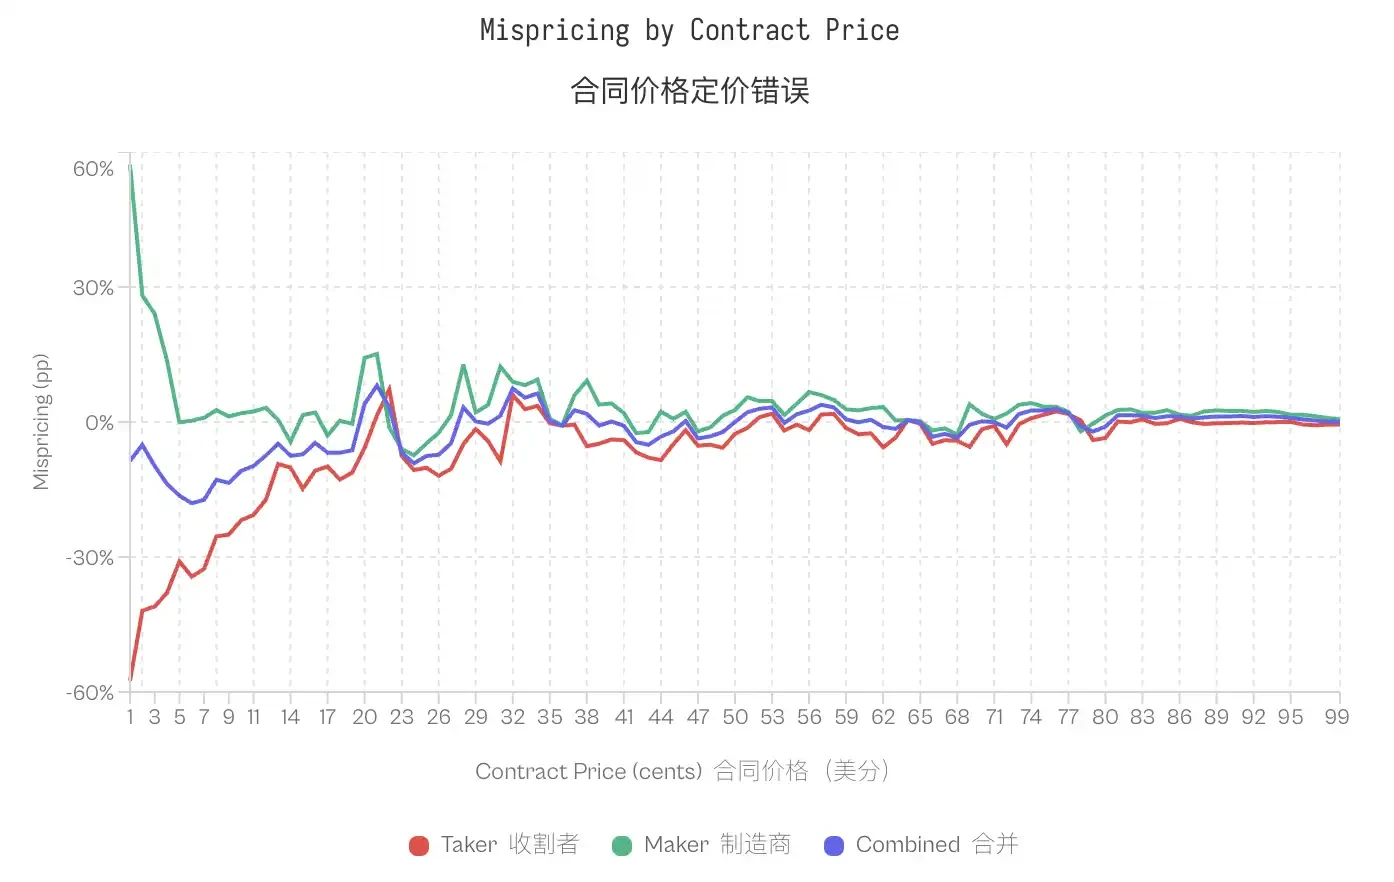
This divergence is most pronounced in the tails. For 1-cent contracts, Takers have a win rate of only 0.43% (implied probability 1%), corresponding to a -57% mispricing. Makers on the same contract have a 1.57% win rate, with a +57% mispricing. At 50 cents, mispricing compresses; Takers show -2.65%, Makers show +2.66%. In 80 out of 99 price levels, Takers exhibit negative excess returns, while Makers exhibit positive returns in the same 80 levels.
The market's overall mispricing is concentrated in specific populations: Takers bear the losses, Makers capture the gains.
Is This Just Spread Compensation?
A plausible objection is: Makers earn the bid-ask spread as compensation for providing liquidity. Their positive returns might simply reflect spread capture, not exploiting biased order flow.
While plausible, two observations suggest otherwise. First, Maker returns depend on the direction they take. If profits were purely spread-based, it shouldn't matter whether a Maker buys YES or NO.
We test this by decomposing Maker performance by position direction:
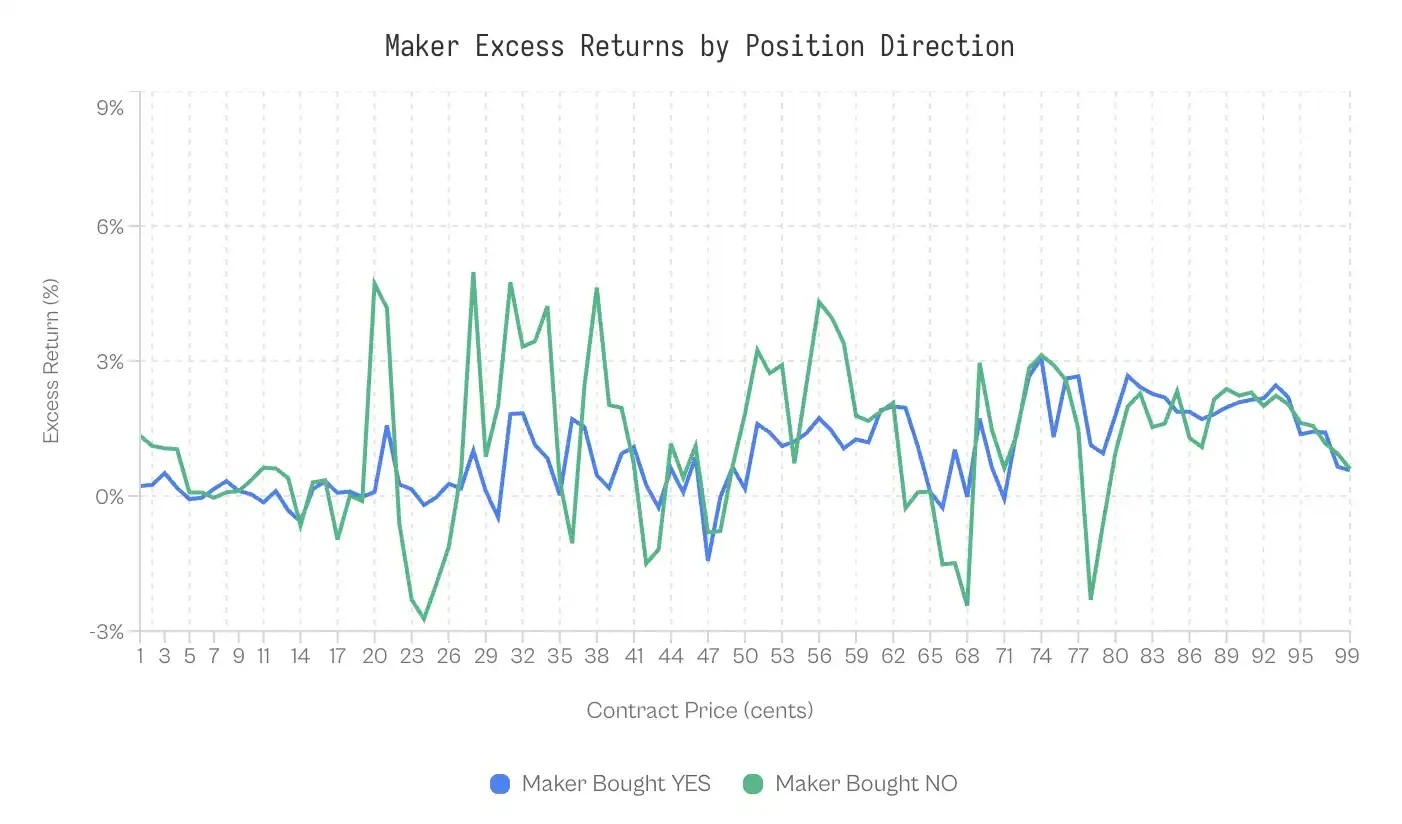
Makers buying NO outperform those buying YES 59% of the time.
Weighted excess return for Makers buying YES is +0.77%, while for those buying NO it's +1.25%. The difference is 0.47 percentage points. This effect, though minuscule (Cohen's d = 0.02-0.03), is stable.
At minimum, this indicates spread capture is not the full story.
Variation Across Market Categories
If uninformed, irrational demand drives the bias, categories attracting less sophisticated participants should show larger gaps. The data is striking: Finance shows only a 0.17 percentage point gap; the market is remarkably efficient.
At the other end, World Events and Media show gaps exceeding 7 percentage points. Sports, the largest category by volume, exhibits a modest 2.23 percentage point gap. Given $6.1 billion in Taker volume, even this modest gap generates massive wealth transfer.
Why is Finance so efficient? A likely explanation is participant screening; financial questions attract traders who think in probabilities and expected value, not fans betting on their home team. The questions themselves are dry (e.g., "Will the S&P close above 6000?"), filtering out emotional bettors.
Evolution of Takers and Makers
The Maker-Taker gap is not an inherent feature of the market; it emerged as the platform grew. In Kalshi's early days, the pattern was reversed: Takers earned positive excess returns, while Makers lost.
From launch through 2023, Taker returns averaged +2.0%, while Makers were at -2.0%. With no sophisticated counterparty, Takers won; amateur Makers defined the early phase and became the losers.
This reversed in Q2 2024, with the gap widening sharply after the 2024 election.
The inflection point coincided with two events: Kalshi's legal victory against the CFTC in October 2024 to list political contracts, and the subsequent 2024 election cycle. Volume surged from $30 million in Q3 2024 to $820 million in Q4. The new liquidity attracted sophisticated market makers, and with them came value extraction from Taker flow.
Pre-election, the average gap was -2.9 pp (Takers win); post-election, it flipped to +2.5 pp (Makers win).
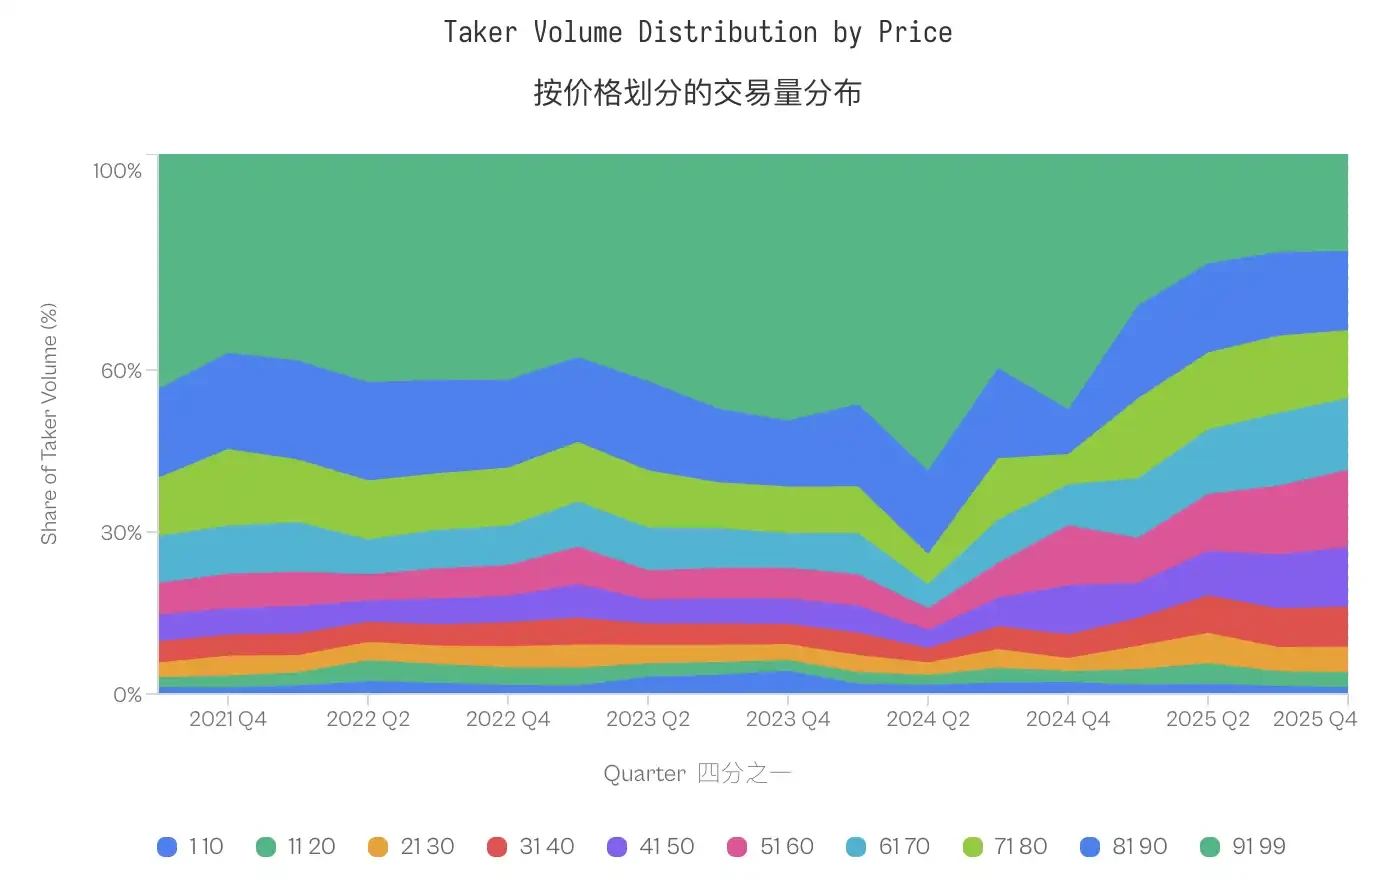
The share of volume in low-probability contracts (1-20 cents) remained largely unchanged, 4.8% pre-election vs. 4.6% post-election. But the distribution actually shifted towards mid-range prices; the share of the 91-99 cent bucket dropped from 40-50% in 2021-2023 to under 20% in 2025, while mid-range prices (31-70 cents) grew substantially.
Taker behavior did not become more extreme (the share of low-probability contracts even slightly declined), but their losses increased.
This evolution reshaped aggregate outcomes. The transfer of wealth from traders to market makers is not an inherent feature of prediction market microstructure; it requires sophisticated market makers, who in turn require sufficient volume to justify their participation.
In the low-volume early phase, market makers were likely inexperienced individuals who lost to relatively informed traders.
The surge in volume attracted professional liquidity providers capable of extracting value from trader flow across all price points.
YES/NO Asymmetry
The Maker-Taker decomposition identifies who absorbs the losses but leaves the question of how. Why is Taker flow consistently mispriced? The answer lies not in Makers having superior predictive power, but in Takers exhibiting an expensive preference for affirmative outcomes.
Asymmetry at Equal Prices
Standard efficiency models suggest that pricing errors for different contract types should be symmetric at equal prices. In theory, a 1-cent "YES" contract and a 1-cent "NO" contract should reflect similar expected returns.
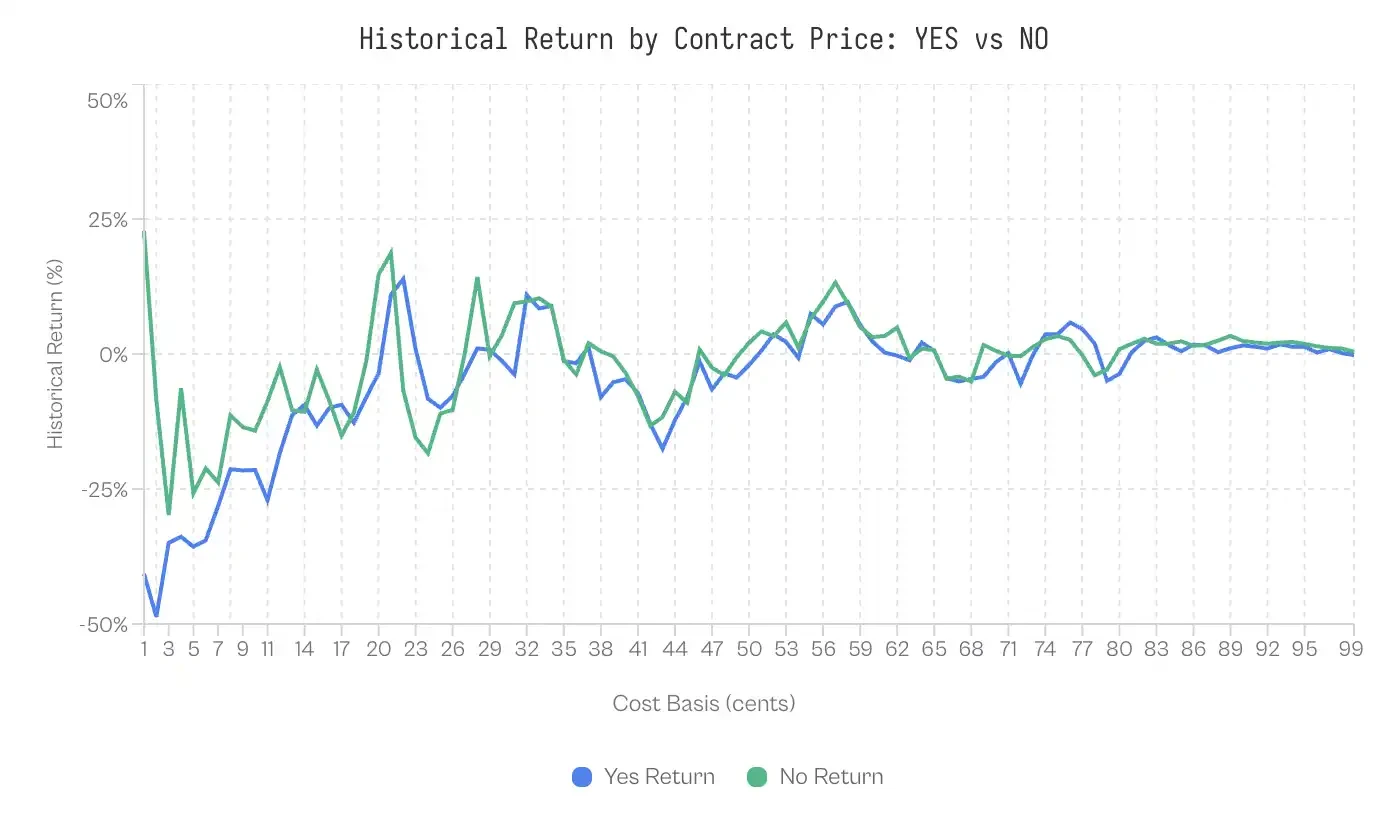
Yet data refutes this. At a 1-cent price, the historical expected return for "YES" is -41%; YES buyers expect to lose nearly half their capital. Conversely, a "NO" contract also priced at 1 cent has a historical expected return of +23%. The difference between these two seemingly identical probability estimates is a staggering 64 percentage points.
The NO contract advantage persists. NO contracts outperform YES contracts at 69 out of 99 price levels, with the advantage concentrated at market extremes. NO contracts yield higher returns at every price increment from 1 to 10 cents and from 91 to 99 cents.
Despite the market being zero-sum, dollar-weighted returns for "YES" buyers are -1.02%, while for "NO" buyers they are +0.83%, a difference of 1.85 percentage points due to "YES" overpricing.
Taker Preference for Affirmative Bets
The underperformance of YES contracts may be linked to trader behavior. Analysis of trade data reveals a structural imbalance in order flow composition.
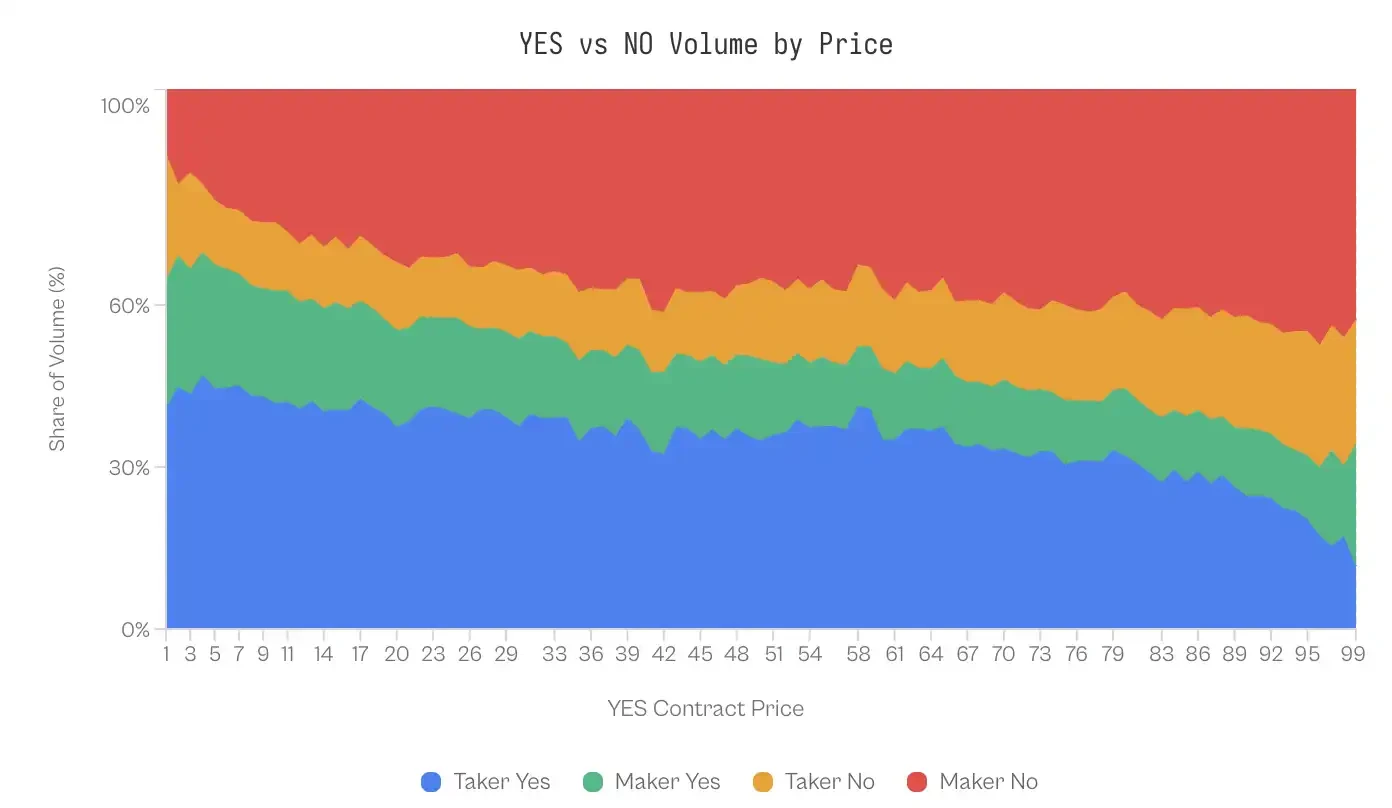
In the 1-10 cent range (where YES represents a longshot), Takers account for 41-47% of YES volume; Makers only 20-24%. This imbalance reverses at the other end of the probability curve. When a contract trades at 99 cents (meaning NO is the 1-cent longshot), Makers actively buy NO contracts (43% of volume), while Takers account for only 23%.
One might hypothesize that market makers exploit this asymmetry with superior directional forecasting—that is, they know when to buy NO. But evidence does not support this.
When decomposing market maker performance by position direction, returns are nearly identical. Statistically significant differences emerge only in the extreme tails (1-10 cents and 91-99 cents), and even there, effect sizes are minuscule (Cohen's d = 0.02-0.03).
This symmetry is significant: market makers profit not by predicting direction, but through a mechanism that works equally well on both sides.
Discussion
Analysis of 72.1 million trades on Kalshi reveals a distinct market microstructure: systematic wealth transfer from liquidity takers to liquidity makers. This phenomenon is driven by specific behavioral biases, moderated by market maturity, and concentrated in categories that elicit high emotional engagement.
Profit Extraction Mechanism for Winners
In a zero-sum market, do winners profit through superior information (prediction) or superior structure (market making)?
Data strongly supports the latter.
When decomposing market maker returns by position direction, performance gaps are minuscule: market makers buying "YES" earn +0.77% excess return, while those buying "NO" earn +1.25% (Cohen's d ≈ 0.02).
This statistical symmetry suggests market makers do not possess significant ability to predict winners. Instead, they profit through structural arbitrage: providing liquidity to a population of "Takers" who prefer high-risk, high-reward outcomes.
This extraction mechanism relies on an "Optimism Tax."
Despite low-probability "YES" underperforming low-probability "NO" by 64 percentage points, traders still disproportionately buy "YES" contracts at low-probability prices, accounting for nearly half the total volume in that price range.
Thus, market makers need not predict the future; they simply need to act as counterparties to optimism. This aligns with findings by Reichenbach and Walther (2025