
Key indicators are pointing downwards, Bitcoin's price action is cautious.
- 核心观点:比特币短期看涨动能减弱,市场陷入僵局。
- 关键要素:
- 资金费率增长势头明显放缓。
- ETF资金流入几乎为零,缺乏新增需求。
- 订单簿显示上方卖压显著,下方有支撑。
- 市场影响:短期价格或偏向震荡下行,等待新催化剂。
- 时效性标注:短期影响。
Financing rates are losing their upward momentum
Over the past week, Bitcoin's short-term trend has shifted from positive to clearly weak, a change best reflected in funding rates. At first glance, funding rates remain slightly positive—0.1008% for 7 days, 0.0144% for 1 day, and currently reading at 0.0048%. This typically suggests that long positions still dominate. However, trends are more important than static snapshots. Each timeframe shows a clear slowdown, indicating that bullish sentiment is weakening rather than strengthening.
This shift in momentum does not necessarily signal a bear market; rather, it indicates a weakening of bullish forces while bearish activity has not increased accordingly. To understand whether this decline in enthusiasm is structural or temporary, a second key indicator must be considered: open interest.
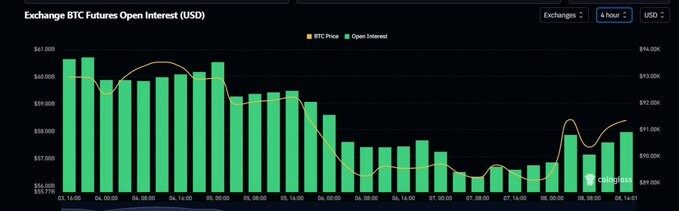
Open interest indicates a lack of market direction.
Open interest (OI) directly reflects how much capital remains active in the market, whether long or short positions. Recent charts show that open interest has been declining as both long and short positions have been gradually closed out. After the recent decline, positions were only slightly replenished, far from signaling a new directional bet.
This pattern resembles a market that lacks both the confidence to chase rising prices and the uncertainty to accept the risk of further declines. When the actions of both sides are indistinguishable, it is almost impossible to discern who is dominating the market.
This hesitation reflects open-ended investing: the market is waiting for a catalyst, unwilling to make commitments, and currently choosing to reduce risk rather than take it.
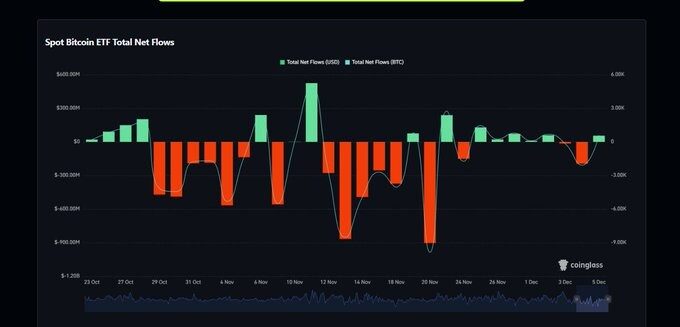
ETF fund flows failed to provide support.
If there's one indicator that can change short-term trends, it's ETF fund flows. These products have consistently influenced Bitcoin's medium-term trend, and daily net inflows and outflows are often sensitive short-term signals.
However, data from the past week shows that ETF fund flows are almost zero. Although technically fund inflows are still positive, the scale is too small to provide any real support. In reality, ETFs are not involved in the price formation process.
In periods of market uncertainty, the lack of new demand is particularly important. When funds decrease, open interest stagnates, and ETFs exit the market, price movements will be primarily driven by the order book rather than new funds. This shift explains why intraday price fluctuations are increasingly resembling liquidity-driven volatility rather than trend-driven upward movements.
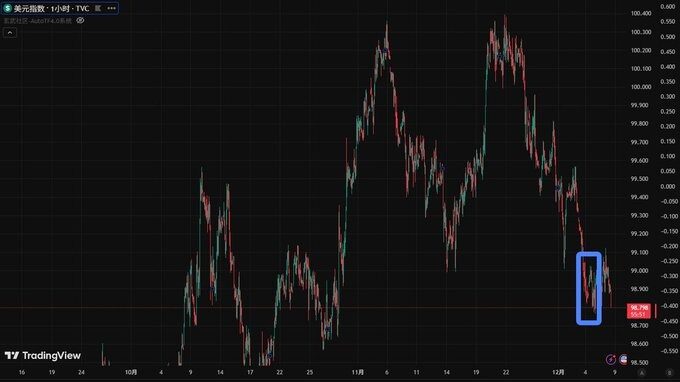
DXY provides support, but not enough.
The recent movement of the US Dollar Index (DXY) has generally been favorable for Bitcoin. Bitcoin tends to benefit from this inverse relationship when the dollar weakens or consolidates at low levels. In fact, this was partly the reason for Bitcoin's strength earlier this week.
However, even a stronger dollar couldn't offset the underlying weakness in cryptocurrency-related indicators. After December 5th, the US Dollar Index (DXY) entered a period of consolidation, diminishing the clarity of contrarian signals. Meanwhile, the deterioration in money supply, positioning, and ETF flows had a far greater impact on market sentiment than any minor positive effects from the macroeconomic environment.
Therefore, while the US dollar index explains why Bitcoin did not fall sharply, it cannot alone reverse this structure that is increasingly inclined towards short-term mild weakness.
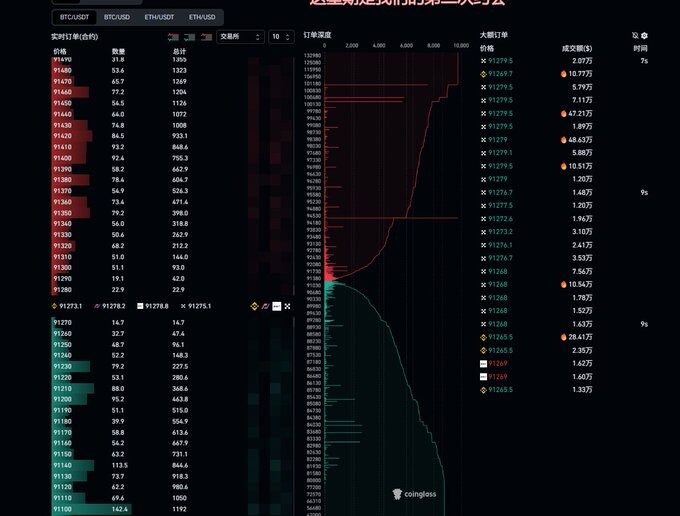
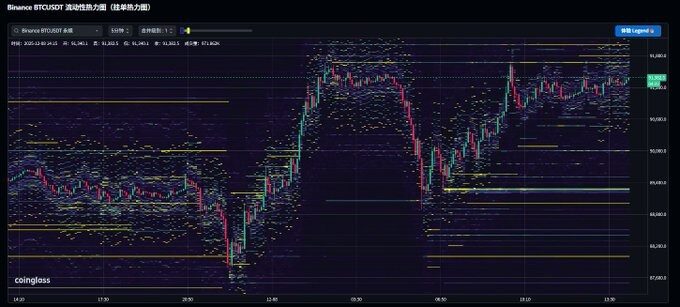
Order book liquidity indicates excessive selling pressure.
The next key piece of information comes from the order book dynamics. Real-time liquidity shows relatively weak buying depth; there is currently no clear cluster of strong buying orders providing effective support at the price level. Meanwhile, selling pressure is more pronounced.
This imbalance is even more pronounced in the heatmap data. The dense sell-side liquidity zones at 91,800 and 92,200 form a significant upper barrier. In contrast, the area with the highest concentration of buying interest is noticeably lower—around 89,400, where a large liquidity barrier appears.
This pattern forms a clear trading channel: resistance above and support below. Without new capital inflows, the market has little incentive to break through these boundaries. With bullish funds dwindling and ETFs not participating, the likelihood of an upward breakout is reduced. Conversely, strong liquidity around 89400 points increases the possibility of demand absorption, and a short-term rebound is possible if prices fall.
Short-term structure: Bulls are weak, bears are on the defensive.
Taking all signals—funding, open interest, ETF fund flows, US dollar index, order book depth, and heatmap position—Bitcoin's current price structure can be summarized as follows:
"Upside pressure is limited, while downside support is present, but the short-term outlook remains bearish."
This is not a crash, nor does it resemble the start of a sharp trend reversal. Instead, it reflects the market's inability to sustain its upward momentum. Bullish forces are insufficient to push prices higher, and bearish forces are insufficient to trigger a decisive collapse. The lack of ETF inflows is particularly significant because, in this cycle, sustainable upward movements have almost always required sustained institutional demand.
In other words, the market is weak, hesitant, and increasingly mechanized—driven not by narratives or capital flows, but by liquidity gaps and passive order behavior.
Why the next macro catalyst is crucial
The upcoming interest rate cut meeting may cause some short-term volatility for Bitcoin, but even its potential upward impact should be interpreted with caution. Liquidity remains tight, and market sentiment appears somewhat weak.
Even if dovish signals bring temporary relief, the overall environment won't change overnight; structural demand will still need to play a role again. More interestingly, what if the market perceives the outcome as disappointing? In this case, market sentiment could shift rapidly, breaking the current deadlock and revealing a clearer direction—perhaps downwards, as the path of least resistance is currently downwards.
Paradoxically, a failed "good news" event might just be the one that ends the recent sideways consolidation.
Constructing a structured rating model
Given the current fragmented nature of signals, it is becoming increasingly important to construct a systematic scoring model for short-term, medium-term, and long-term indicators. Each indicator—financing rate, open interest, ETF fund flows, macroeconomic factors, liquidity concentration, and heatmap level—has different weights depending on the time span.
In a 7-day outlook, short-term structural indicators, such as heatmap liquidity or intraday open interest changes, should be given greater weight. Medium-term analysis must rely more on ETF holdings and macroeconomic trends. Long-term forecasts need to consider structural demand, regulatory clarity, and supply-side factors, such as halving and broader application.
With a reasonable rating distribution, Bitcoin's behavior can be transformed from subjective interpretation to quantitative analysis. The current allocation scores slightly lower on a short-term scale: not entirely bearish, but the overall trend is slightly downward due to weakening bullish interest, extremely low ETF participation, and significant liquidity resistance.


