
BTC's medium-term trend is weakening; short-term fluctuations cannot mask directional risks | Invited Analysis
- 核心观点:比特币处于关键趋势线交汇点,方向待定。
- 关键要素:
- 长期上升与短期下降趋势线即将交汇。
- 周线级别已进入空头市场结构。
- 上周策略验证成功,收益2.14%。
- 市场影响:关键区域争夺将决定短期市场走向。
- 时效性标注:短期影响
Conaldo, a featured market analyst at Odaily, holds a Master's degree in Financial Statistics from Columbia University. During his university years, he focused on quantitative trading in US stocks and gradually expanded to digital assets such as Bitcoin. Through practical experience, he has built a systematic quantitative trading model and risk control system. He possesses keen data insight into market fluctuations and is committed to continuous professional development in the trading field, pursuing stable returns. He will provide weekly in-depth analysis of BTC technical, macroeconomic, and funding changes, reviewing and showcasing practical strategies, and previewing recent noteworthy events for reference.
Core Summary:
• From a macro technical perspective (see Figure 3 below): On the Bitcoin daily chart, the upward trend line representing the long-term bull market (since the end of 2022) and the downward trend line defining the recent correction (since the October 2025 high) are about to converge. Currently, the market is in a corrective consolidation phase following the breakdown of the long-term trend. Bitcoin's price is under double pressure. Until the price breaks through this double pressure with strong volume, all upward movements should be considered rebounds within a bearish pattern. The ultimate basis for judging the market's medium-term direction will be whether these two key trend lines are effectively broken.
• Core viewpoint validated: The core judgment made last week that "the market will most likely enter a consolidation phase" has been highly consistent with the actual market trend. Bulls and bears repeatedly battled in the $87,500-$89,000 range, and the relative error between the mid-week low of $84,456 and the predicted upper limit of the support zone of $83,500 was approximately 1.18%.
• Validation of strategy execution effectiveness: Last week's trading strictly followed the established strategy, successfully completing four operations and achieving a cumulative return of 2.14%.
The following section will provide a detailed review of market prediction, strategy execution, and the specific trading process.
I. Bitcoin Market Review Last Week (December 15 - December 21)
1. Review of last week's market trend forecast and trading strategy:
Last week's forward-looking analysis clearly pointed out that the market was likely to enter a period of consolidation and adjustment . The $87,500-$89,000 area was designated as a key observation zone, and the outcome of the battle between bulls and bears there would directly determine the market's short-term direction. It is particularly important to note that if this area is effectively broken, it will directly affect the strength and depth of the subsequent price correction. The following is a recap and analysis of the strategy.
① Review of market trend predictions:
• Key resistance levels: First resistance is seen in the $ 92,500–$94,500 area; second resistance is seen in the $ 96,500–$98,500 area.
• Key support levels: First support is seen in the $ 87,500–$89,000 area; second support is seen in the $ 80,000–$83,500 area.
② Review of operational strategies:
• Medium-term strategy: Maintain a medium-term position of around 65% (short positions).
• Short-term strategy: To cope with market trends, we initially drafted two short-term trading plans, A and B. Based on actual market developments, we ultimately adopted Plan B as the core strategy and implemented it accordingly.
• Opening a position: If the price falls below the $87,500-$89,000 range and this is confirmed, establish a 30% short position.
• Risk control: Stop loss set above $89,000.
• Close positions: When the price drops to the $ 80,000-$83,500 range and encounters resistance, close all short positions and take profits.
2. Last week, four short-term trades were successfully completed as planned (Figure 1), achieving a cumulative return of 2.14% . Detailed trade records and a recap are as follows:
Bitcoin 30-minute candlestick chart: (Momentum-based model + Spread trading model) 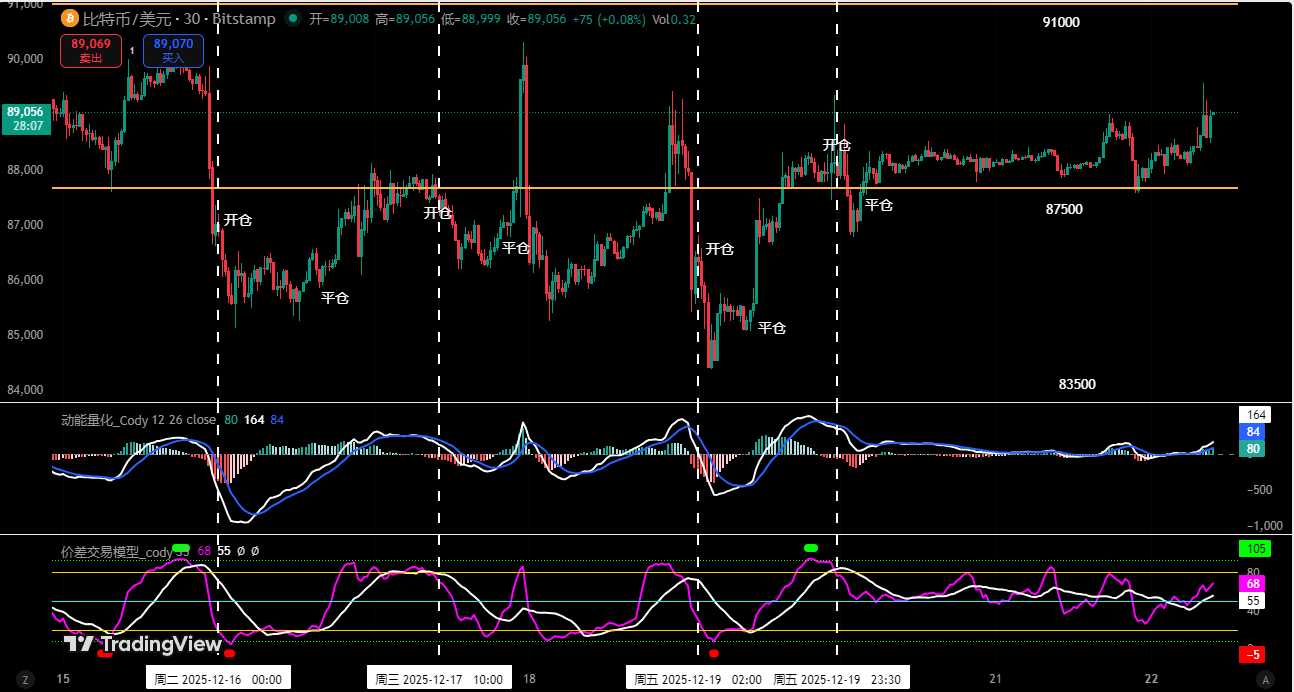
Figure 1
① Summary of transaction details:
② Short-term trading review:
• First trade ( profit of 0.73% ): We strictly adhered to the strategy of "shorting when the price breaks through the key level". When the price action triggered the signal, the spread trading model simultaneously issued a top signal. Based on this, we decisively established a 30% short position and finally closed the position for profit when the price fell back to the vicinity of the previous low support area.
• Second and third trades ( cumulative profit of 1.41% ): Based on the "short sell when rebounding to the core resistance area" trading pattern. When the price encountered resistance in the $87,500-$89,000 range , the combined signals from the two models successfully completed these two trades.
• Fourth trade ( profit 0 ): The entry logic for this trade was the same as the previous two trades. It is worth emphasizing that in this trade, we strictly adhered to the principle of "moving the stop loss to the entry cost price immediately when the floating profit reaches 1% ", which resulted in the trade being closed at break-even.
II. Quantitative Technical Analysis: Based on Multi-Model and Multi-Dimensional Operations
Based on last week's market performance, this article will utilize a multi-dimensional analysis model to conduct an in-depth analysis of the evolution of Bitcoin's internal structure.
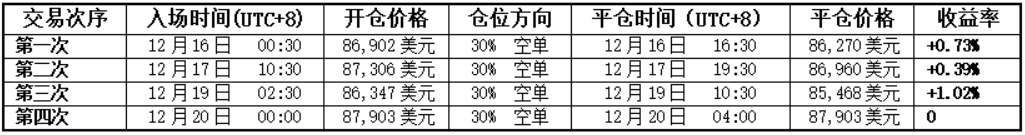
Bitcoin Weekly Chart: (Momentum-based quantification model + sentiment-based quantification model)
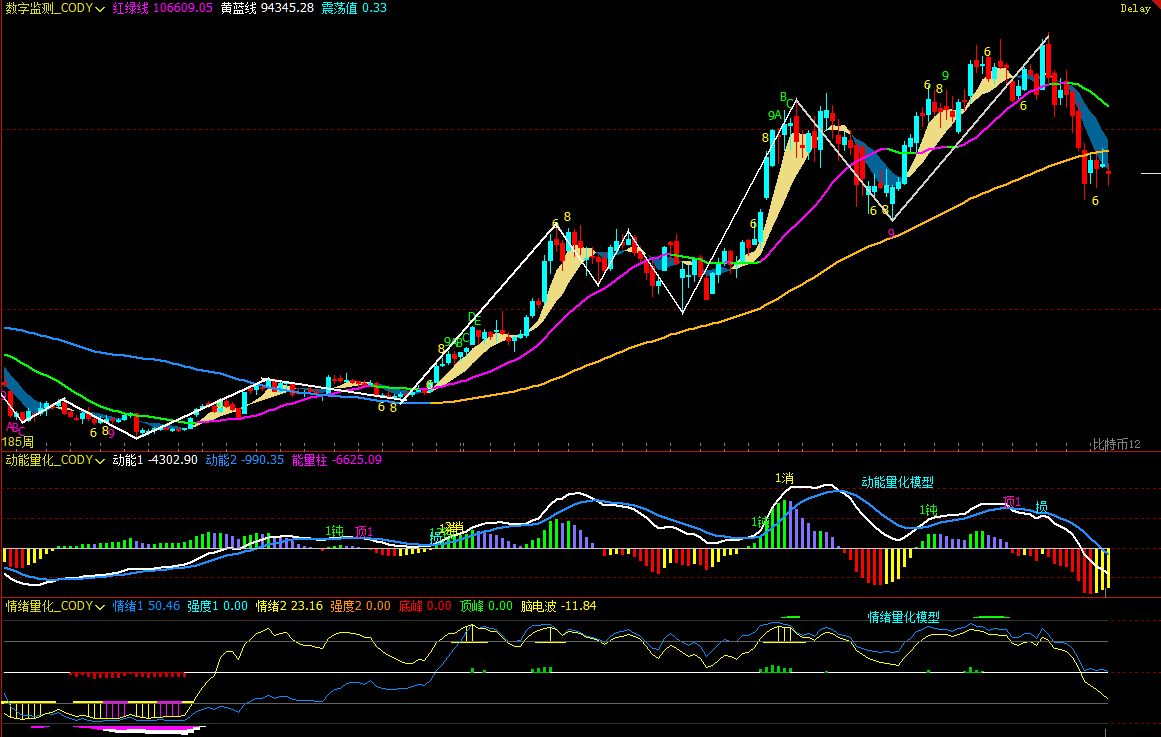
Figure 2
1. As shown in Figure 2, analysis from the weekly chart:
• Momentum quantification model: After last week's adjustment, both momentum indicator lines continue to operate below the zero axis. Although the rebound in the previous few weeks has prevented a significant increase in the negative momentum bars, the current market structure remains weak, and the risk of further downward pressure should be noted.
The kinetic energy model predicts: Price decline index: High
• Emotion Quantification Model: The blue emotion line has a value of 50.46, with an intensity of zero; the yellow emotion line has a value of 23.16, with an intensity of zero and a peak value of 0.
The sentiment quantification model predicts: Price pressure and support index: Neutral.
• Digital Monitoring Model: As shown in the chart, the price has been below the bullish/bearish (yellow and blue lines) dividing line for 5 weeks, increasing the probability of a valid break below. A short-term bottoming signal (above 9) has not yet appeared.
The above data indicates that Bitcoin is in a downtrend, has entered a bear market on the weekly chart, and caution is advised regarding the risk of a correction.
Bitcoin daily candlestick chart:

Figure 3
2. As shown in Figure 3, analysis from the daily chart:
• Momentum-based model: In last week's market, the two momentum lines went through a repeated crossover process of " golden cross - death cross - golden cross " below the zero axis, but the trading volume did not increase and the positive momentum bars did not grow significantly.
The momentum model predicts that the bulls and bears are fiercely vying for market control, while the bullish momentum is weak.
• Sentiment Quantification Model: After the market closed last Sunday, the blue sentiment line value was 17, with an intensity of zero; the yellow sentiment line value was 45, with an intensity of zero.
The sentiment quantification model predicts: Stress and support index: Neutral
The above data suggests that the market is in a downtrend on the daily chart, and short-term market movements may be volatile.
III. Market Forecast for This Week (December 22-28)
1. The market is expected to mainly exhibit a wide-range fluctuation pattern this week. The core observation range is $89,500 to $91,000 , and the outcome of the struggle in this area will determine the short-term trend.
• If the price breaks below the support level, it will indicate a stronger correction, with the correction expected to widen and the correction period to extend accordingly.
If the market can hold its ground , it is expected to continue its oscillating rebound, but the upside potential is likely to be relatively limited.
2. Core pressure level:
• First resistance zone: $ 89,500–$91,000 area
• Second resistance zone: $ 93,000–$94,500 area
• Key resistance zone: Around $ 97,000
3. Core support level:
• First support level: $ 86,500–$87,500 area
• Second support level: $ 83,500–$84,500 area
• Key support level: around $ 80,000 .
IV. Trading Strategy for This Week (Excluding Unexpected News) (December 22 - December 28)
1. Medium-term strategy: Maintain a medium-term position of around 65% (short positions).
2. Short-term strategy: Use 30% of your position, set a stop-loss point, and look for opportunities to profit from price differences based on support and resistance levels. (Use a 30-minute timeframe as the trading period).
3. Closely observe the struggle and gains/losses between bulls and bears in the $ 89,500-$91,000 range. To respond to market conditions, we have formulated two short-term trading plans , A and B :
• Option A : If the position is effectively held in this area:
• Opening a position: If the price rebounds to the $93,000-$94,500 range and encounters resistance, establish a 30% short position.
• Risk control: Set the stop loss for short positions above $96,000.
• Close positions: When the price falls to the $ 89,500-$91,000 range and finds resistance, close all short positions and take profits.
• Option B: If the area is effectively broken:
• Opening a position: If the price falls below this area and this is confirmed, establish a 30% short position.
• Risk control: Stop loss set above $92,000.
• Closing positions: When the price drops to the $ 83,500-$84,500 range and encounters resistance, consider partially or completely closing out positions to lock in profits.
V. Special Notes
1. When opening a position: immediately set the initial stop loss level.
2. When the profit reaches 1% , move the stop loss to the opening cost price (break-even point) to ensure the safety of the principal.
3. When the profit reaches 2%, move the stop loss to the position where the profit is 1%.
4. Continuous monitoring: For every additional 1% profit in the coin price thereafter, the stop loss level will be moved by 1% to dynamically protect and lock in existing profits.
(Note: The 1% profit trigger threshold mentioned above can be adjusted flexibly by investors based on their own risk appetite and the volatility of the underlying asset.)
VI. Macroeconomic Outlook and Key Events This Week (December 22-28 | Christmas Week)
1. The Christmas holiday shortens trading hours, leading to a significant decrease in liquidity.
US stocks will close early on Wednesday this week and be closed all day on Thursday. With holiday factors and year-end settlements combined, overall market liquidity is low, making prices more susceptible to being driven by sentiment and one-sided funds. We need to be wary of "false breakouts" and amplified short-term volatility under low trading volume.
2. Expectations for a new Federal Reserve Chair nomination are rising, with policy continuity becoming a market focus.
Markets are focused on whether Trump will announce his nominee for the next Federal Reserve chair during the Christmas holidays. Kevin Hassett is currently considered a clear frontrunner, with his policy stance seen as favoring "predictable, gradual adjustments."
(If the nomination is finalized, it will help stabilize interest rate expectations and risk appetite in the short term; if an unexpected candidate is chosen, it may trigger periodic fluctuations in interest rates and the US dollar.)
3. The release of US Q3 data confirms the "soft landing" narrative.
The revised data on U.S. third-quarter GDP, personal consumption expenditures, and core PCE, to be released on Tuesday, will be used to confirm whether the economic resilience and inflation path are consistent with previous assessments.
(If the data is moderately revised, the market is more likely to maintain its pricing in a rate cut path next year; if there is a significant upward revision, long-term interest rates may rise again.)
4. Employment data as a marginal indicator at year-end
While the initial jobless claims figures released on Wednesday are not indicative of a trend, they still serve as a helpful indicator of whether the labor market is showing signs of easing around the holidays.
(The current outlook leans more towards "stability rather than deterioration," and the impact on the market is expected to be limited.)
5. The Bank of Japan provides dynamic global liquidity references.
The speech by Bank of Japan Governor Kazuo Ueda and the November unemployment data will continue to influence market judgments on the pace of the normalization of Japan's monetary policy.
(If the yen's volatility increases, it could create sentiment disturbances in global risk assets, especially US stocks and the cryptocurrency market.)
Financial markets are constantly changing, and all market analysis and trading strategies need to be dynamically adjusted. All views, analytical models, and operational strategies presented in this article are derived from personal technical analysis and are for personal trading journal use only. They do not constitute any investment advice or basis for action. The market is risky; invest with caution. DYOR.


