
Wall Street is counting on Bitcoin's high volatility to pay its year-end bonuses.
- 核心观点:比特币波动机制正发生关键转变。
- 关键要素:
- 隐含波动率近期逆势上升。
- 期权未平仓合约显示看涨偏好。
- 波动率指数突破近期区间。
- 市场影响:可能推动价格由期权驱动反弹。
- 时效性标注:短期影响
This article is from Bitwise consultant Jeff Park.
Compiled by Odaily Planet Daily (@OdailyChina); Translated by Moni
In just six weeks, Bitcoin's market capitalization evaporated by $500 billion. ETF outflows, Coinbase discounts, structured selling, and the liquidation of poorly positioned long positions occurred without any clear catalysts for a market rebound. Furthermore, persistent concerns such as whale selling, heavily indebted market makers, a lack of defensive liquidity, and the existential threat posed by the quantum crisis remain obstacles to a rapid recovery for Bitcoin. However, one question has consistently plagued the community throughout this decline: what exactly happened to Bitcoin's volatility?
In fact, the mechanism by which Bitcoin fluctuates has quietly changed.
Over the past two years, it has been widely believed that ETFs have "tamed" Bitcoin, curbing its volatility and transforming this once highly sensitive asset to the macroeconomy into a trading tool subject to institutional regulation and volatility suppression mechanisms. However, if you focus on the past 60 days, you will find that this is not the case, and the market seems to have returned to its previous volatile state.
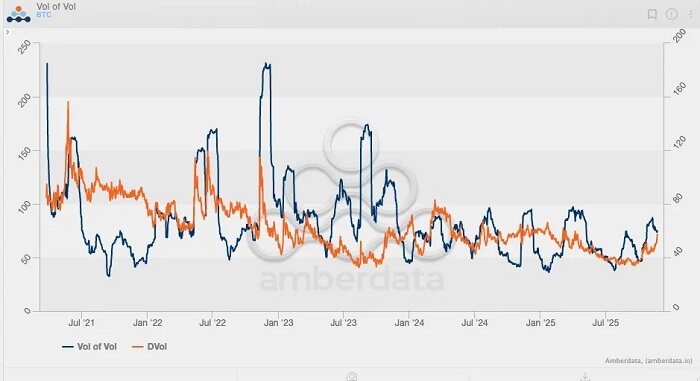
Looking back at Bitcoin's implied volatility over the past five years, we can see that the peaks in this indicator are predictable:
The first peak (and also the highest peak) occurred in May 2021, when implied volatility surged to 156% due to a crackdown on Bitcoin mining.
The second peak occurred in May 2022, triggered by the Luna/UST crash, reaching a peak of 114%.
The third peak occurred in June and July 2022, when 3AC was liquidated;
The fourth peak occurred in November 2022, when FTX crashed.
Since then, Bitcoin volatility has never exceeded 80%. The closest it came was in March 2024, when the spot Bitcoin ETF experienced three months of continuous inflows.

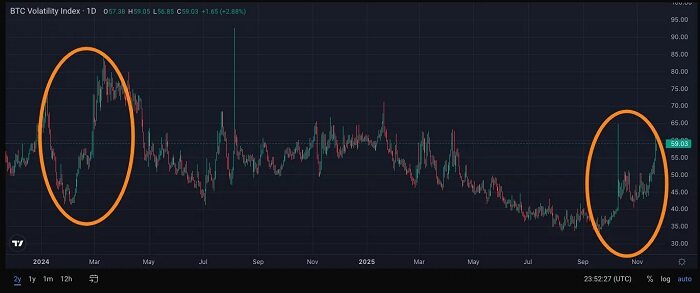
A clearer pattern emerges when observing the Bitcoin Volatility Index (VVII), which is essentially the second derivative of volatility, or a reflection of the rate of change of volatility itself. Historical data shows that the highest VVII occurred during the FTX crash, when it surged to approximately 230. However, since the ETF received regulatory approval in early 2024, the Bitcoin VVII has never broken 100, and implied volatility has consistently declined, unrelated to spot price movements. In other words, Bitcoin seems to have abandoned the high volatility characteristic of the market structure prior to the ETF launch.
However, the situation has changed in the past 60 days, with Bitcoin volatility rising for the first time since 2025.
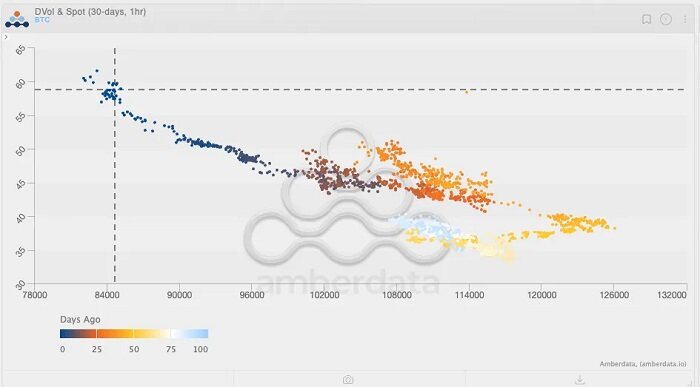
Refer to the chart above and note the color gradient (light blue to dark blue represent "a few days ago"). Tracking recent price action, you'll notice a brief window where the spot Bitcoin volatility index climbed to around 125, while implied volatility also increased. At that time, Bitcoin's volatility indicators seemed to suggest a potential market breakout, given the previous positive correlation between volatility and spot price. However, contrary to expectations, as everyone now knows, the market subsequently reversed course and fell.
Even more interestingly, implied volatility (IV) has continued to rise despite the decline in spot prices. This is a rare occurrence since the ETF era, where Bitcoin's price has been falling while implied volatility has been rising. It could be argued that this period represents another significant "turning point" in Bitcoin's volatility pattern: Bitcoin's implied volatility is returning to levels seen before the advent of ETFs.

To better understand this trend, we use a skew chart for further analysis. During periods of significant market decline, the skewness of put options typically spikes rapidly—as seen in the three major events mentioned earlier, the skewness reached -25%.
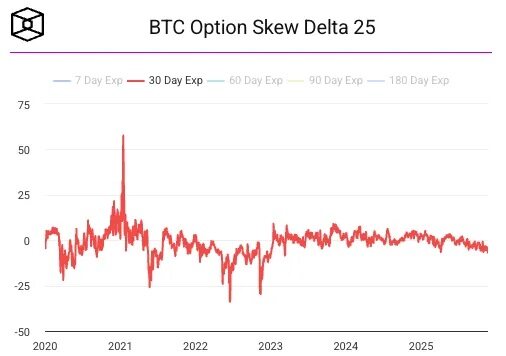
However, the most noteworthy data point is not the skewness during market downturns, but rather January 2021, when the peak skewness of call options exceeded +50%. This coincided with Bitcoin experiencing its last true mega-gamma squeeze in recent years: the price of Bitcoin surged from $20,000 to $40,000, breaking its all-time high in 2017 and triggering an influx of trend followers, CTAs, and momentum funds. Actual volatility exploded, forcing traders to buy spot/futures to hedge the gamma risk of short positions, which in turn pushed prices higher. This also marked Deribit's first record-breaking retail inflow, as traders discovered the power of out-of-the-money call options.
The analysis shows that observing changes in options positions is crucial. Ultimately, it is options positions—not just spot trading—that have driven the decisive move that propelled Bitcoin's price to new highs.
With another "inflection point" in Bitcoin volatility trends emerging, prices may once again be driven by options. If this shift continues , the next wave of Bitcoin's upward movement will not only come from ETF inflows but also from a volatile market (with more investors entering to profit from volatility), as the market finally recognizes Bitcoin's true potential.
As of November 22, 2025, the top five USD open interest trades by notional value on the Deribit platform are as follows:
1. Put options expiring on December 26, 2025, with an value of $85,000 and an open interest of $1 billion;
2. Call options expiring on December 26, 2025, valued at $140,000, with an open interest of $95,000;
3. Call options worth $200,000 expiring on December 26, 2025, with an open interest of $720 million;
4. Put options expiring on November 28, 2025, with an value of $80,000 and an open interest of $660 million;
5. Call options expiring on December 26, 2025, with a value of $125,000 and an open interest of $620 million.
In addition, as of November 26, BlackRock's top ten IBIT options positions are as follows:
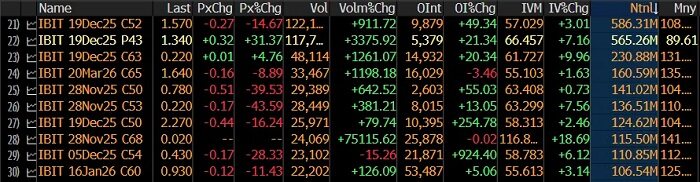
This shows that the demand for option allocation (calculated by notional value) before the end of the year is greater than the demand for option allocation (calculated by notional value), and the strike price range of options is more biased towards out-of-the-money options than the strike price range of options.
Further observation of Bitcoin's two-year implied volatility chart reveals that the sustained volatility demand over the past two months most closely resembles a similar pattern seen on the chart between February and March 2024. Many will recall that this coincided with the surge driven by Bitcoin ETF inflows. In other words, Wall Street needs Bitcoin to maintain high volatility to attract more investors, as Wall Street is a trend-driven industry that prefers to maximize profits before year-end bonuses.
Volatility is like a self-driven profit-driven machine.
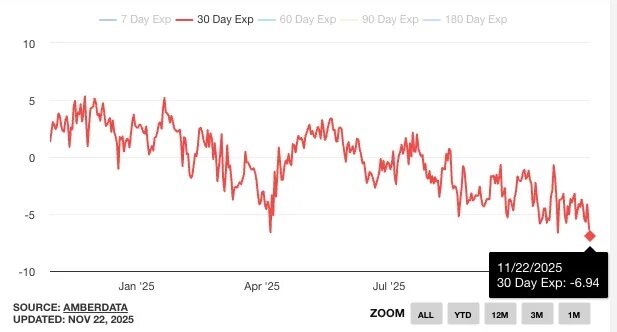
Of course, it's too early to say whether volatility has broken out of its trend or whether ETF flows will follow suit; in other words, spot prices may continue to fall. However, if spot prices continue to decline from their current levels while implied volatility (IV) climbs during this period, it strongly suggests a potential significant price rebound, especially in a "sticky options" environment where traders still tend to go long. But if the sell-off continues while volatility stagnates or even declines, the path out of the downtrend will be significantly narrower, especially given the recent structural sell-off that has triggered a series of negative externalities. In this scenario, the market is less looking for a rebound point and more gradually forming a potential bearish trend.
The next few weeks are going to be interesting.


