
Still Falling? Crypto Market Sees Epic Turnover and Sell-Off After FOMC
- 核心观点:比特币市场显露疲态,回调风险加剧。
- 关键要素:
- 长期持有者已实现340万BTC利润。
- ETF流入放缓,需求减弱。
- 短期持有者成本基础11.1万美元是关键支撑。
- 市场影响:市场波动性加剧,下行风险上升。
- 时效性标注:短期影响。
Original article by Chris Beamish, Antoine Colpaert, CryptoVizArt, and Glassnode
Original translation: AididiaoJP, Foresight News
Bitcoin is showing signs of weakness following its FOMC-induced rally. Long-term holders have realized profits of 3.4 million BTC, while ETF inflows have slowed. Amid pressure in spot and futures markets, the short-term holder cost base of $111,000 is a key support level, a break of which could expose the market to the risk of a deeper decline.
summary
- Following the FOMC-driven rally, Bitcoin has entered a correction phase, showing signs of a “buy the rumor, sell the fact” market, with broader market structure pointing to weakening momentum.
- While an 8% drop is still relatively mild at this point, the $678 billion in realized market capitalization inflows and the 3.4 million BTC in profits realized by long-term holders highlight the unprecedented scale of this round of capital rotation and sell-off.
- ETF inflows slowed sharply around the FOMC meeting, while selling by long-term holders accelerated, creating a fragile balance of fund flows.
- Spot volumes surged during the sell-off, futures markets experienced sharp deleveraging swings, and liquidation clusters revealed the market's vulnerability to liquidity-driven fluctuations in both directions.
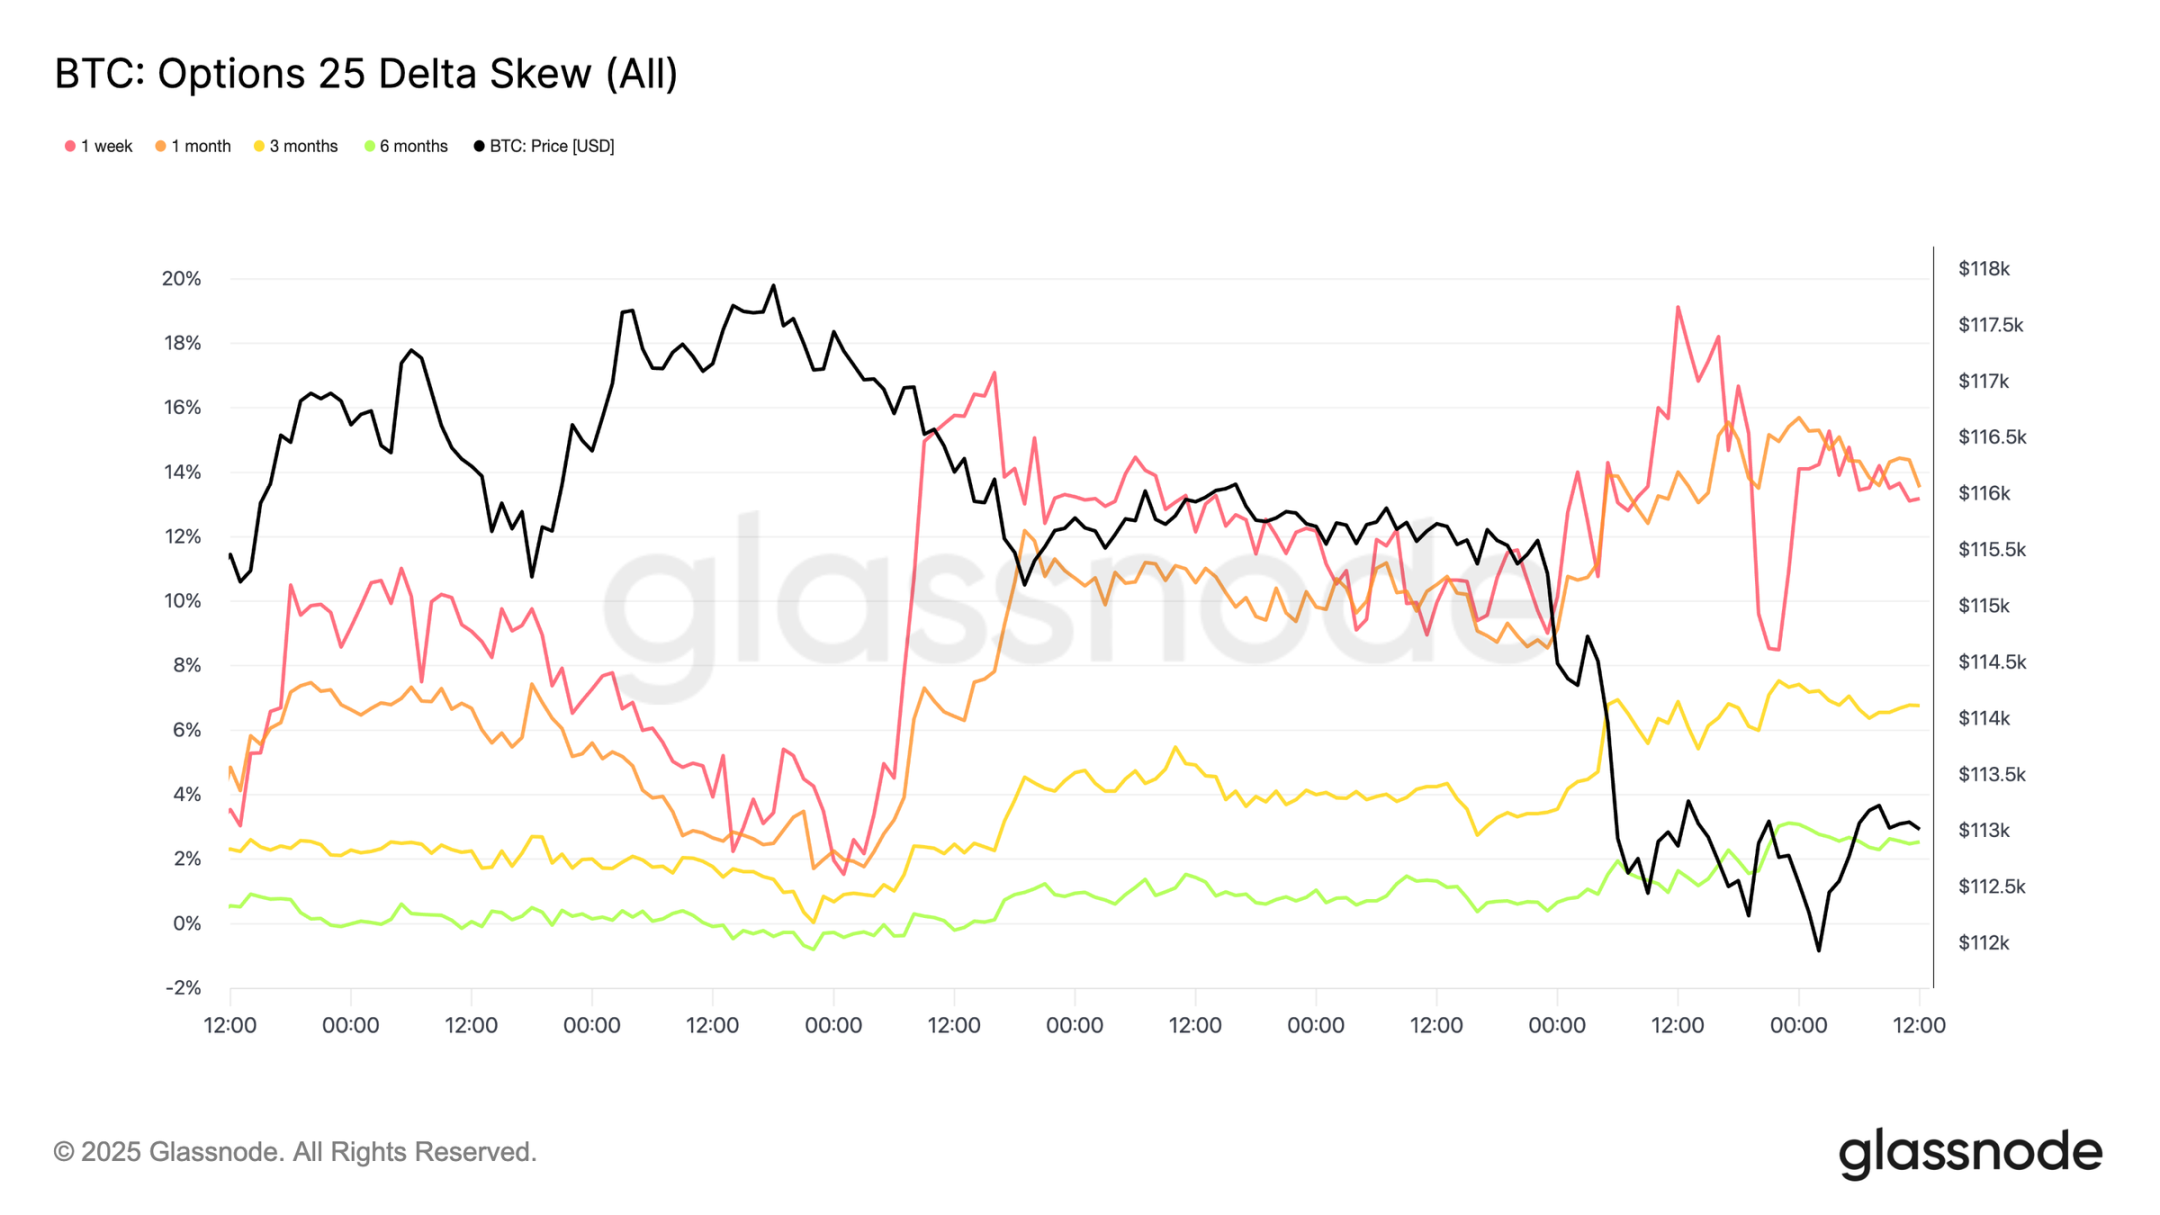
- Options markets are repricing aggressively, with skewness surging and strong demand for puts, pointing to defensive positioning, while the macro backdrop suggests growing market fatigue.
From uptrend to pullback
Following an FOMC-driven rally that peaked near $117,000, Bitcoin has transitioned into a correction, reflecting a classic "buy the rumor, sell the fact" pattern. In this issue, we look beyond short-term fluctuations to assess broader market structure, using long-term on-chain indicators, ETF demand, and derivatives positioning to assess whether this pullback is a healthy consolidation or the early stages of a deeper contraction.
On-chain analysis
Volatility Background
The current decline from the all-time high (ATH) of $124,000 to $113,700 is only 8% (and the latest decline is 12%), which is mild compared to the 28% decline in this cycle or the 60% drop in the previous cycle. This is consistent with the long-term trend of reduced volatility, both between and within macro cycles, similar to the steady progress of 2015-2017, but without the explosive surge at the end of the cycle.
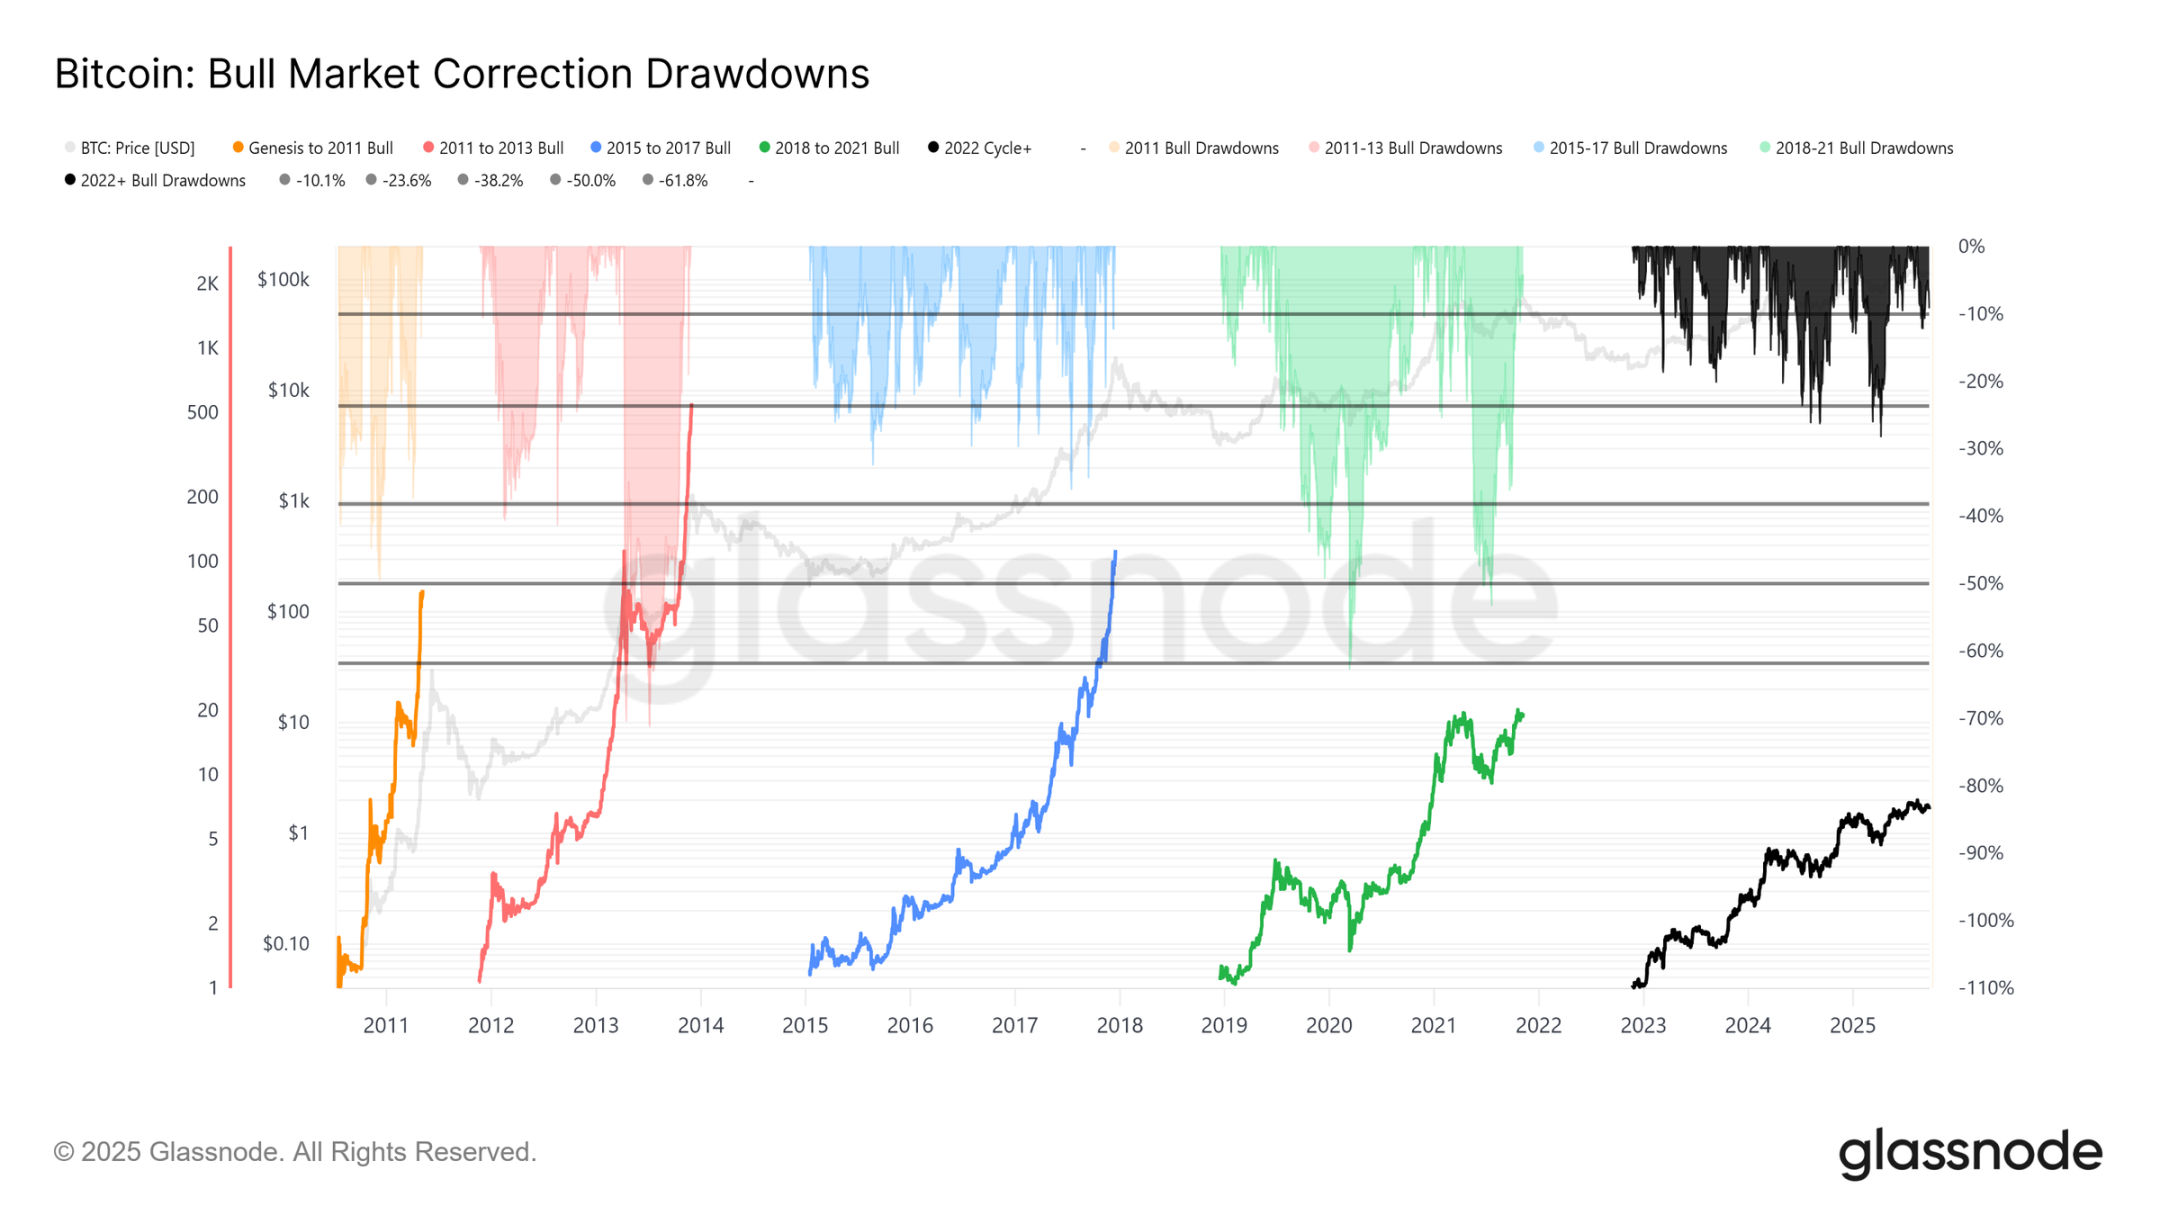
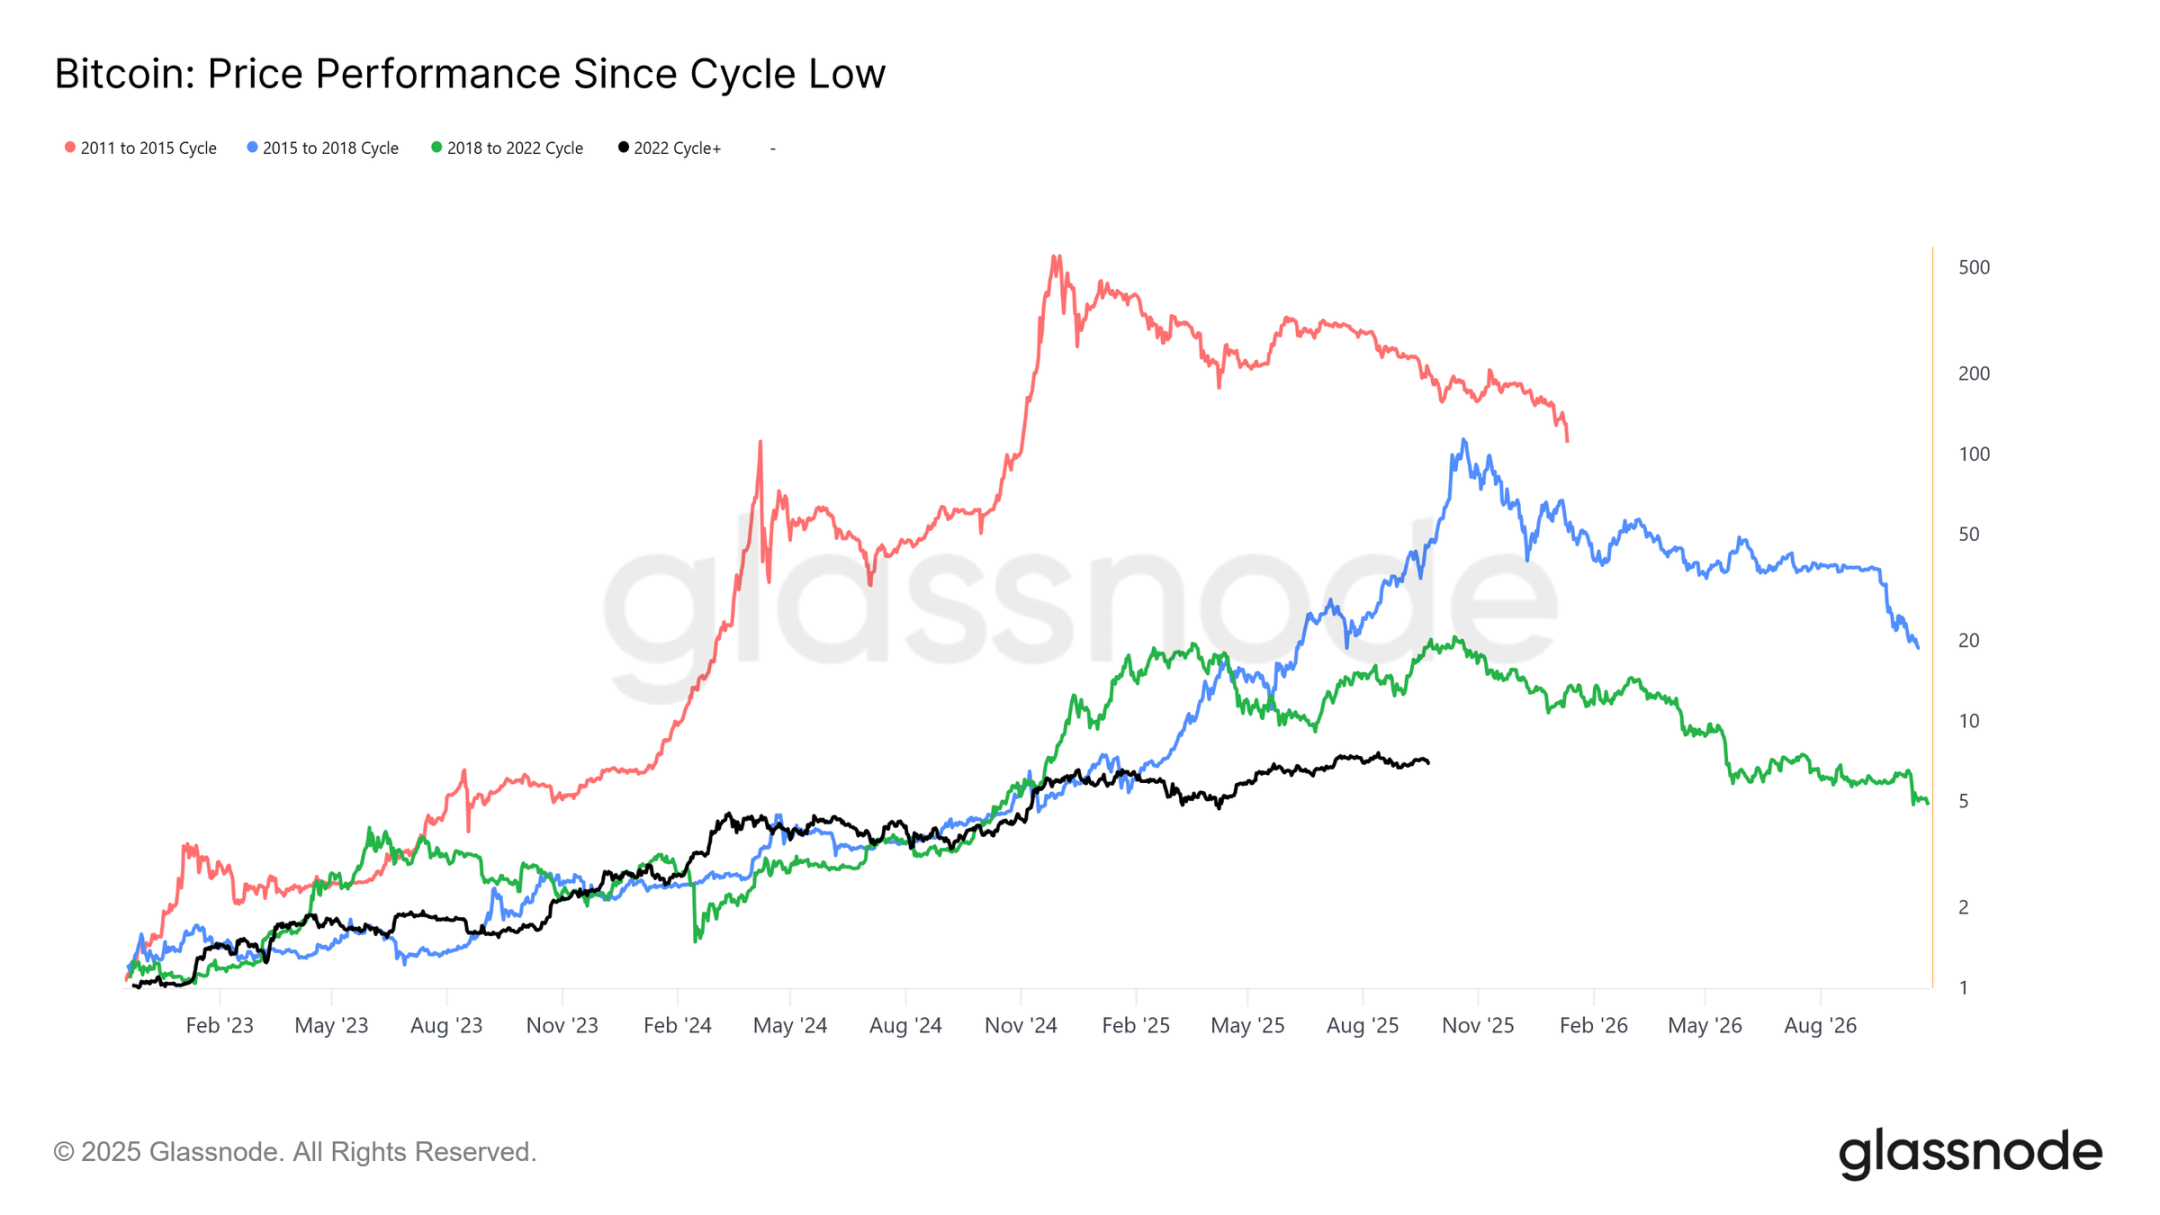
Cycle duration
Overlaying the past four cycles shows that even though the current trajectory closely matches the previous two cycles, peak returns have diminished over time. Assuming $124,000 marked the global top, this cycle has lasted approximately 1,030 days, very close to the approximately 1,060 days of the previous two cycles.
Capital inflow measurement
Beyond price action, capital deployment offers a more reliable perspective.
Realized market capitalization has seen three waves of increases since November 2022, bringing the total to $1.06 trillion, reflecting the scale of inflows supporting this cycle.
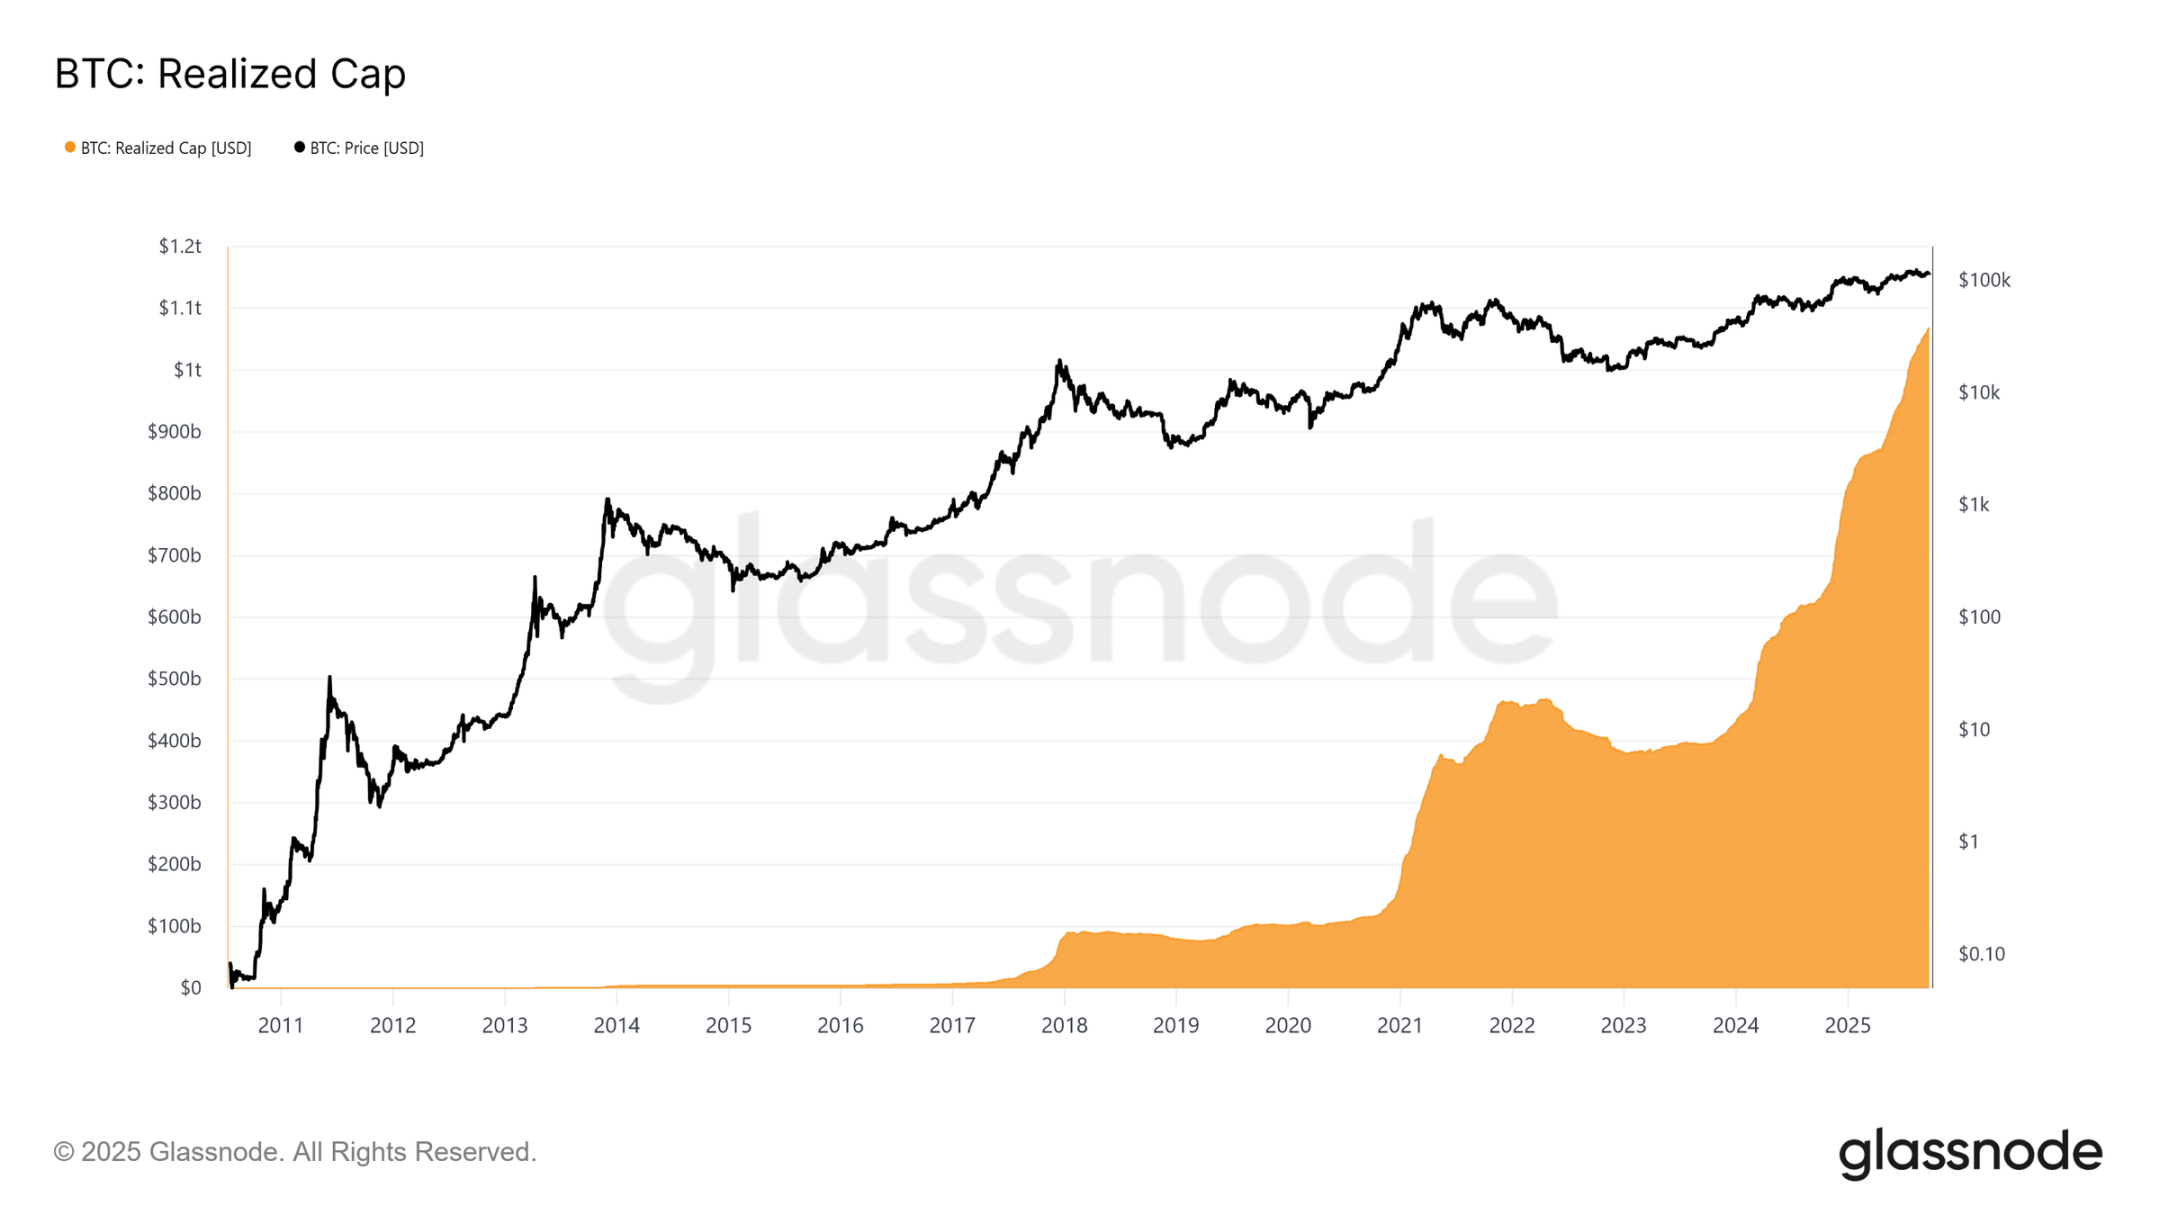
Realized market capitalization growth
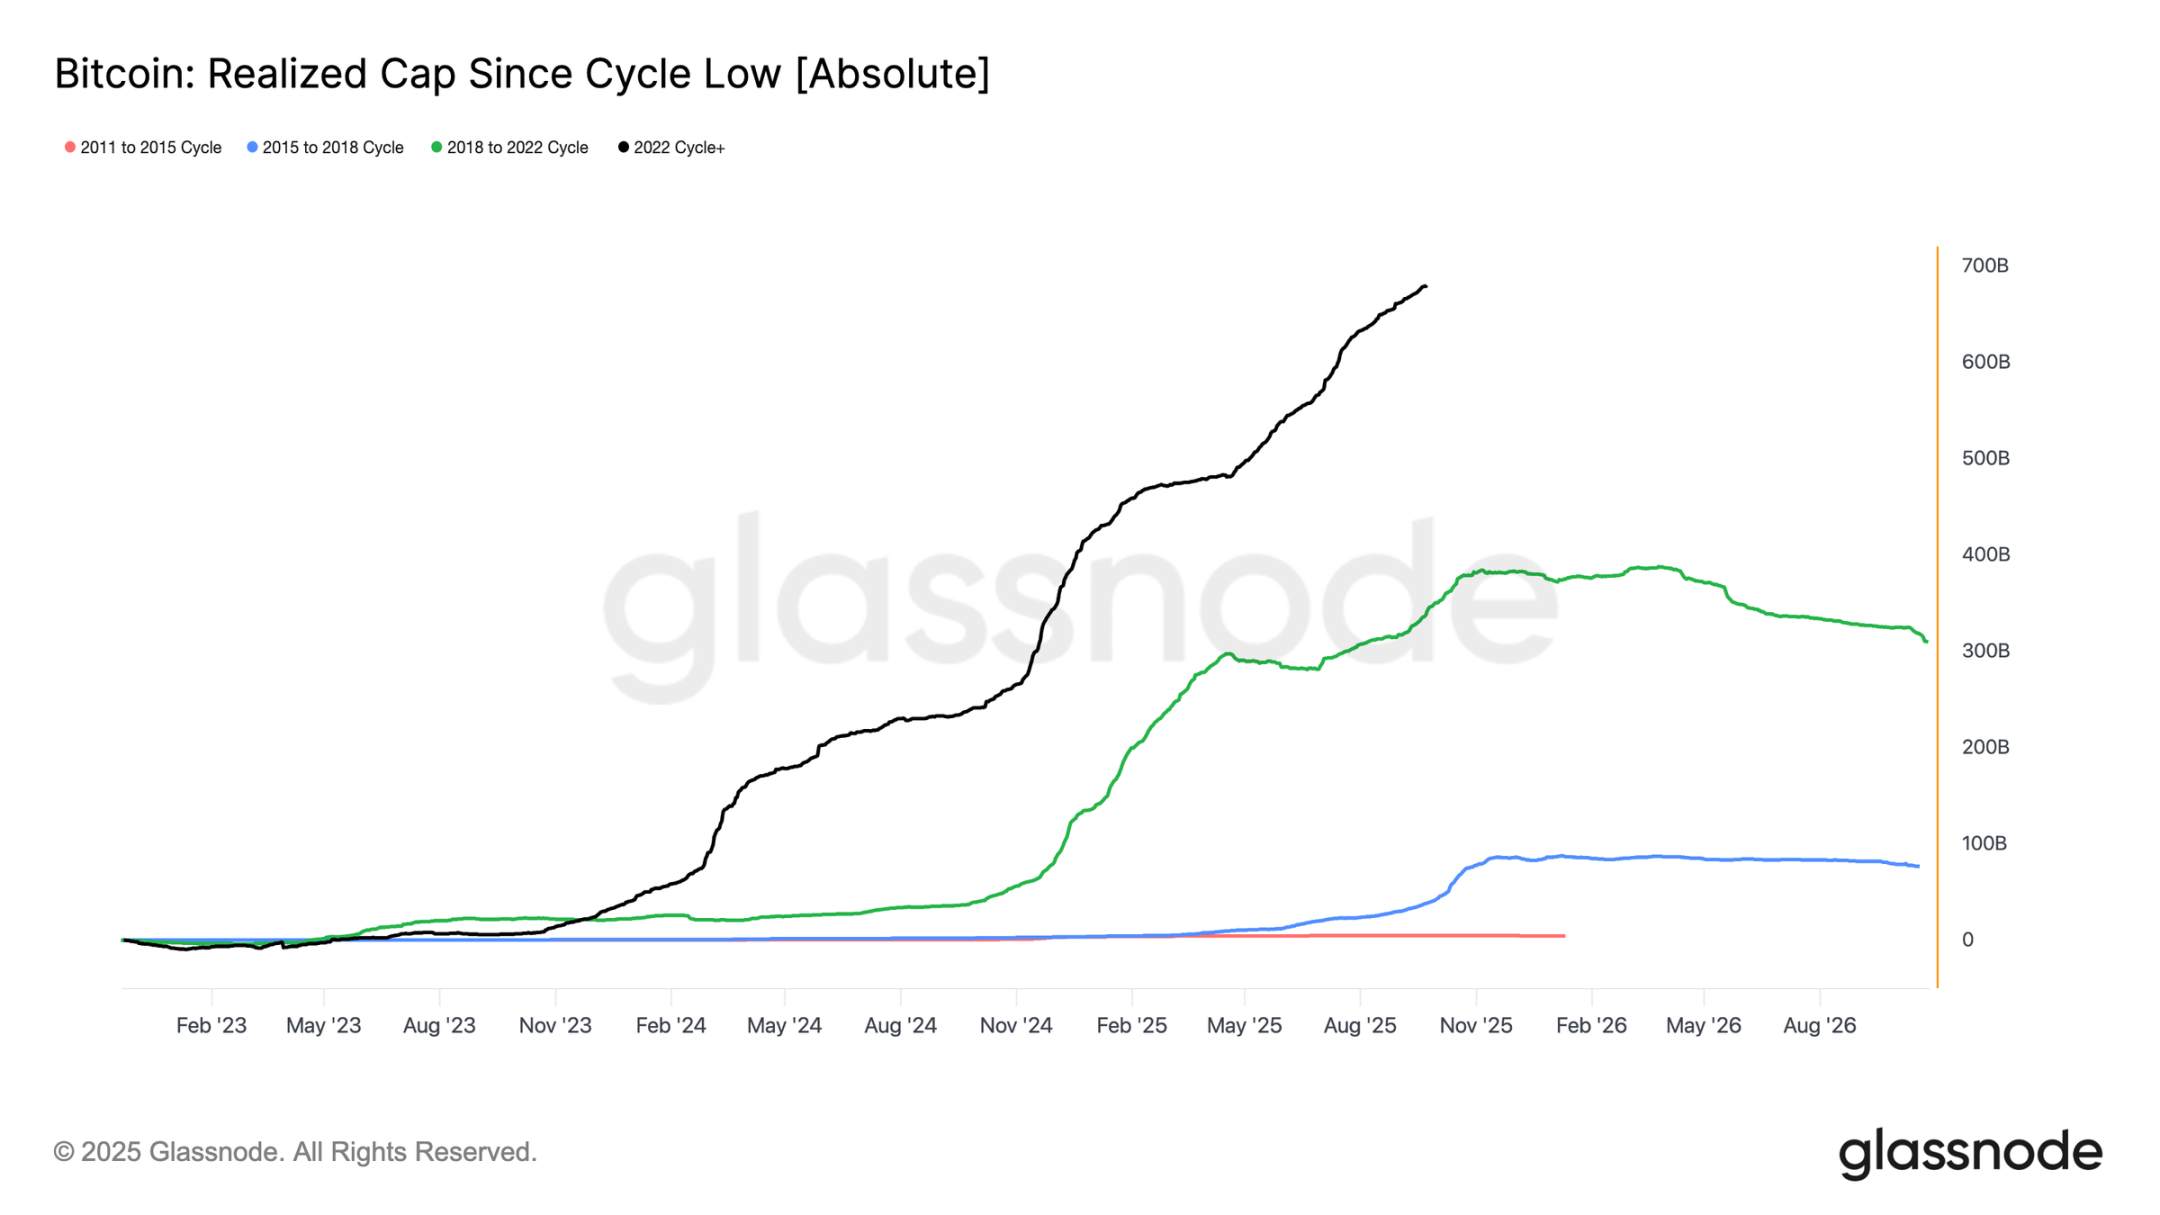
Background comparison:
- 2011–2015: $4.2 billion
- 2015–2018: $85 billion
- 2018–2022: $383 billion
- 2022–Present: $678 billion
This cycle has already attracted $678 billion in net inflows, almost 1.8 times the previous cycle, highlighting the unprecedented scale of its capital rotation.
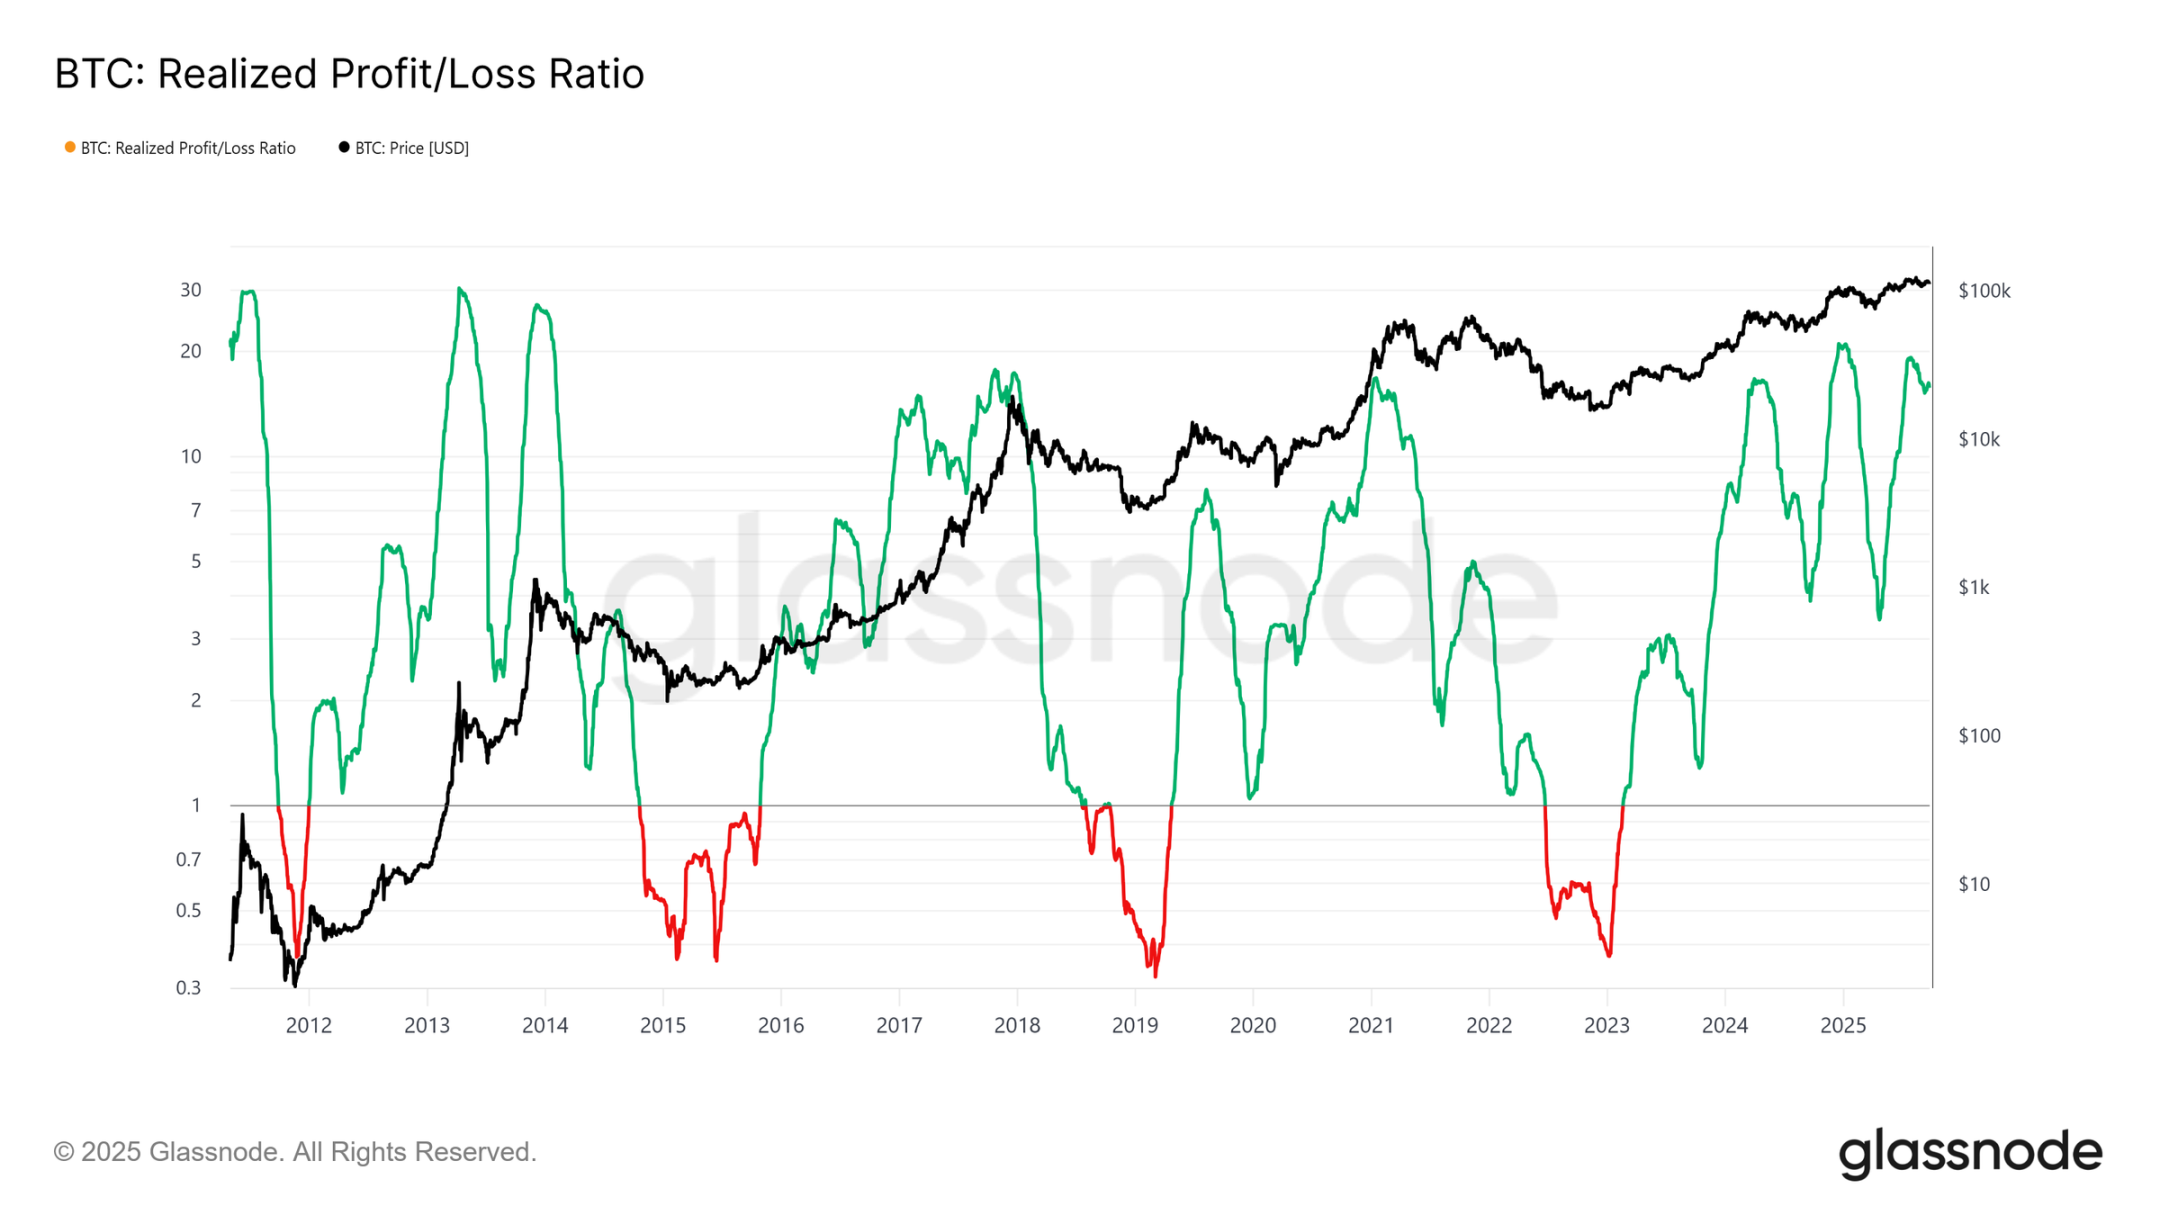
Profits reach peak
Another difference lies in the structure of inflows. Unlike the single surges of earlier cycles, this one saw three distinct, multi-month surges. The realized profit-loss ratio shows that each time profit realization exceeded 90% of the tokens moved, it marked a cyclical peak. Having just emerged from the third such extreme, the probability favors a cooling phase.
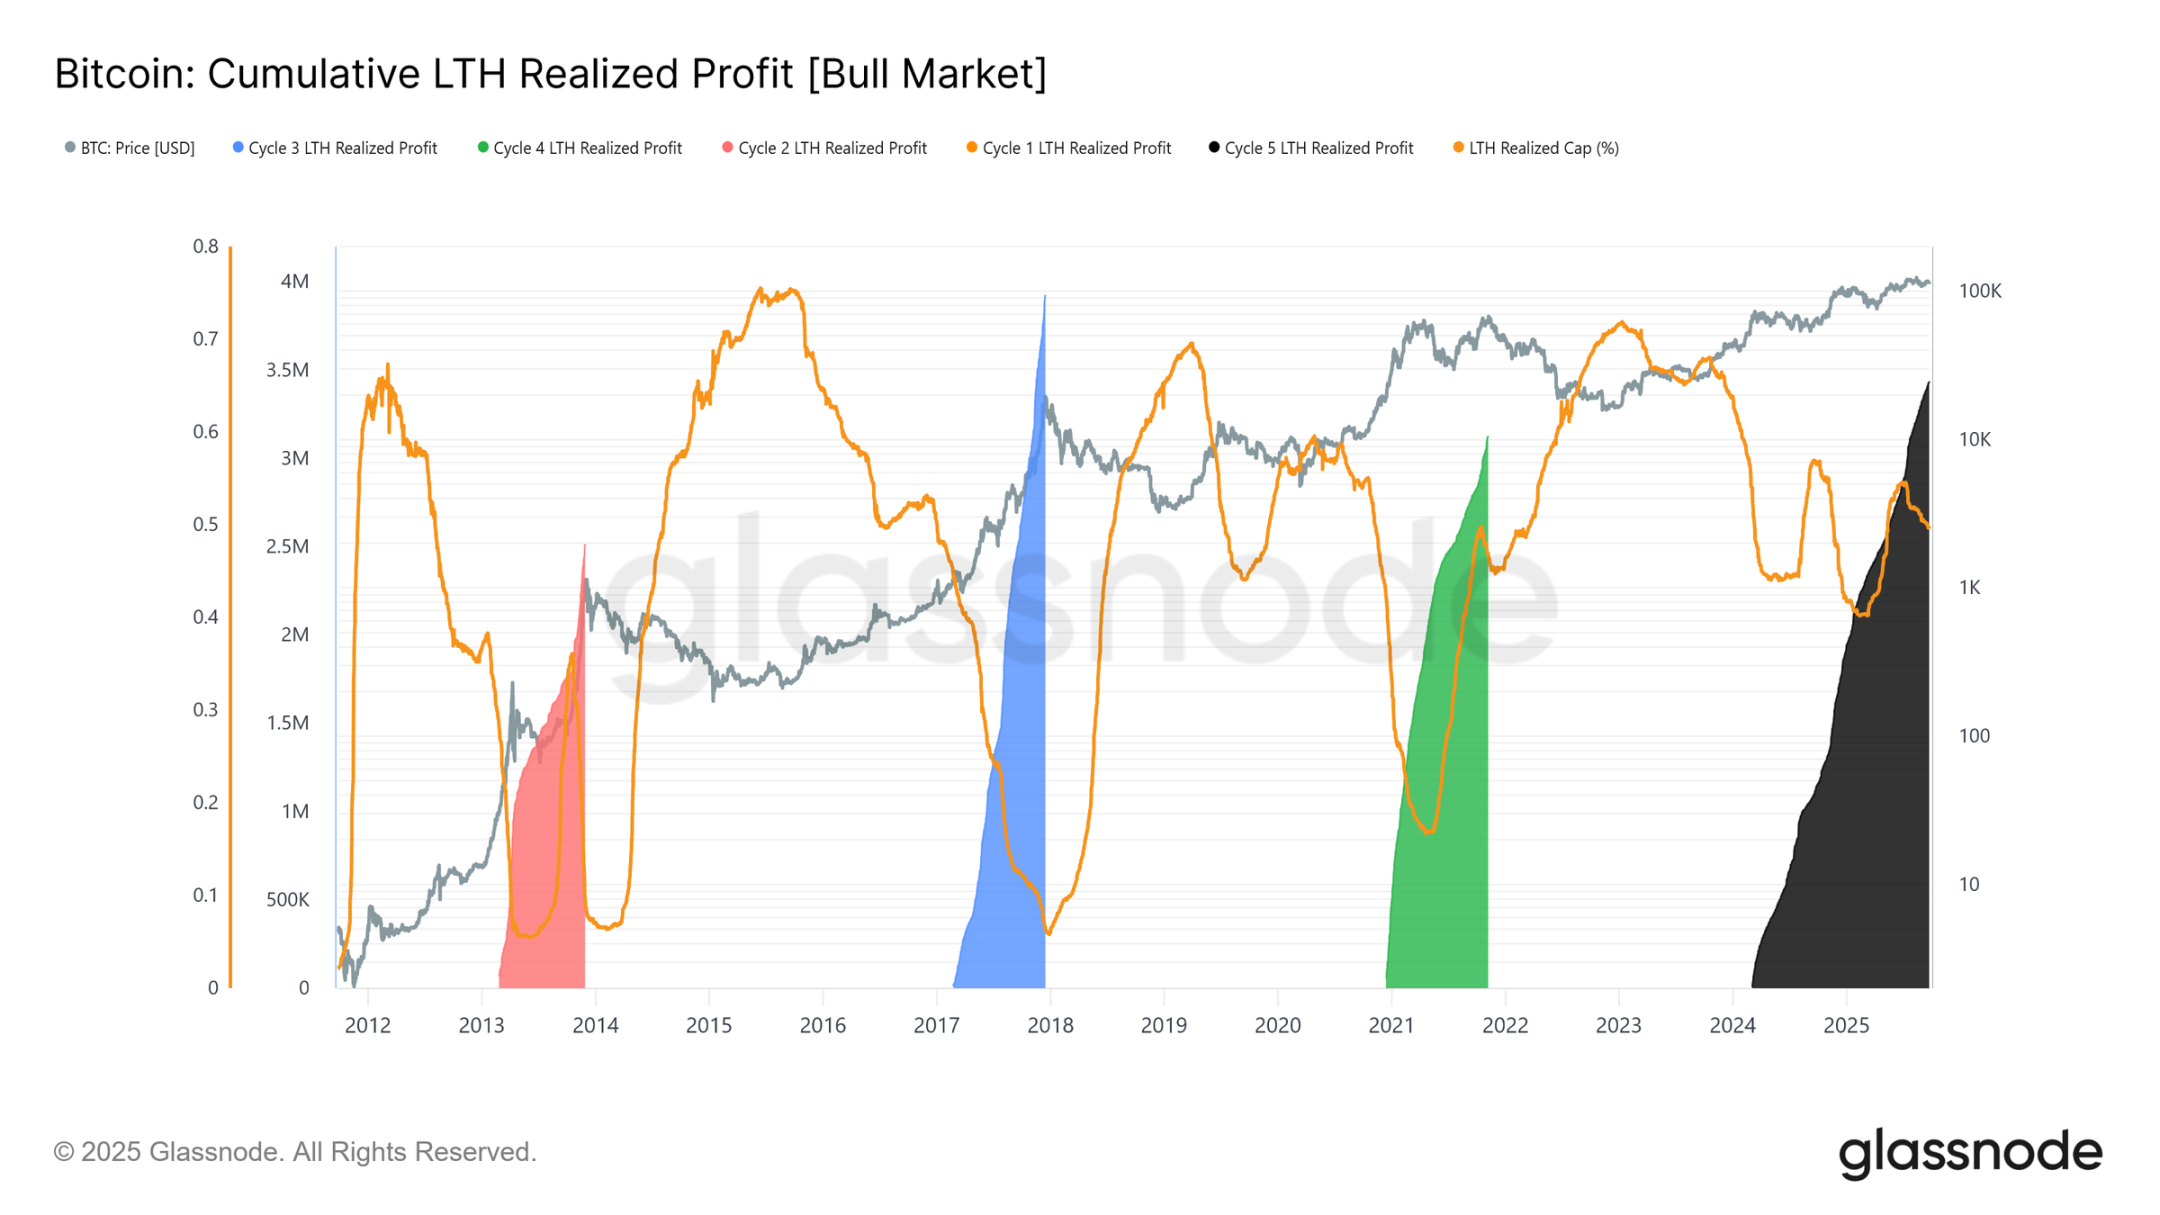
Long-term holder profit dominance
The scale becomes even clearer when focusing on long-term holders. This indicator tracks the cumulative profits of long-term holders from a new all-time high (ATH) to the cycle peak. Historically, their large sell-offs have marked tops. In this cycle, long-term holders have realized profits of 3.4 million BTC, already exceeding previous cycles and highlighting the maturity of this group and the scale of capital rotation.
Off-chain analysis
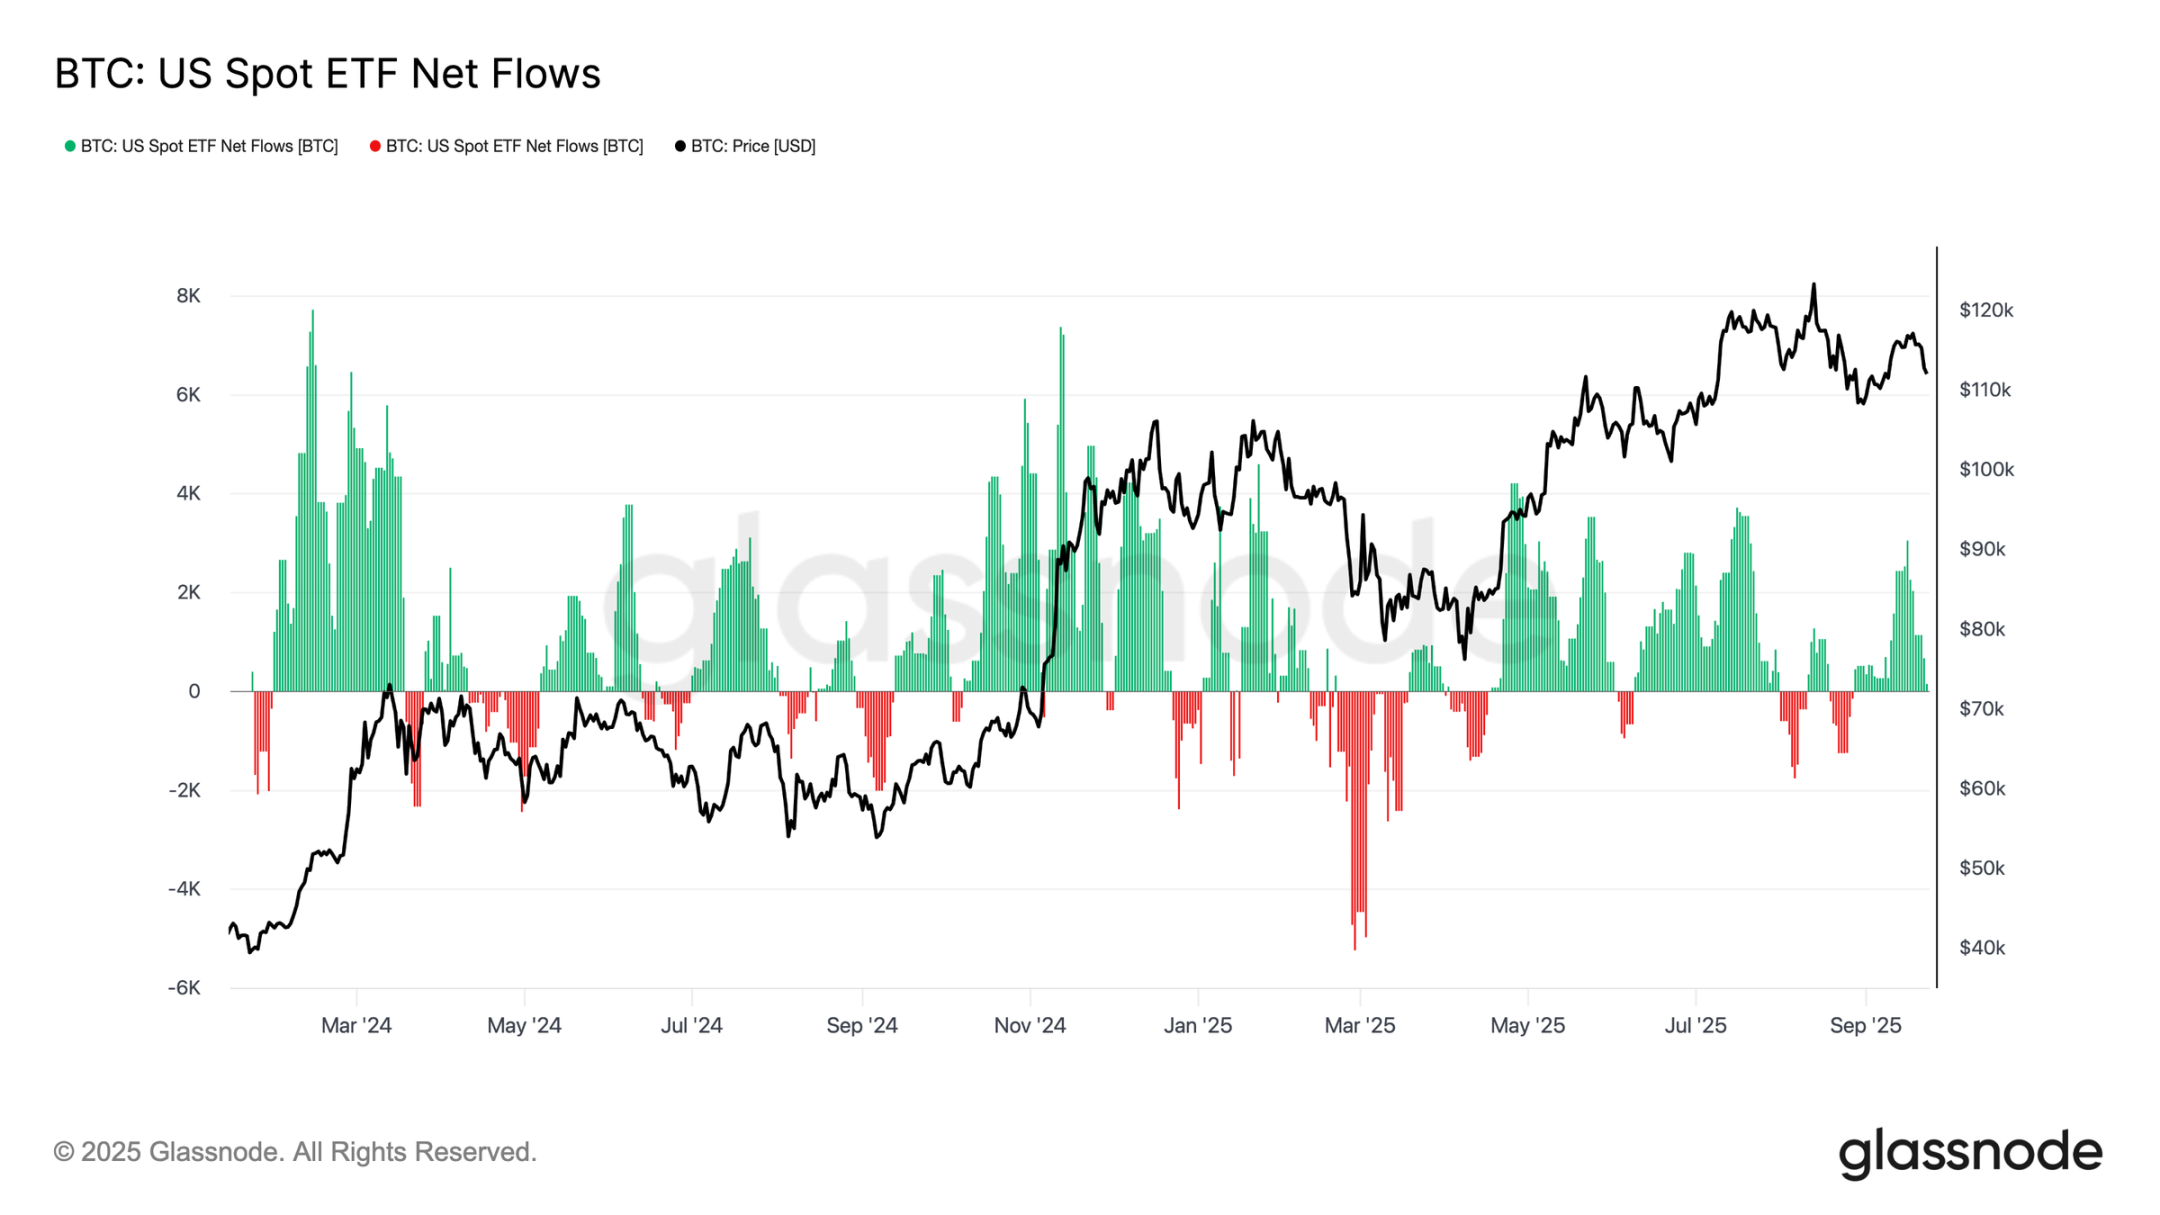
ETF Demand vs. Long-Term Holders
This cycle is also driven by the tug-of-war between supply sold by long-term holders and institutional demand through U.S. spot ETFs and DATs. With ETFs emerging as the new structural force, prices now reflect this push-pull effect: profit-taking by long-term holders limits upside, while ETF inflows absorb the sell-off and sustain the cycle’s progress.
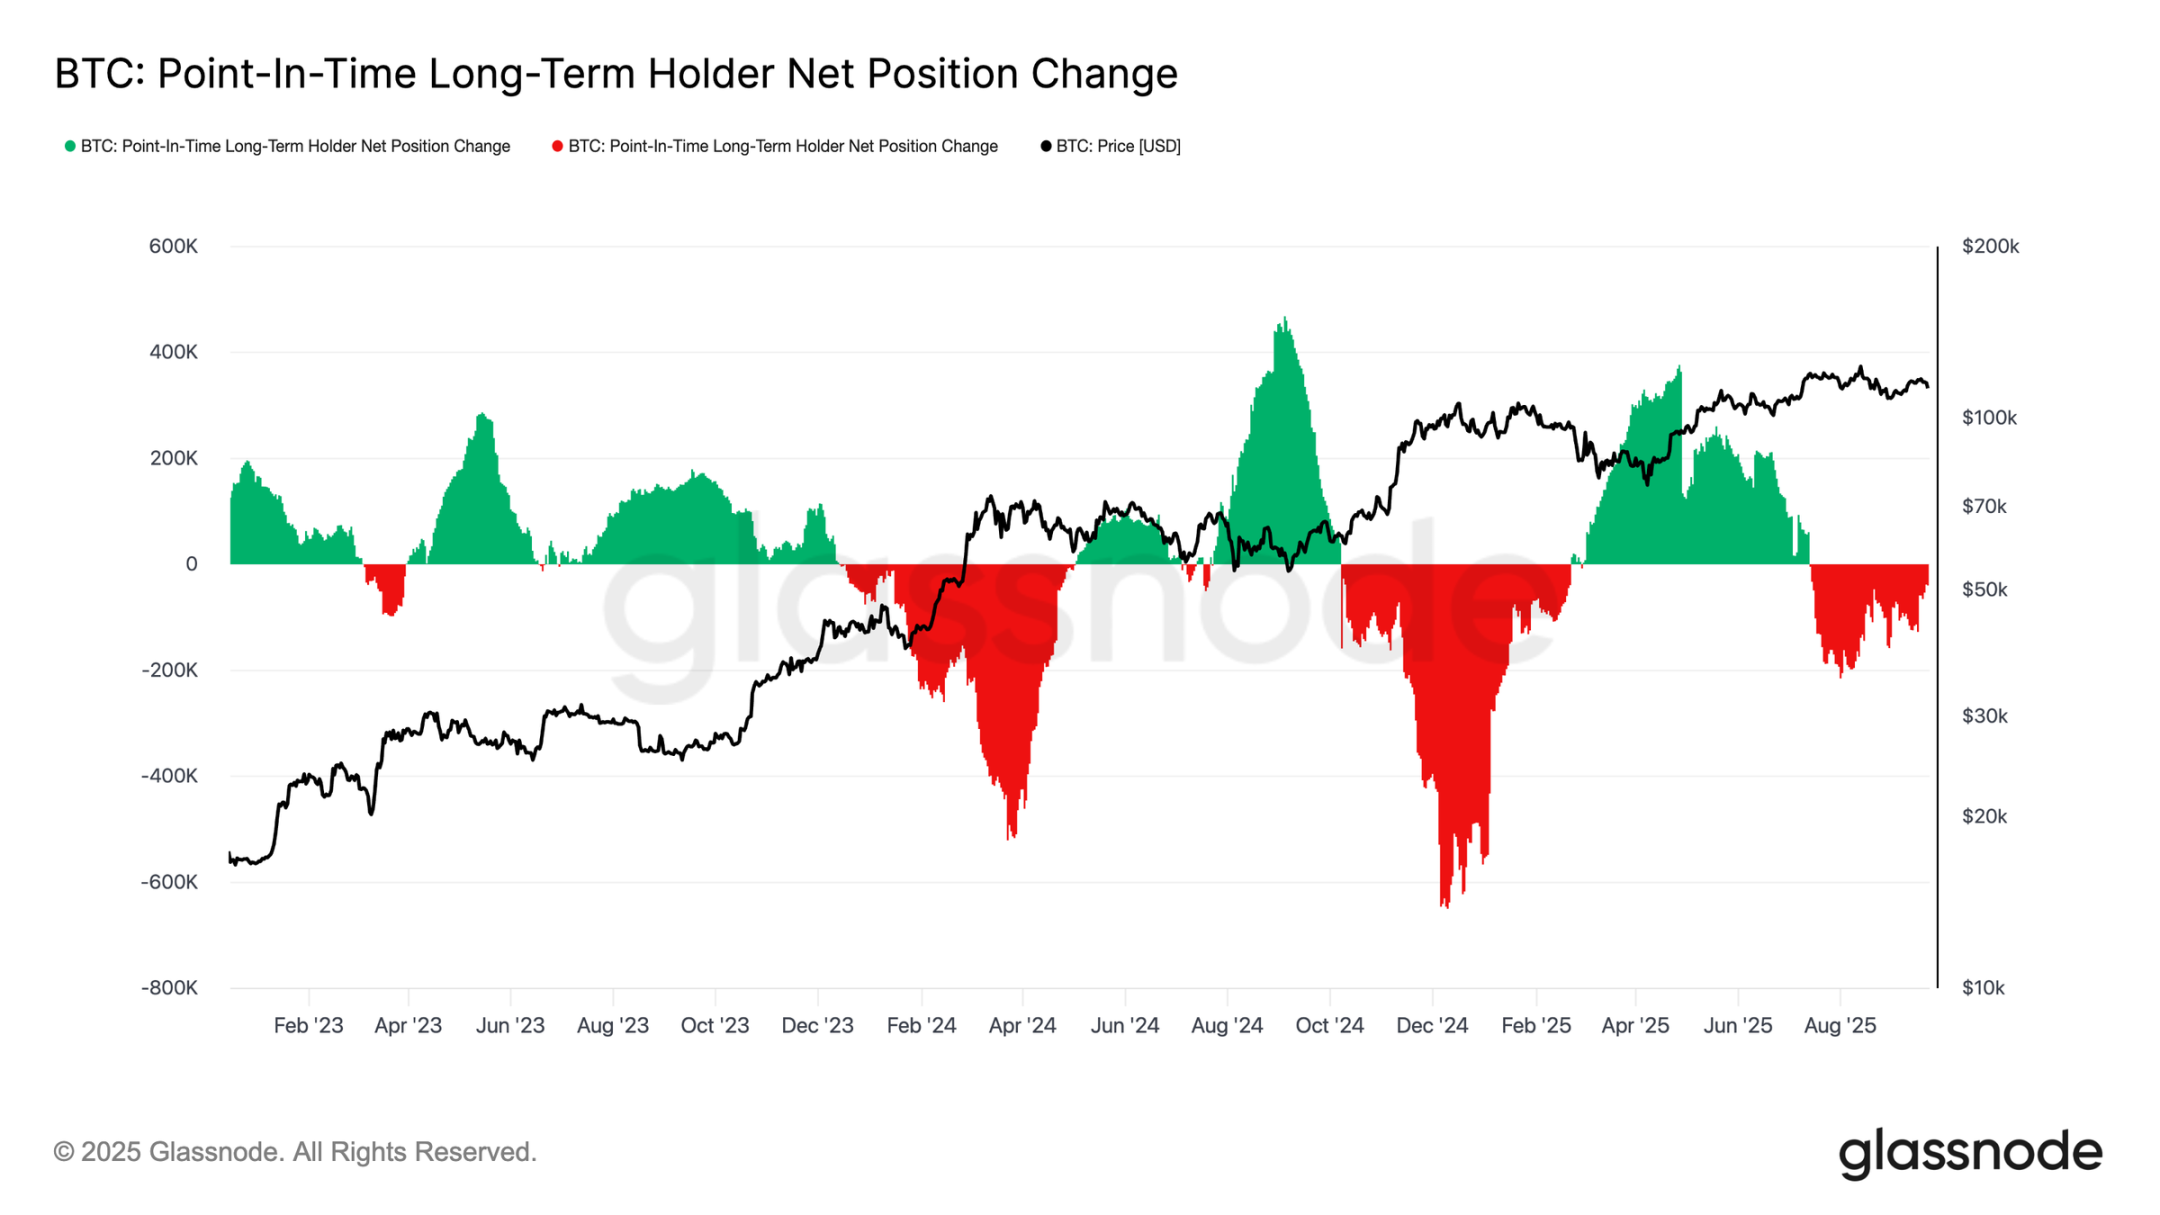
fragile balance
ETF inflows have so far balanced long-term holder selling, but with a narrow margin of error. Around the time of the FOMC meeting, long-term holder selling surged to 122,000 BTC/month, while net ETF inflows plummeted from 2,600 BTC/day to near zero. The combination of increased selling pressure and weakening institutional demand creates a fragile backdrop, setting the stage for weakness.
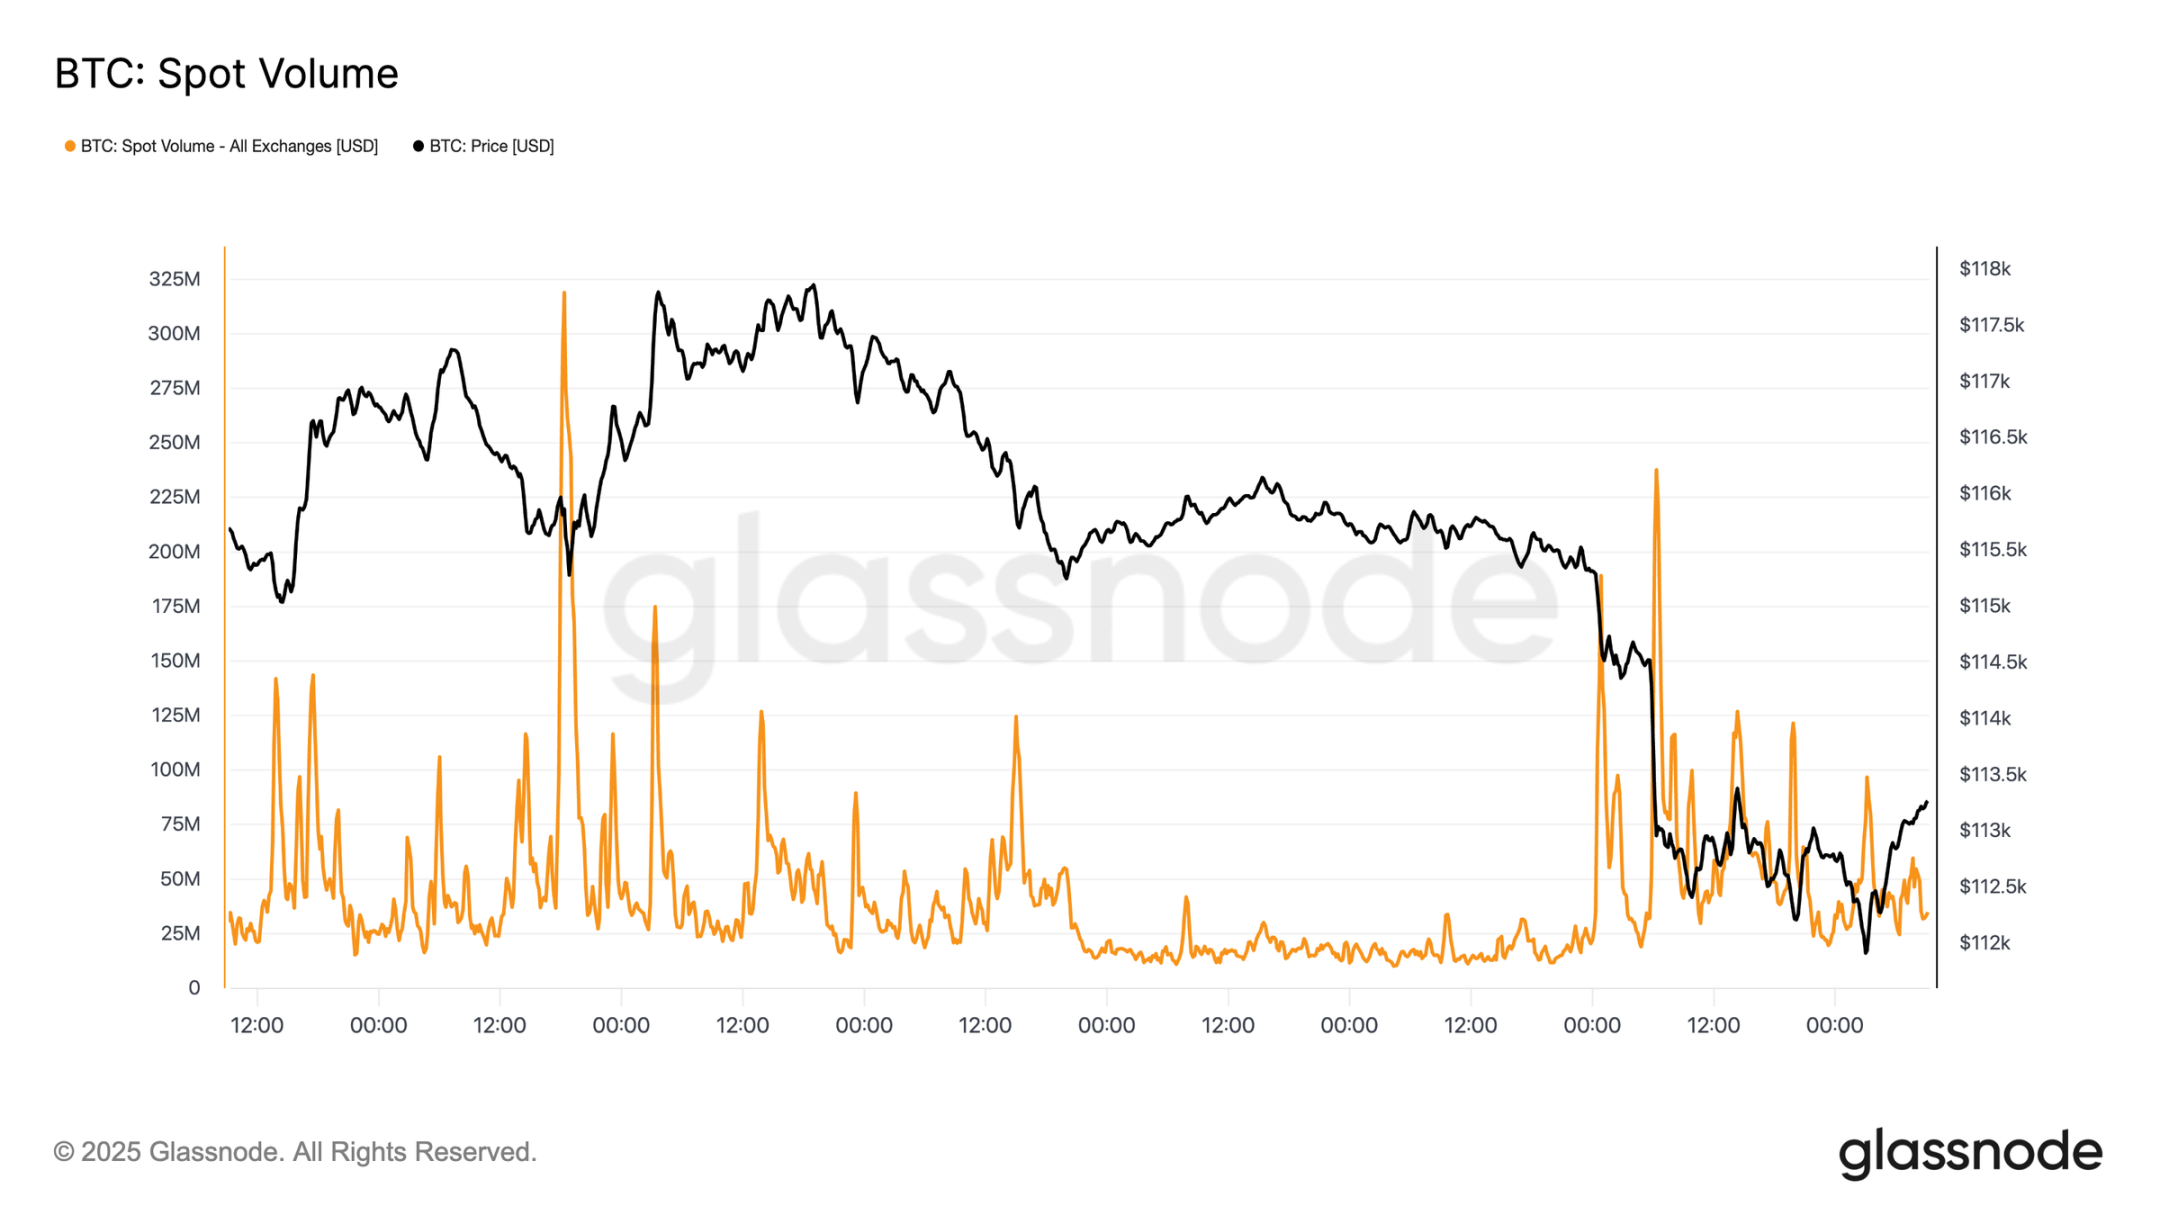
Spot market pressure
This fragility was evident in the spot market. Volume surged during the post-FOMC sell-off as forced liquidations and thin liquidity amplified the decline. While painful, a temporary bottom formed around $111,800, the cost basis for short-term holders.
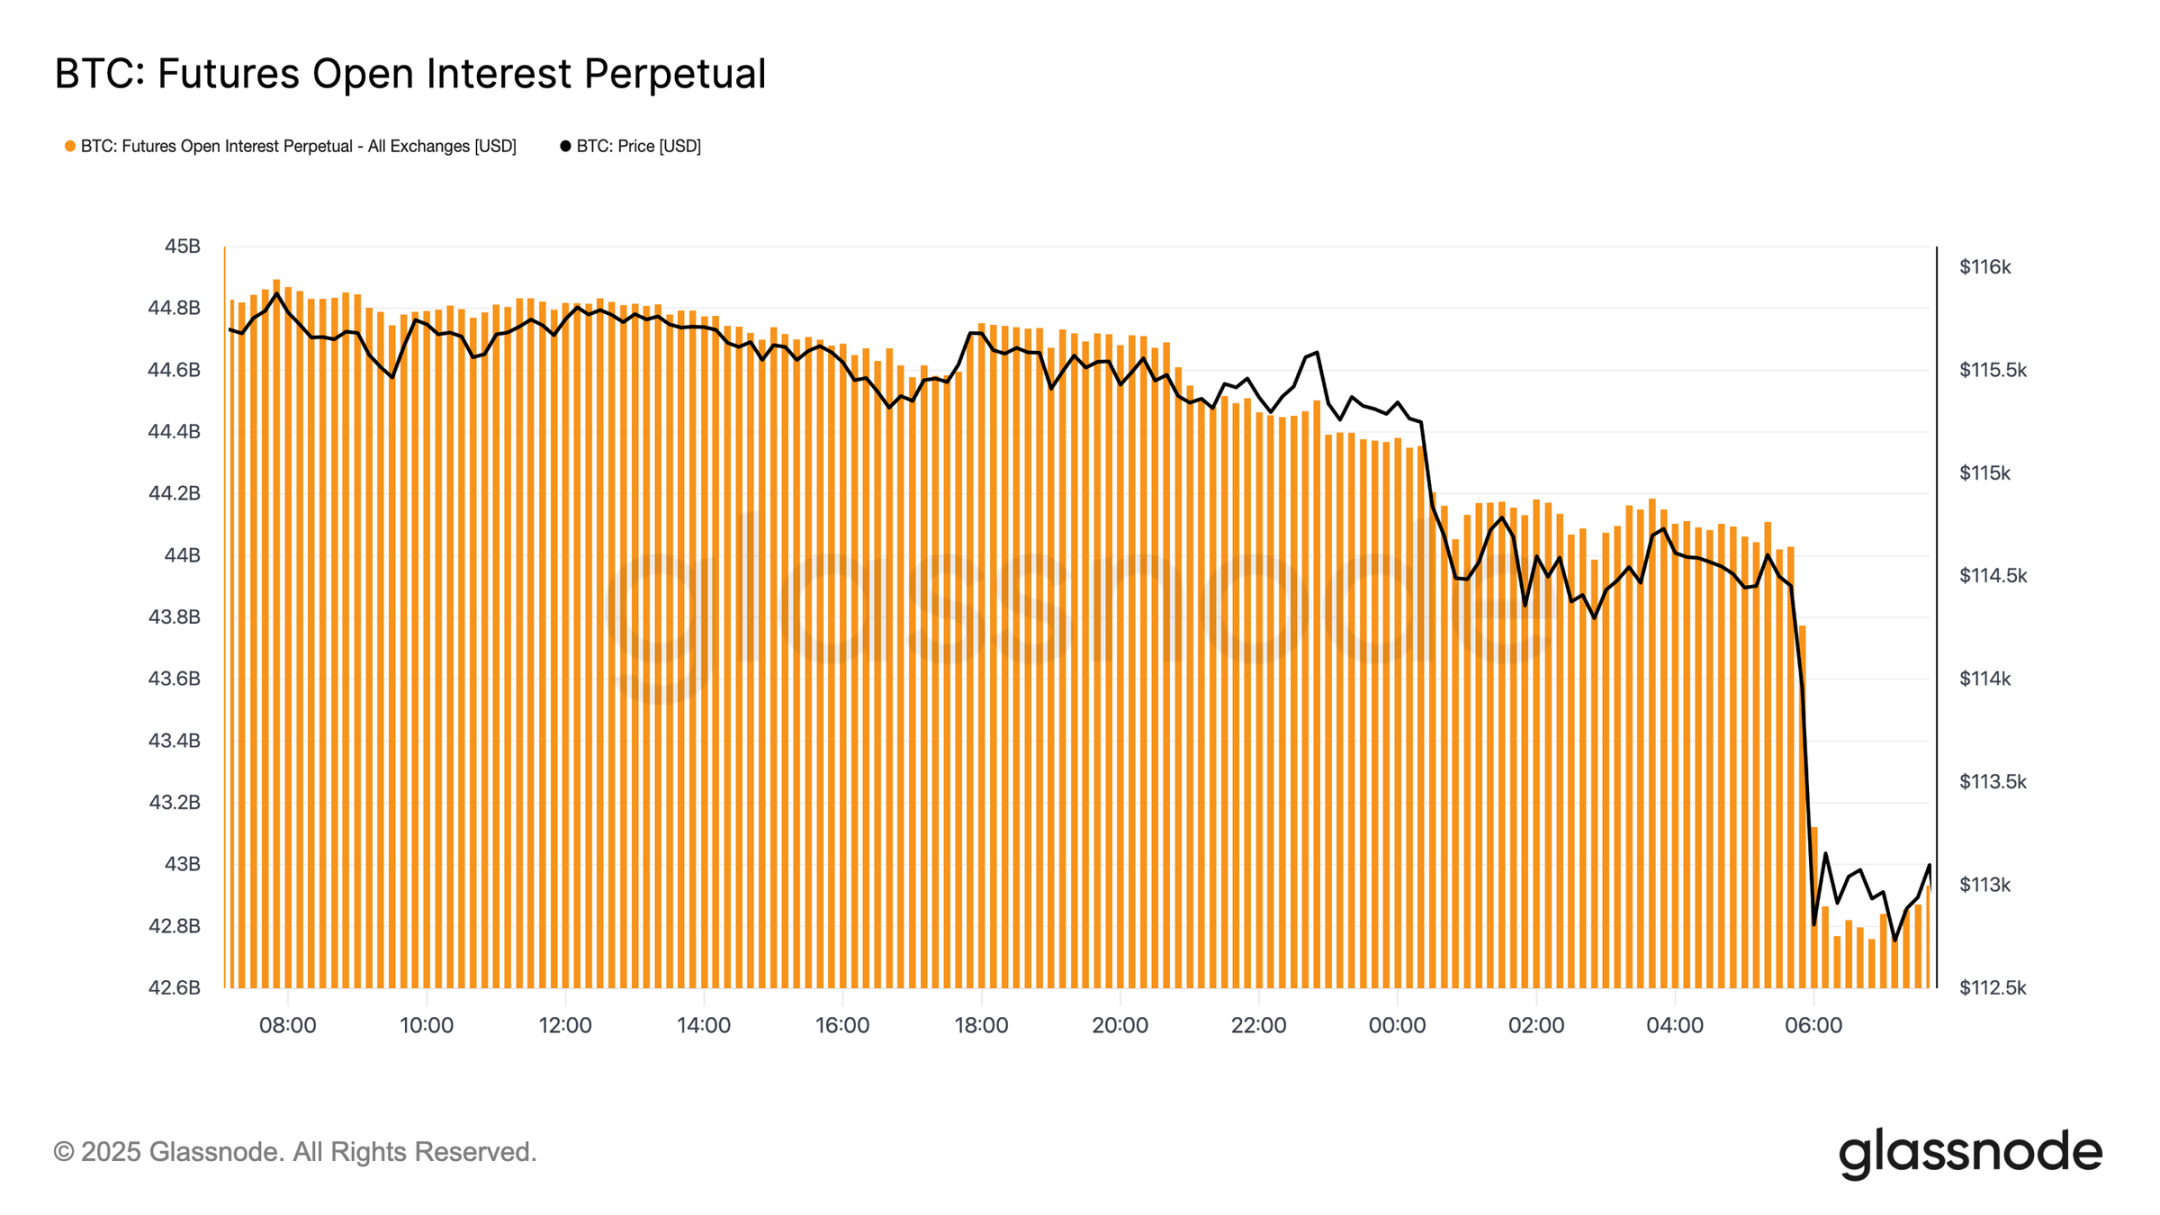
Futures Deleveraging
Meanwhile, as Bitcoin fell below $113,000, futures open interest plummeted from $44.8 billion to $42.7 billion. This deleveraging event cleared out leveraged longs, amplifying downward pressure. While causing immediate instability, this reset will help clear excess leverage and restore balance to the derivatives market.
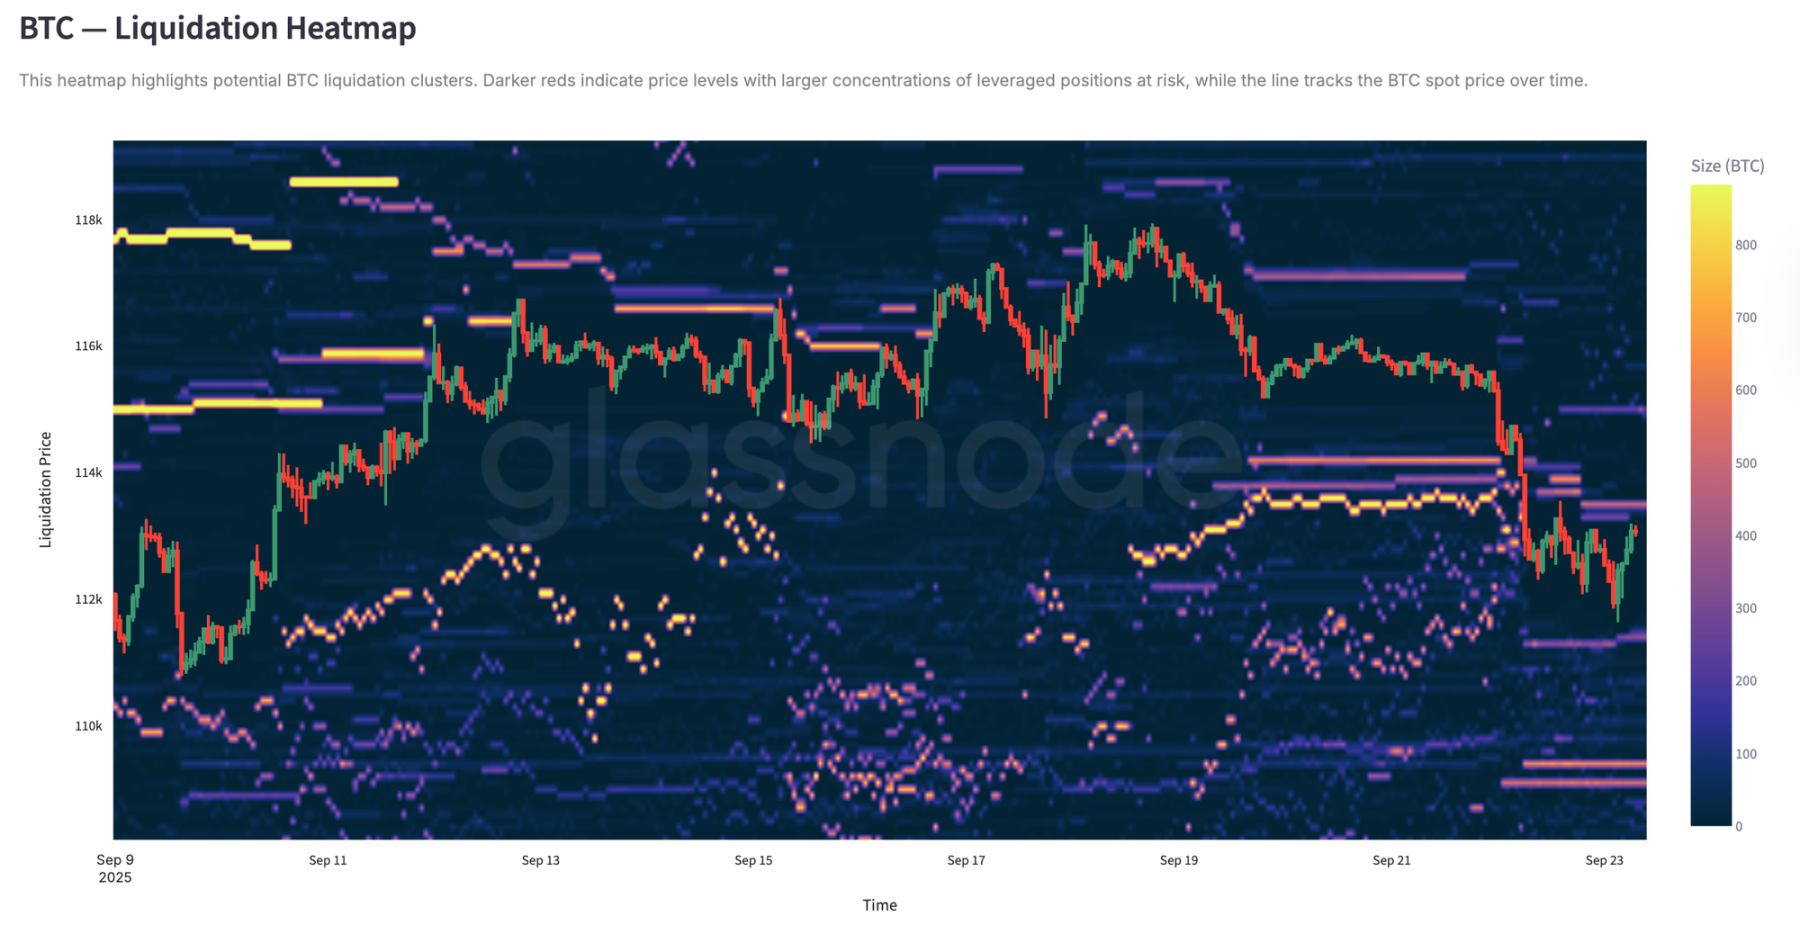
Liquidation Cluster
The perpetual swap liquidation heatmap provides further detail. When prices fell below the $114,000-$112,000 range, dense clusters of leveraged long positions were cleared, leading to significant liquidations and accelerating the decline. Risk pockets still exist above $117,000, leaving the market vulnerable to liquidity-driven volatility in both directions. In the absence of stronger demand, fragility near these levels increases the risk of further sharp moves.
options market
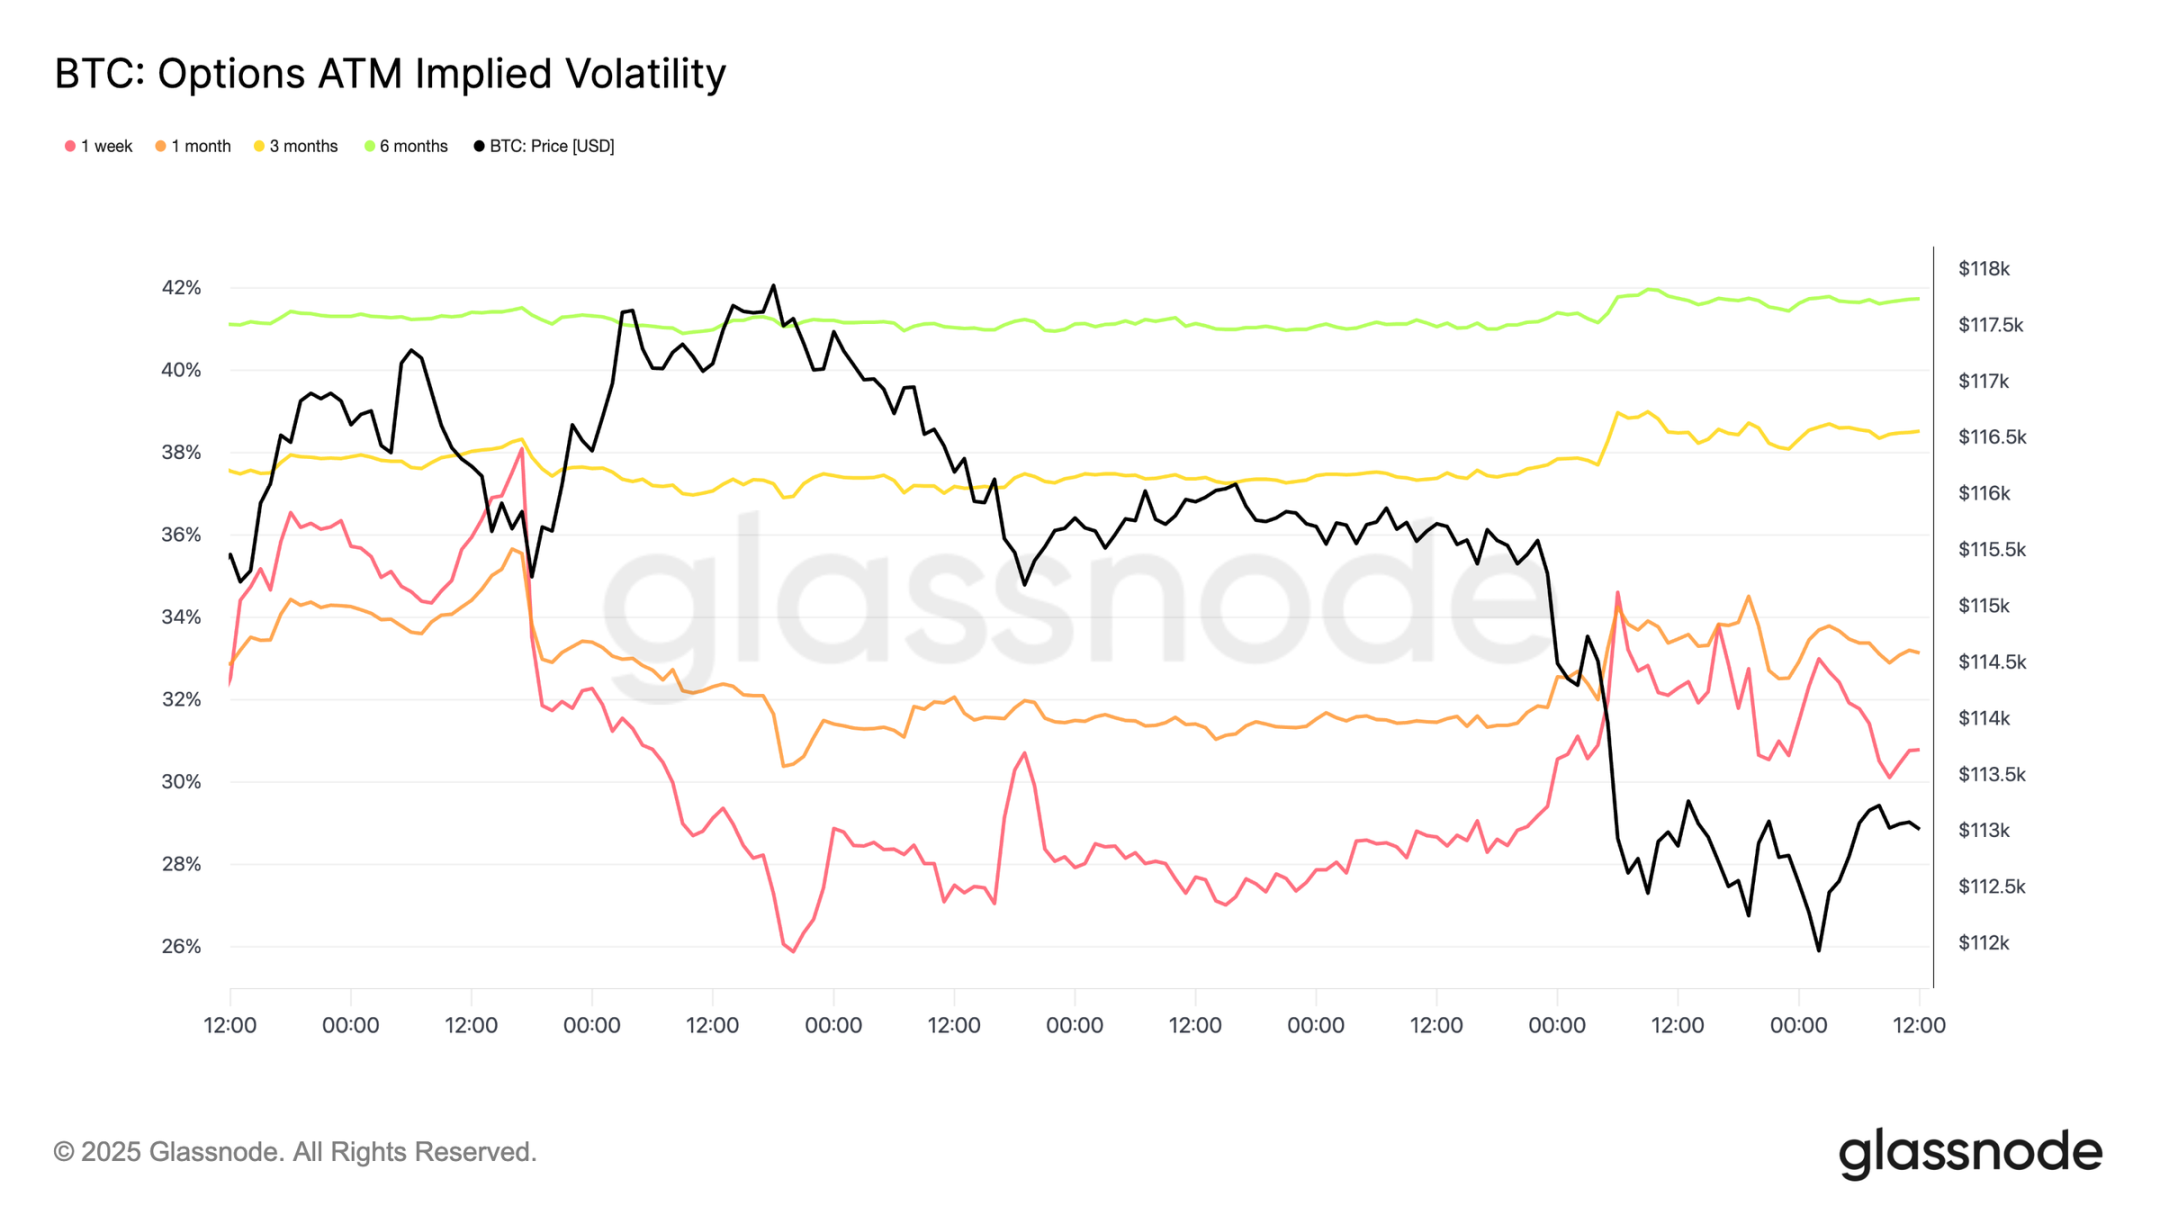
Volatility
Turning to the options market, implied volatility offers a clear perspective on how traders navigated a turbulent week. Two key catalysts shaped the market: the first rate cut of the year and the largest liquidation event since 2021. Volatility climbed ahead of the FOMC meeting as hedging demand built, but quickly receded after the rate cut was confirmed, indicating that the move was largely priced in. However, dramatic liquidations in futures on Sunday evening reignited demand for protection, with one-week implied volatility leading the rebound, and the strength extended across all maturities.
Markets re-pricing rate cuts
Following the FOMC meeting, there was aggressive demand for put options, either as protection against a sharp decline or as a way to profit from volatility. Just two days later, the market acted on that signal with the largest liquidation event since 2021.
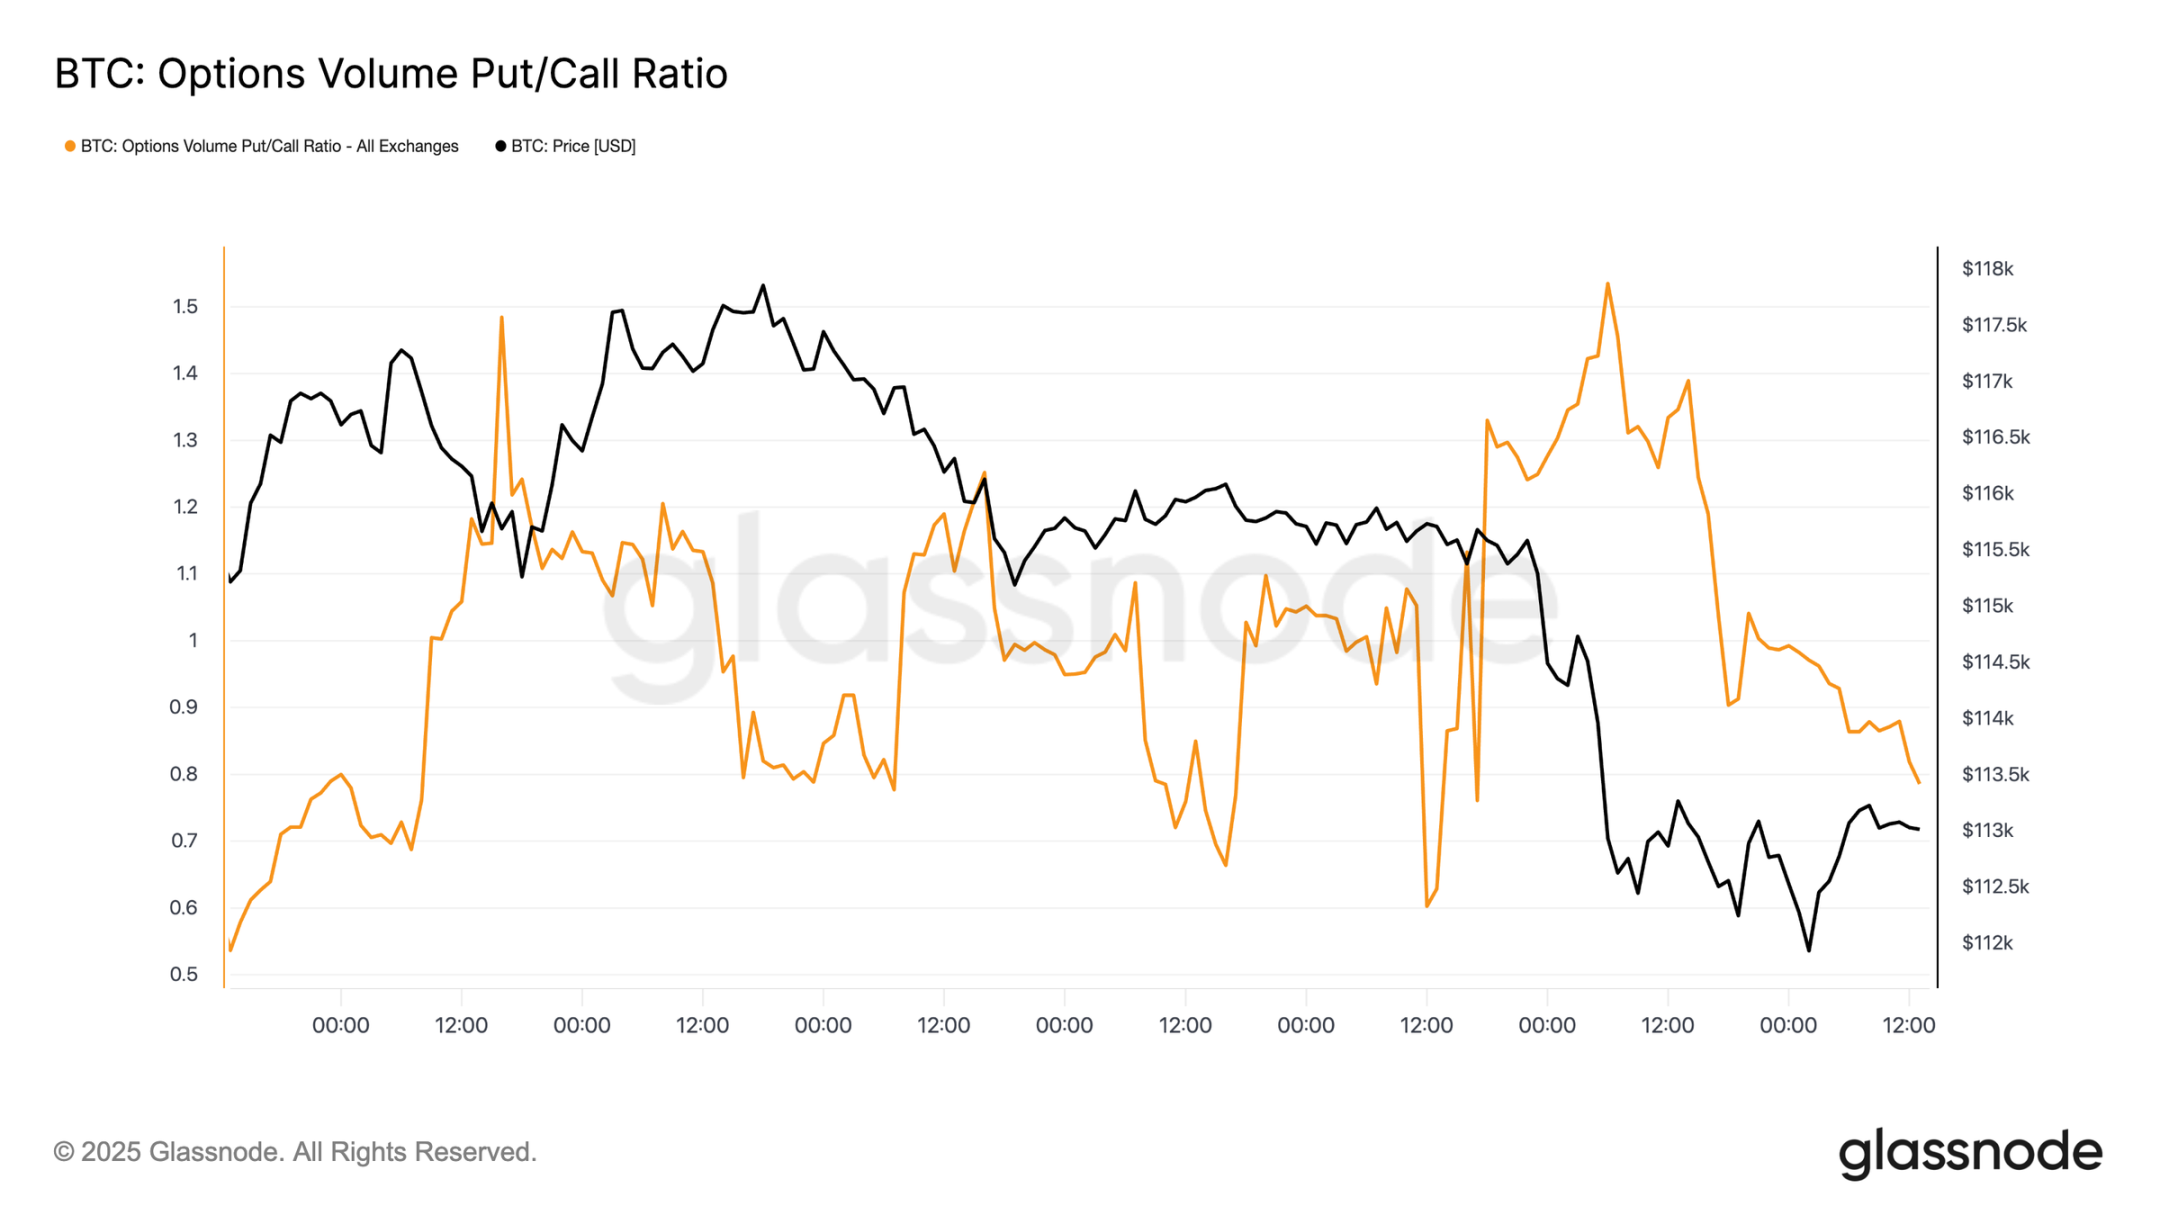
Put/Call Option Fund Flow
Following the sell-off, the put/call volume ratio has trended downward as traders locked in profits on in-the-money puts while others rotated into cheaper calls. Short- and intermediate-term options remain heavily weighted toward puts, making downside protection expensive relative to upside. This imbalance creates opportunities for participants with a constructive year-end perspective—either accumulating call options at a relatively low cost or financing them by selling expensive downside exposure.
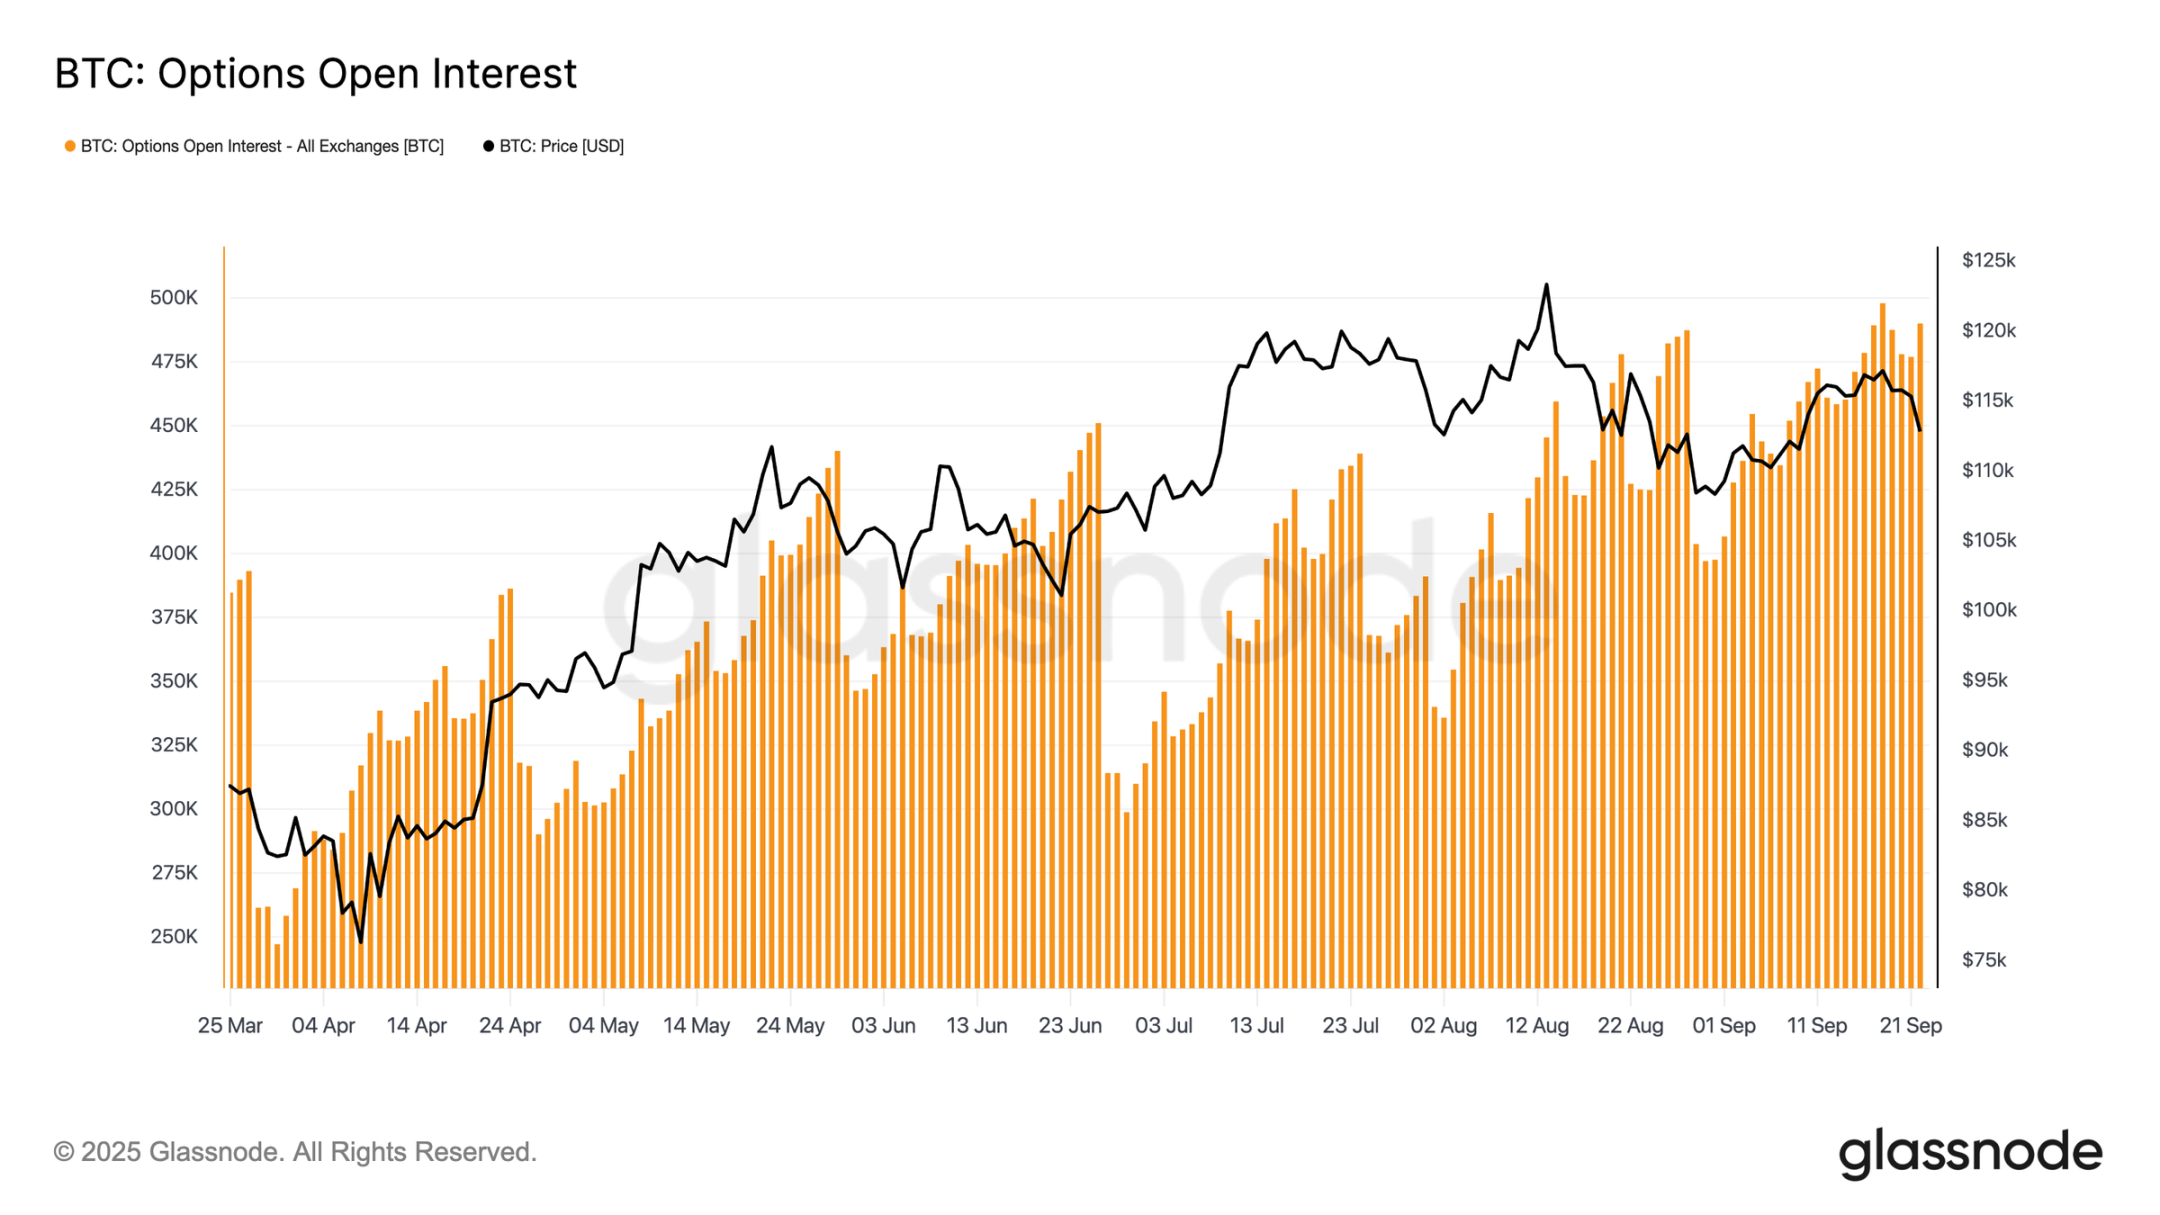
Options Open Interest
Aggregate open interest in options is hovering near all-time highs and is expected to decline sharply ahead of Friday morning's expiration, before re-establishing the market ahead of December. Currently, the market is in peak territory, forcing market makers to engage in aggressive hedging even on minor price fluctuations. Market makers are short on the downside and long on the upside, a structure that amplifies sell-offs while limiting rallies. This dynamic skews near-term volatility risk to the downside, exacerbating vulnerabilities until expiration clears and positions are reset.
in conclusion
Bitcoin's post-FOMC pullback reflects a classic "buy the rumor, sell the fact" pattern, but the broader context points to growing exhaustion. While the current 12% decline is mild compared to past cycles, it follows three major waves of capital inflows that boosted realized market capitalization by $678 billion, nearly double the previous cycle. Long-term holders have already realized profits of 3.4 million BTC, highlighting the significant sell-off and maturity of this rally.
Meanwhile, ETF inflows, which had previously absorbed supply, have slowed, creating a fragile equilibrium. Spot trading volumes have surged due to forced selling, futures are experiencing sharp deleveraging, and options markets are pricing in downside risk. These combined signals suggest that market momentum is running out, with liquidity-driven volatility taking hold.
Unless institutional and holder demand aligns again, the risk of a deep cooldown remains high.


