
Is the crazy copycat season really coming?
- 核心观点:比特币创新高但资本流入疲软,市场投机加剧。
- 关键要素:
- 比特币资本流入月增长率降至6%。
- 山寨币未平仓合约达602亿美元新高。
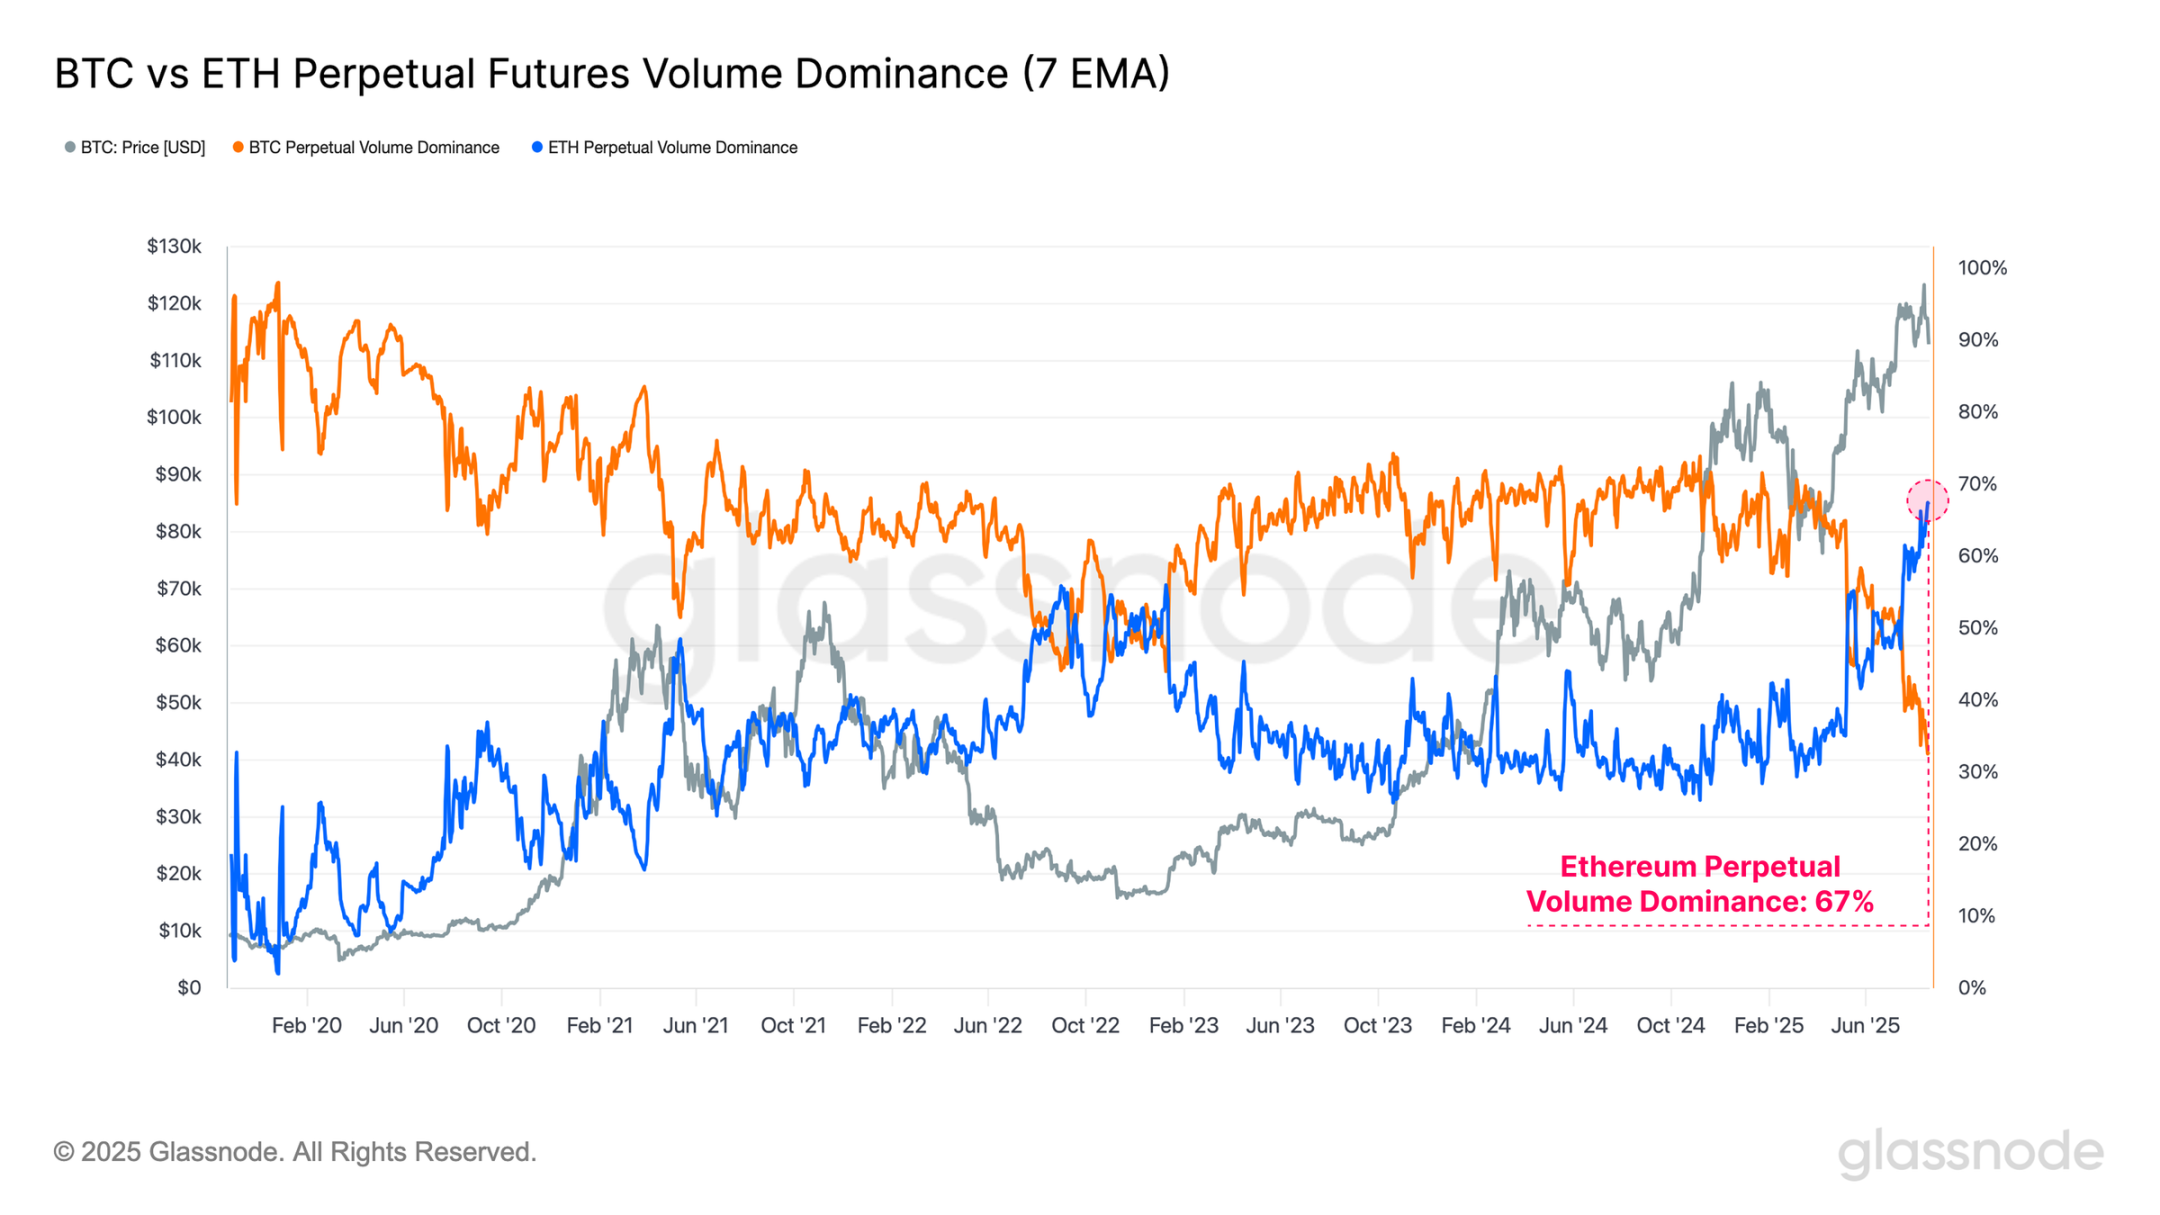
- 以太坊期货交易量主导率升至67%。
- 市场影响:杠杆升高加剧市场波动与脆弱性。
- 时效性标注:短期影响。
Original author: UkuriaOC, CryptoVizArt, Glassnode
Original translation: AididiaoJP, Foresight News
summary
Despite Bitcoin hitting a new all-time high of $124,400, its capital inflows continued to decline. This period of weak capital inflows highlights the significant weakening of investor demand at this stage.
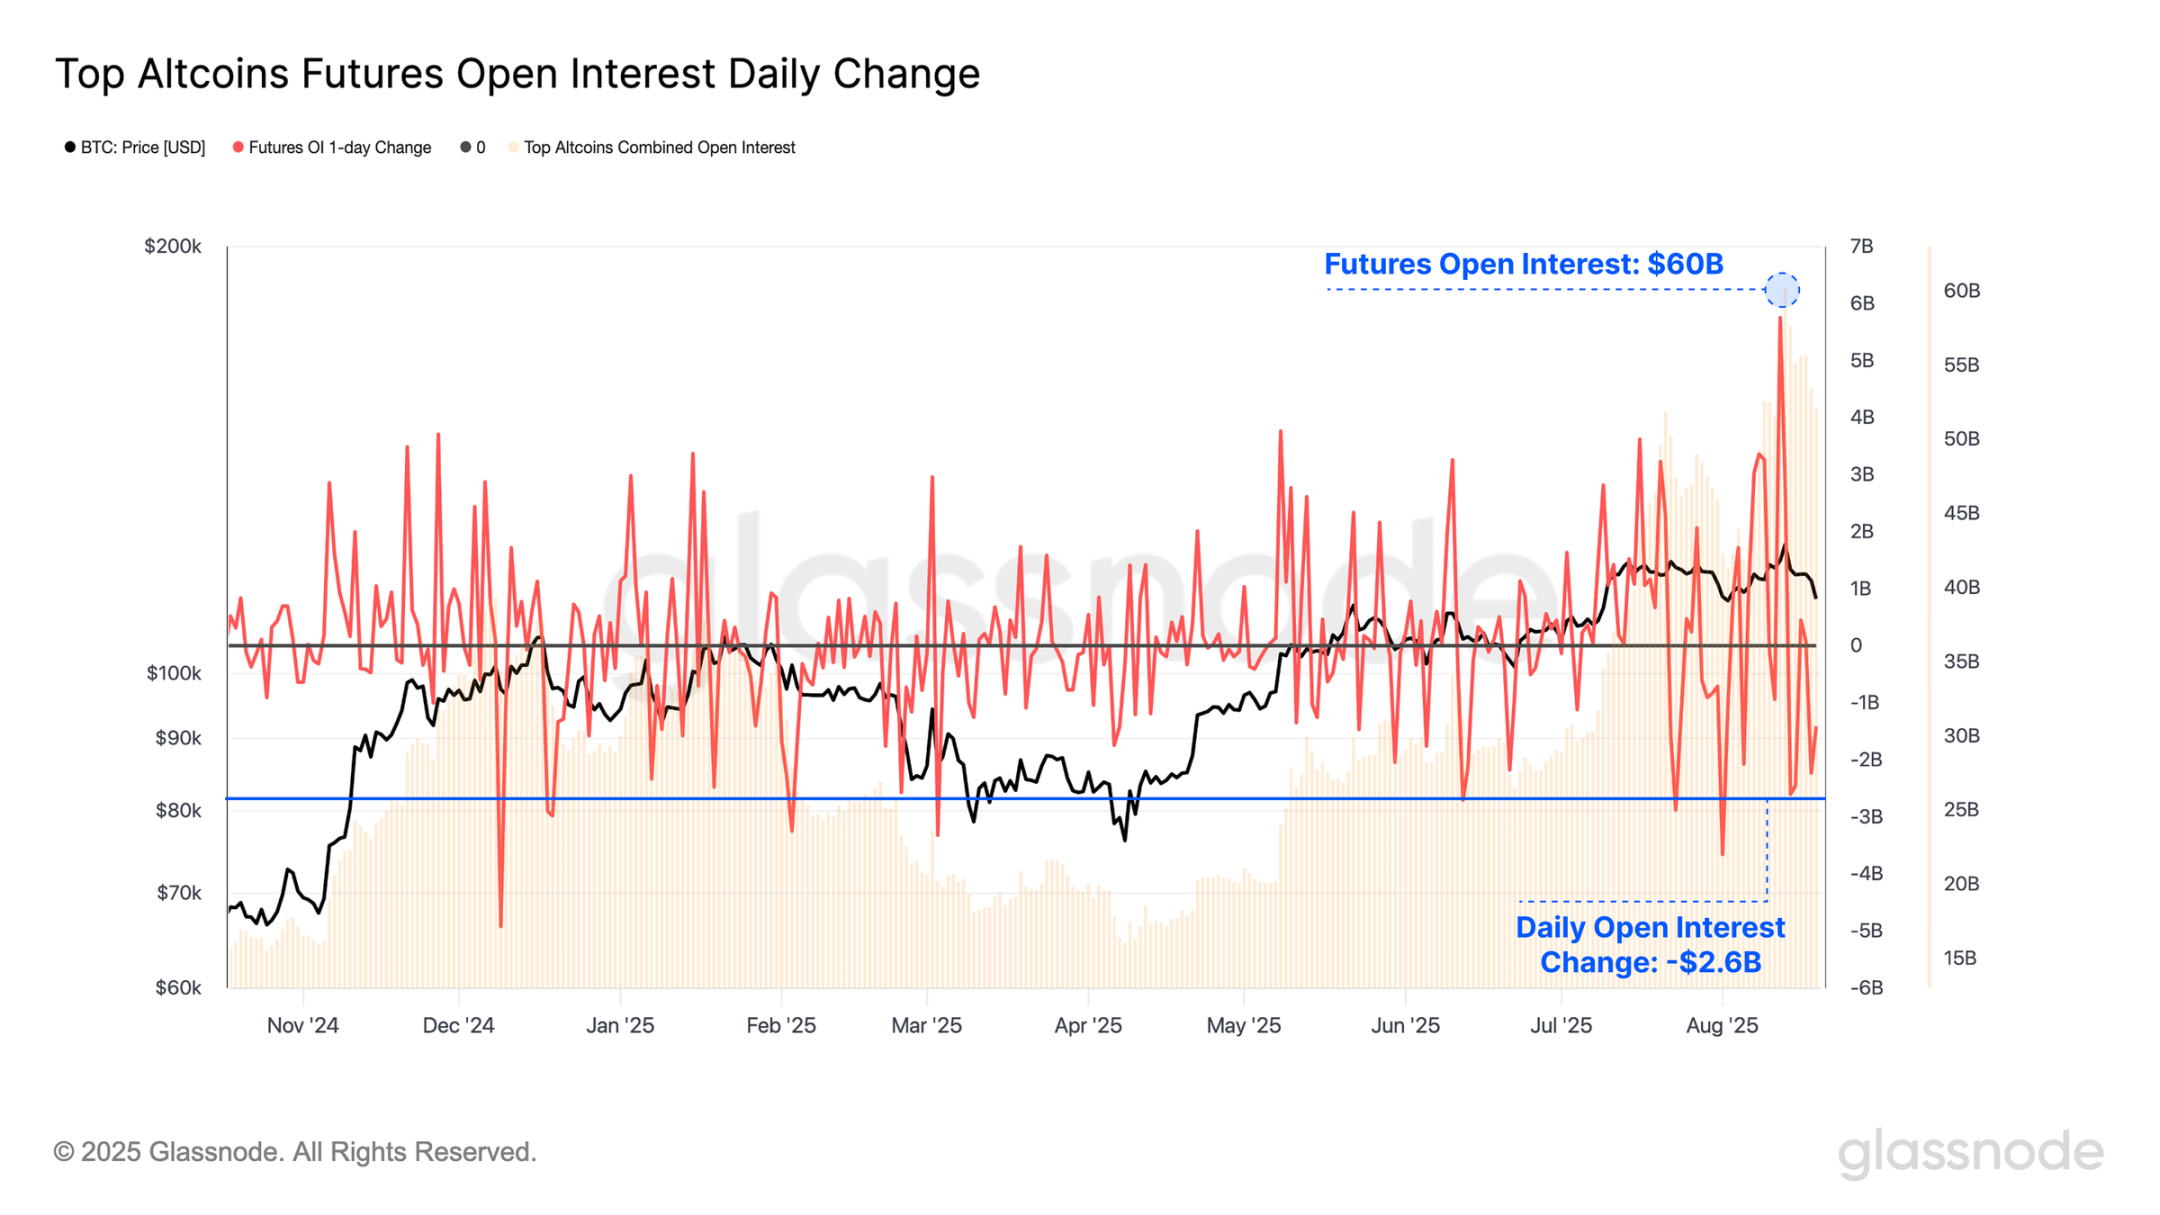
As Bitcoin prices reached their all-time highs, total open interest in major altcoins also reached an all-time high of $60 billion, highlighting the high level of leverage in the market. However, this was short-lived, as prices retreated, and open interest fell by $2.6 billion, marking the tenth largest drop on record.
Ethereum is often seen as a bellwether asset, with periods of outperformance typically correlating with broader "alt season" phases in the digital asset market. Notably, Ethereum's open interest dominance has reached its fourth-highest level on record, while its perpetual futures volume dominance has surged to a new all-time high of 67%.
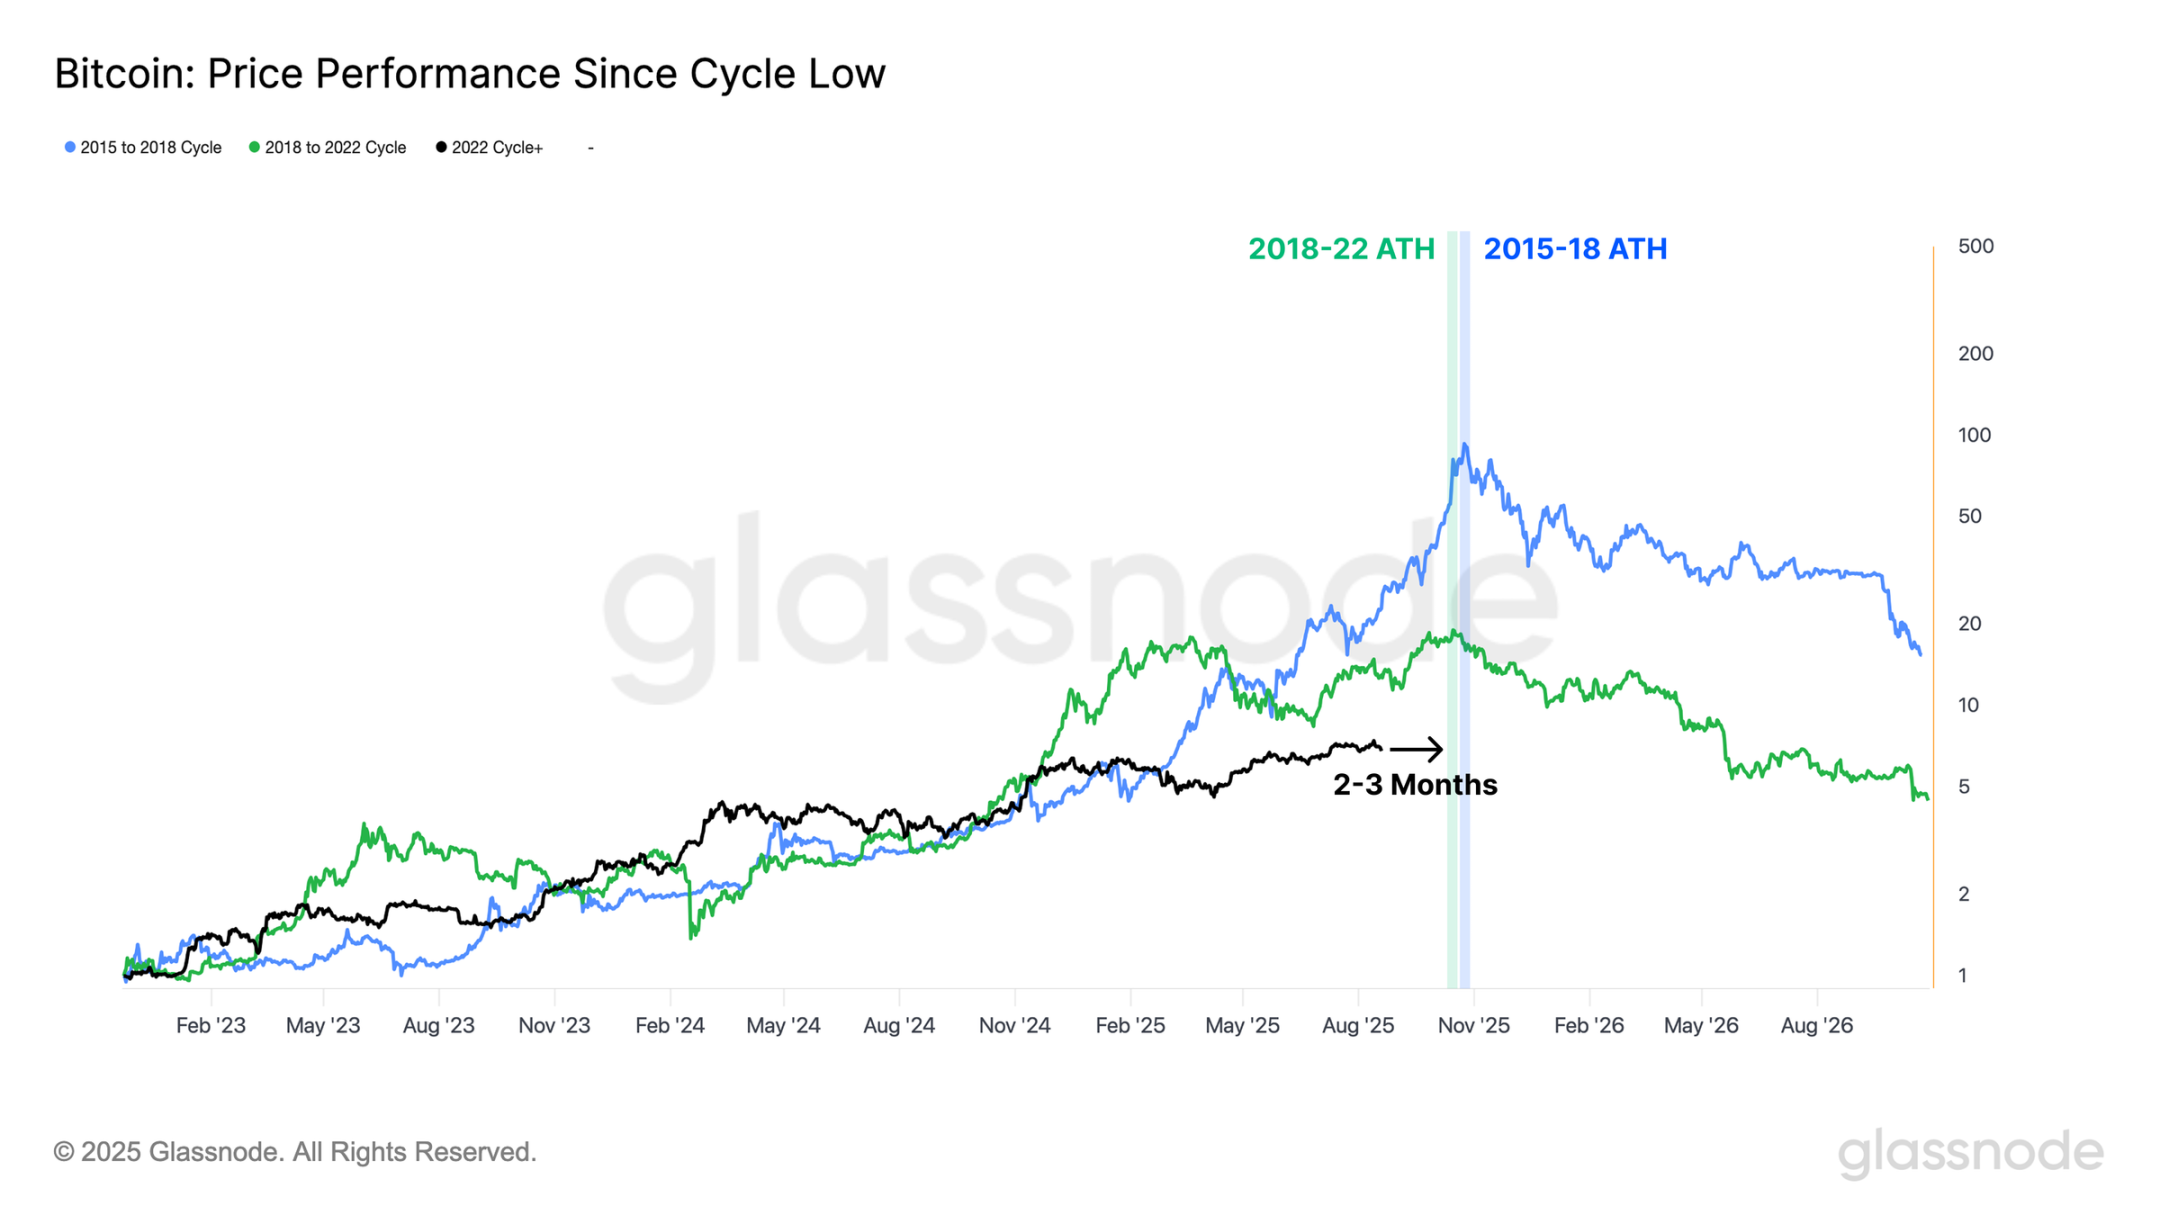
When we look at Bitcoin’s performance from the lows of each cycle, we can see that in both the 2015-2018 and 2018-2022 cycles, the all-time highs were reached approximately 2-3 months later than where we are in the current cycle, in relative terms.
Capital flows slow
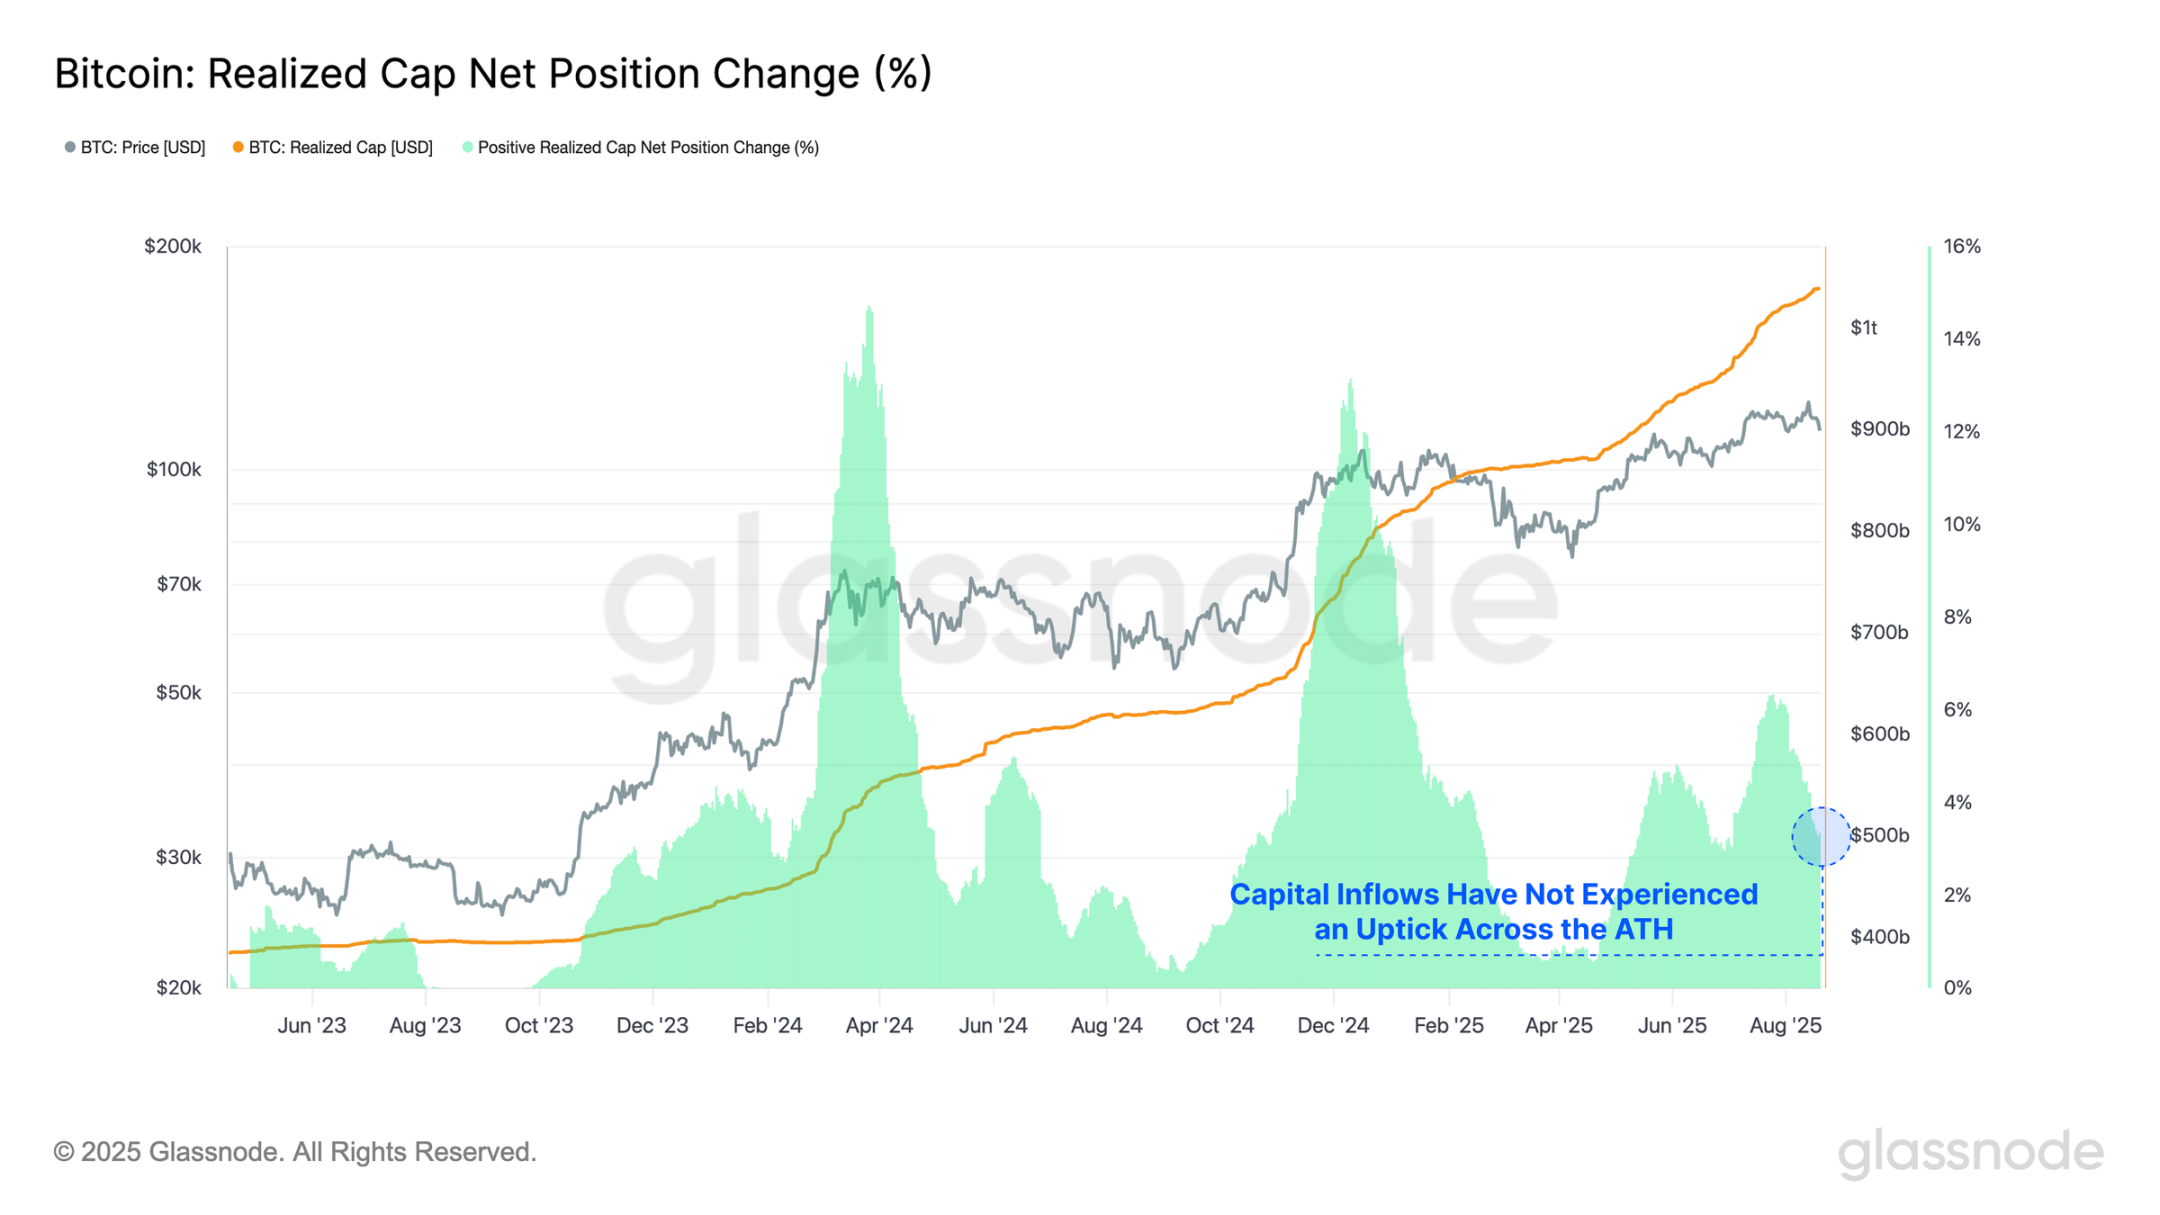
After hitting a high of $124,400 last week, Bitcoin's upward momentum has stalled, with the price retreating to a low of $112,900, a correction of nearly 9.2%. This decline comes alongside noticeably weak capital inflows in recent weeks, suggesting investors are reluctant to inject new funds at these high prices.
When we compare the current rate of capital inflow to previous all-time highs, we see that the percentage increase in realized market capitalization is much lower than the all-time highs seen in March and December 2024. The first breakout above $100,000 in late 2024 saw a monthly realized market capitalization growth rate of +13%, while the current environment peaked at a much lower +6%/month.
This period of relatively weak capital inflows highlights the significant weakening of investor demand at this stage.
Real-time charts
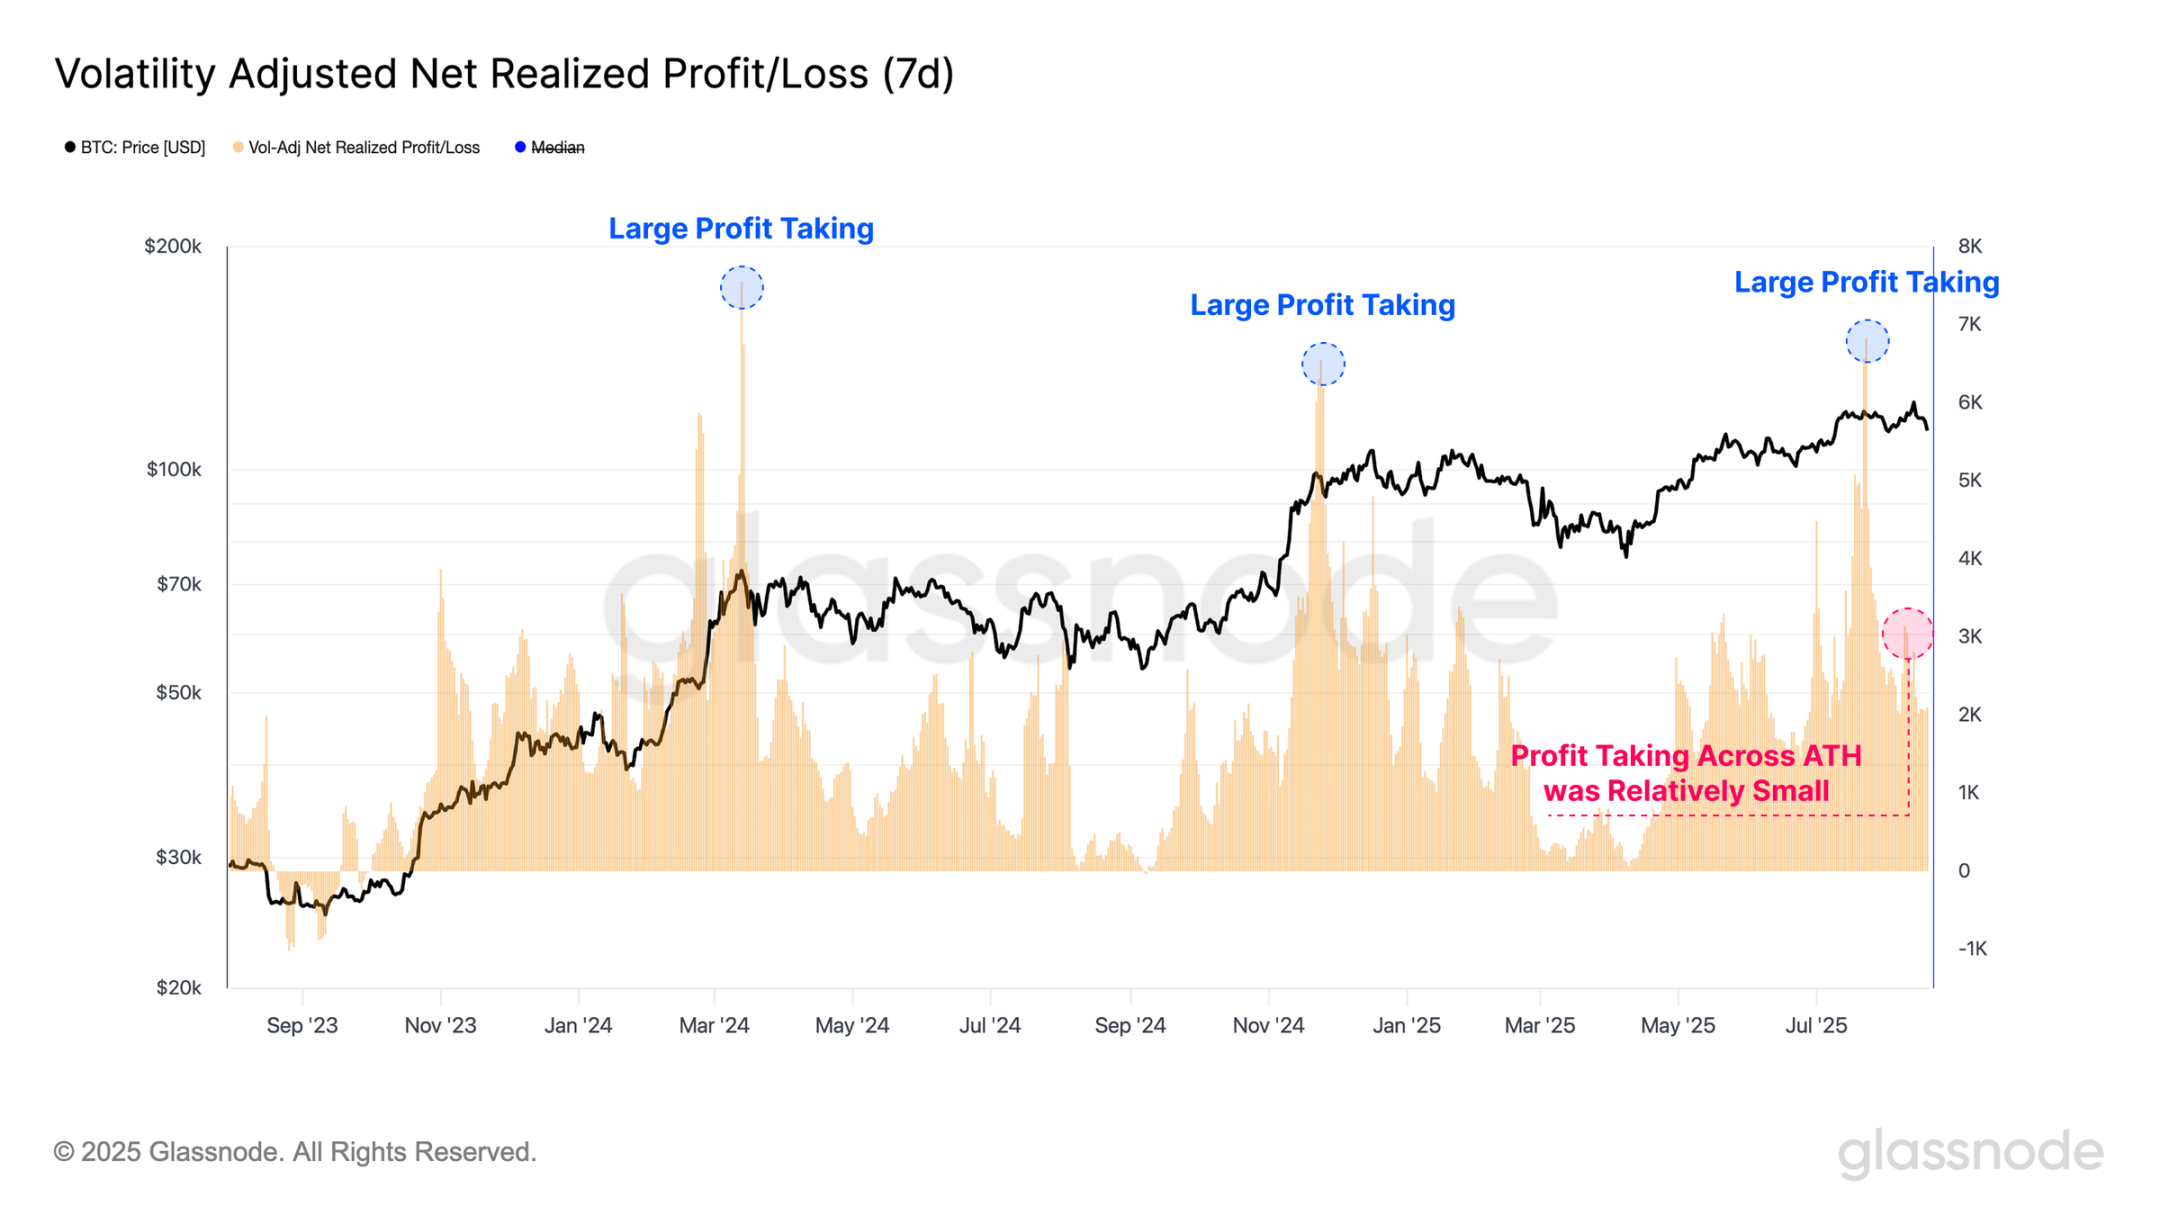
Profit-taking activity has also declined in recent weeks, as can be observed using the volatility-adjusted net realized profit/loss metric. This tool measures realized profits and losses in Bitcoin (BTC) units and normalizes them based on Bitcoin's increasing market value over different cycles. It is further refined by adjusting for 7-day realized volatility to account for diminishing returns and slowing growth rates as Bitcoin matures.
Notably, we can observe three large-scale profit-taking events near the breakout points of $70,000 and $100,000 in 2024, as well as near the all-time high of $122,000 reached in July of this year. These events indicate a strong desire among investors to lock in large profits, but also an equally strong demand impulse to absorb this selling supply.
In contrast, realized profit-taking declined significantly during this latest attempt at the all-time high. One explanation for this dynamic is that the market failed to sustain upward momentum despite less selling pressure from existing holders.
Real-time charts
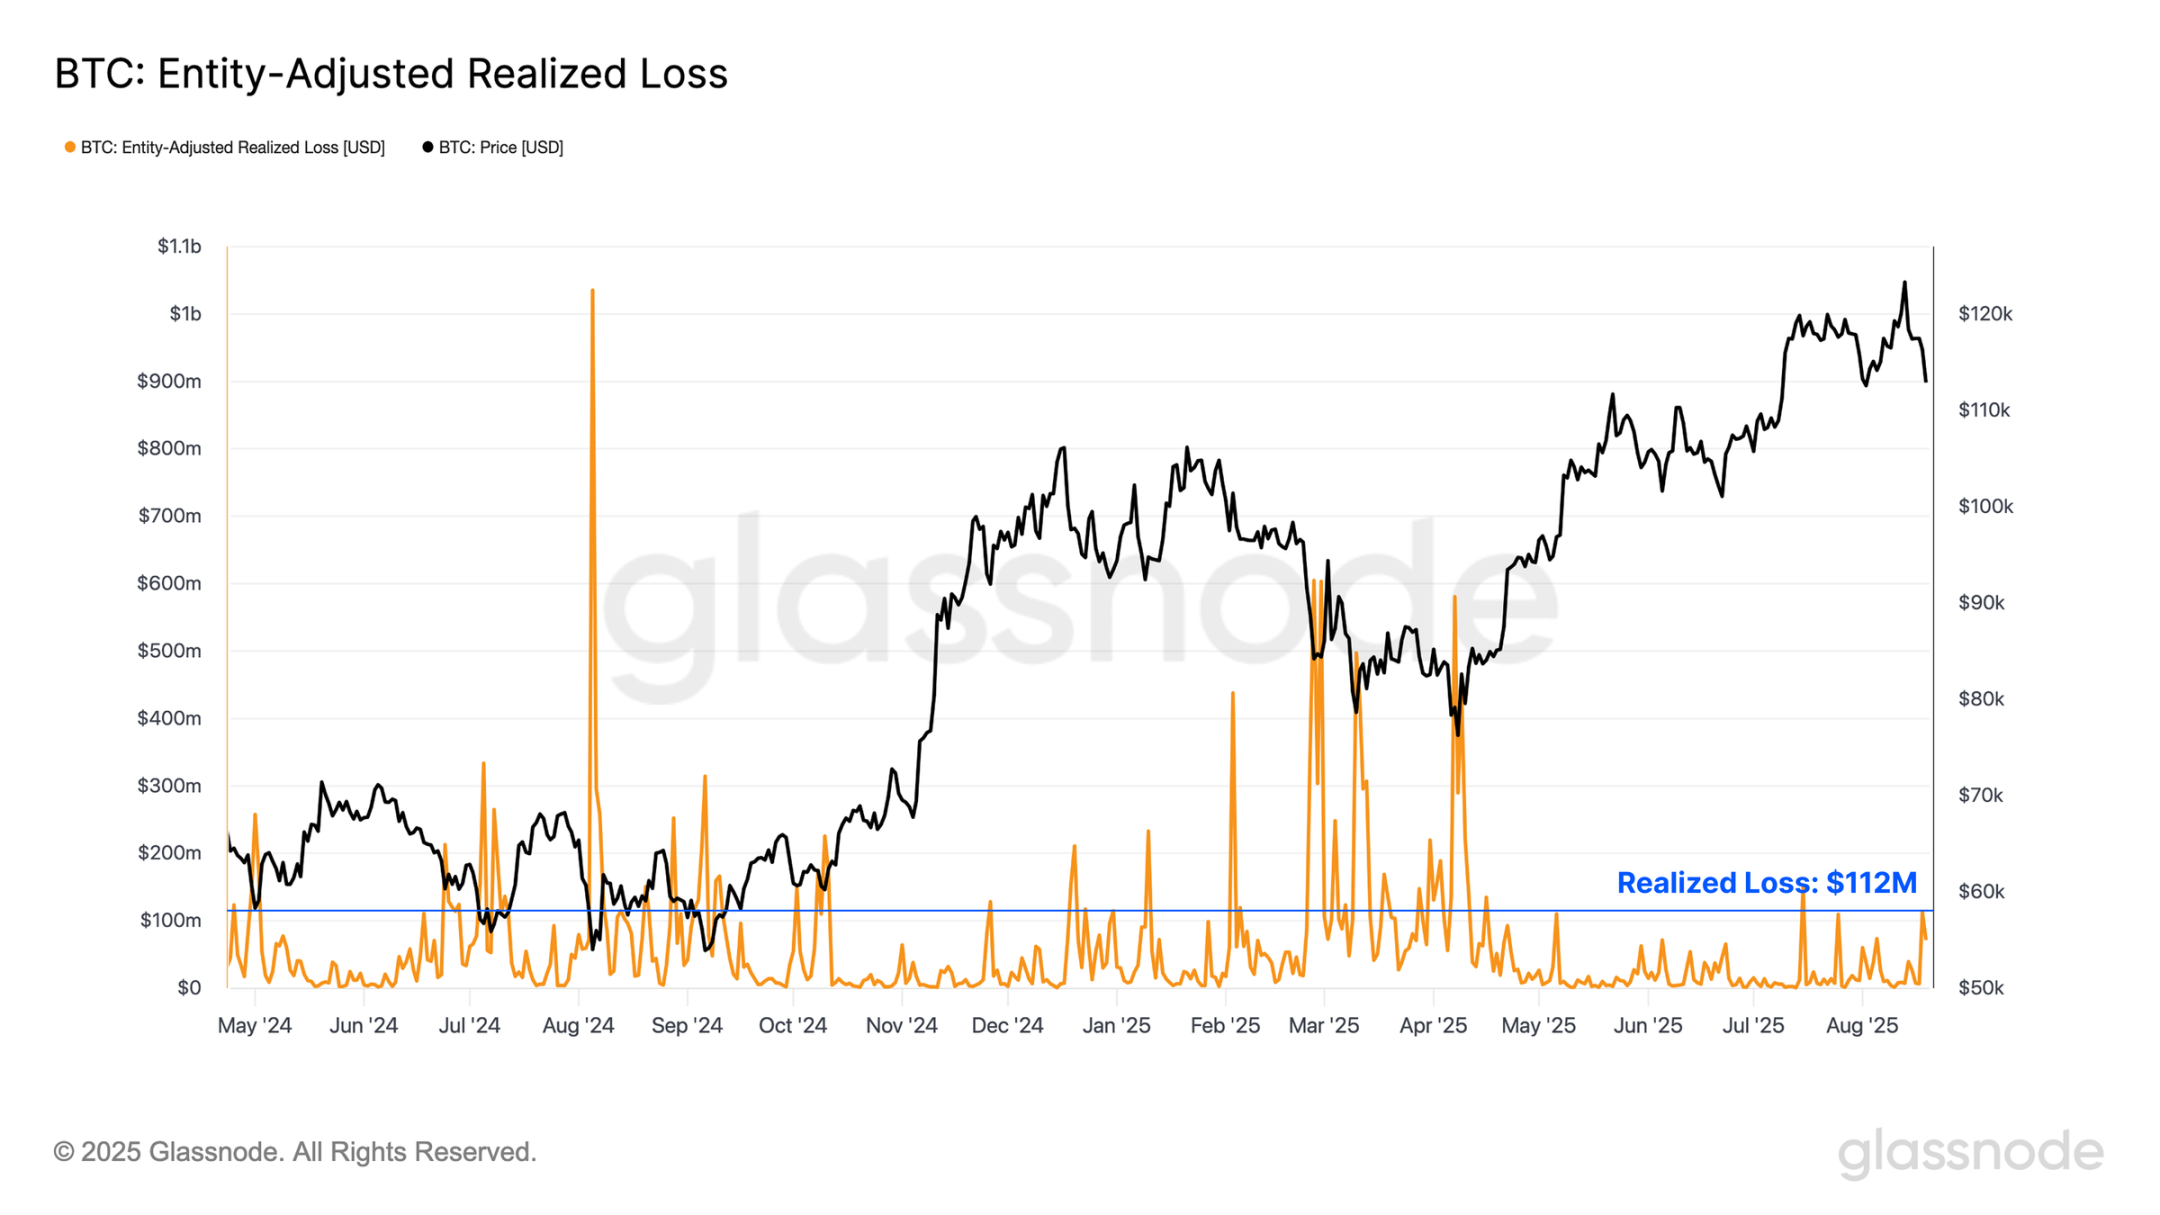
As local market momentum reversed and prices continued to decline, we turned our attention to realized loss events to assess whether there had been any significant negative shifts in investor sentiment. Investor loss realizations accelerated during this local downtrend, reaching $112 million per day.
However, this remains within the typical range seen during localized pullbacks throughout the bull cycle, with many events such as the unwinding of the yen carry trade in August 2024 and the “Trump tariff scare” of March-April 2025 leading to significantly higher capitulation volumes.
This suggests that the current downtrend has yet to materially impact investor sentiment, although mounting losses could begin to challenge that view.
Real-time charts
Leverage-driven decline
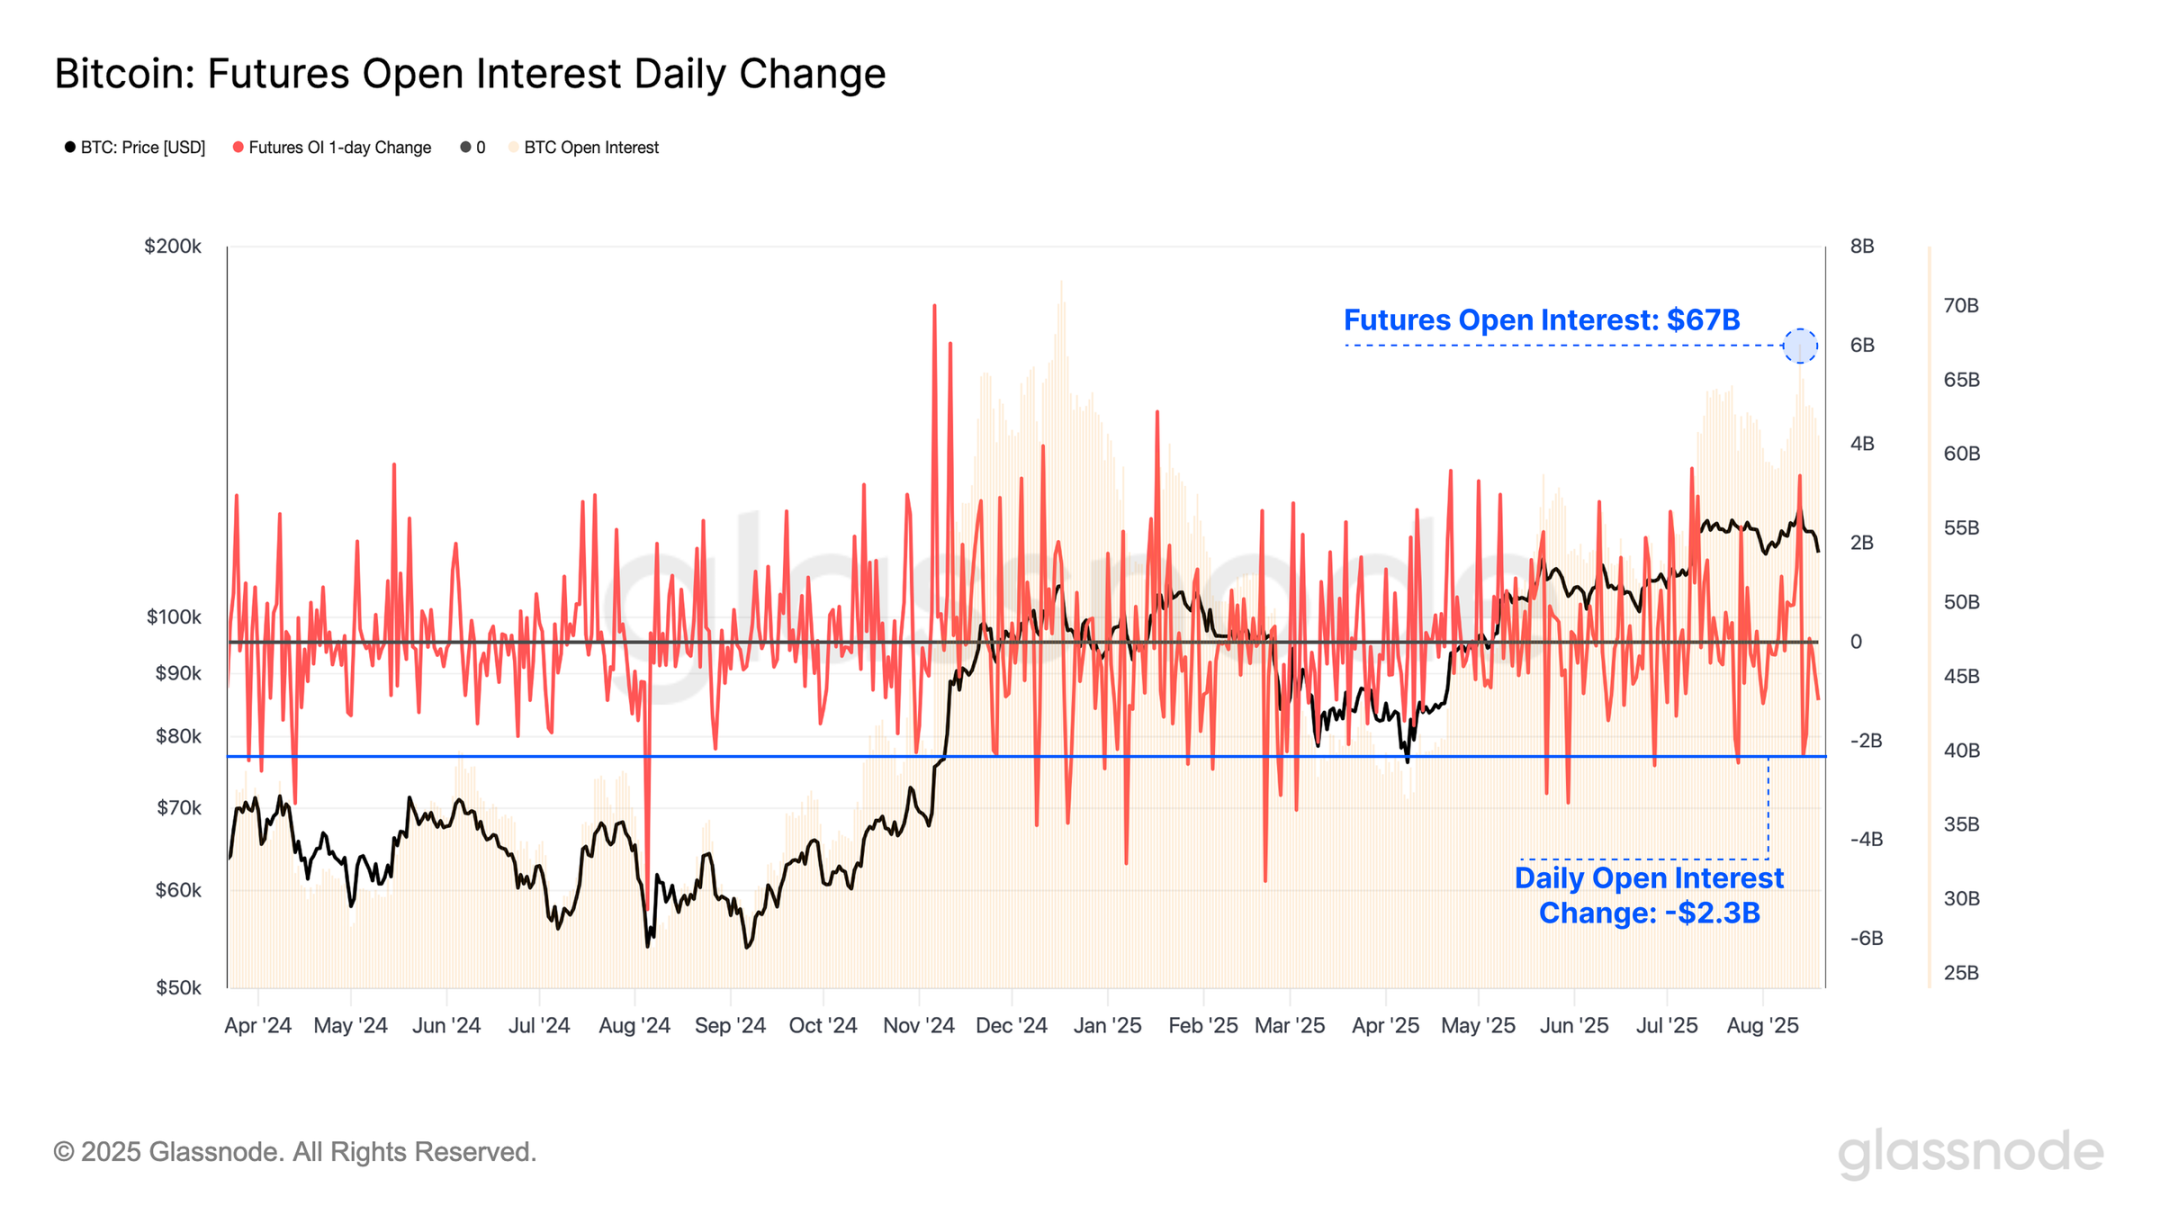
While on-chain profit and loss realizations were relatively muted during the recent all-time high and subsequent pullback, activity in the futures market has accelerated. Total open interest in Bitcoin futures contracts remains elevated at $67 billion, highlighting the high degree of leverage currently present in the market.
Notably, over $2.3 billion in open interest was liquidated during the recent sell-off, with only 23 trading days recording larger notional declines. This highlights the speculative nature of the market, where even modest price fluctuations can trigger a significant drawdown of leveraged positions.
Real-time charts
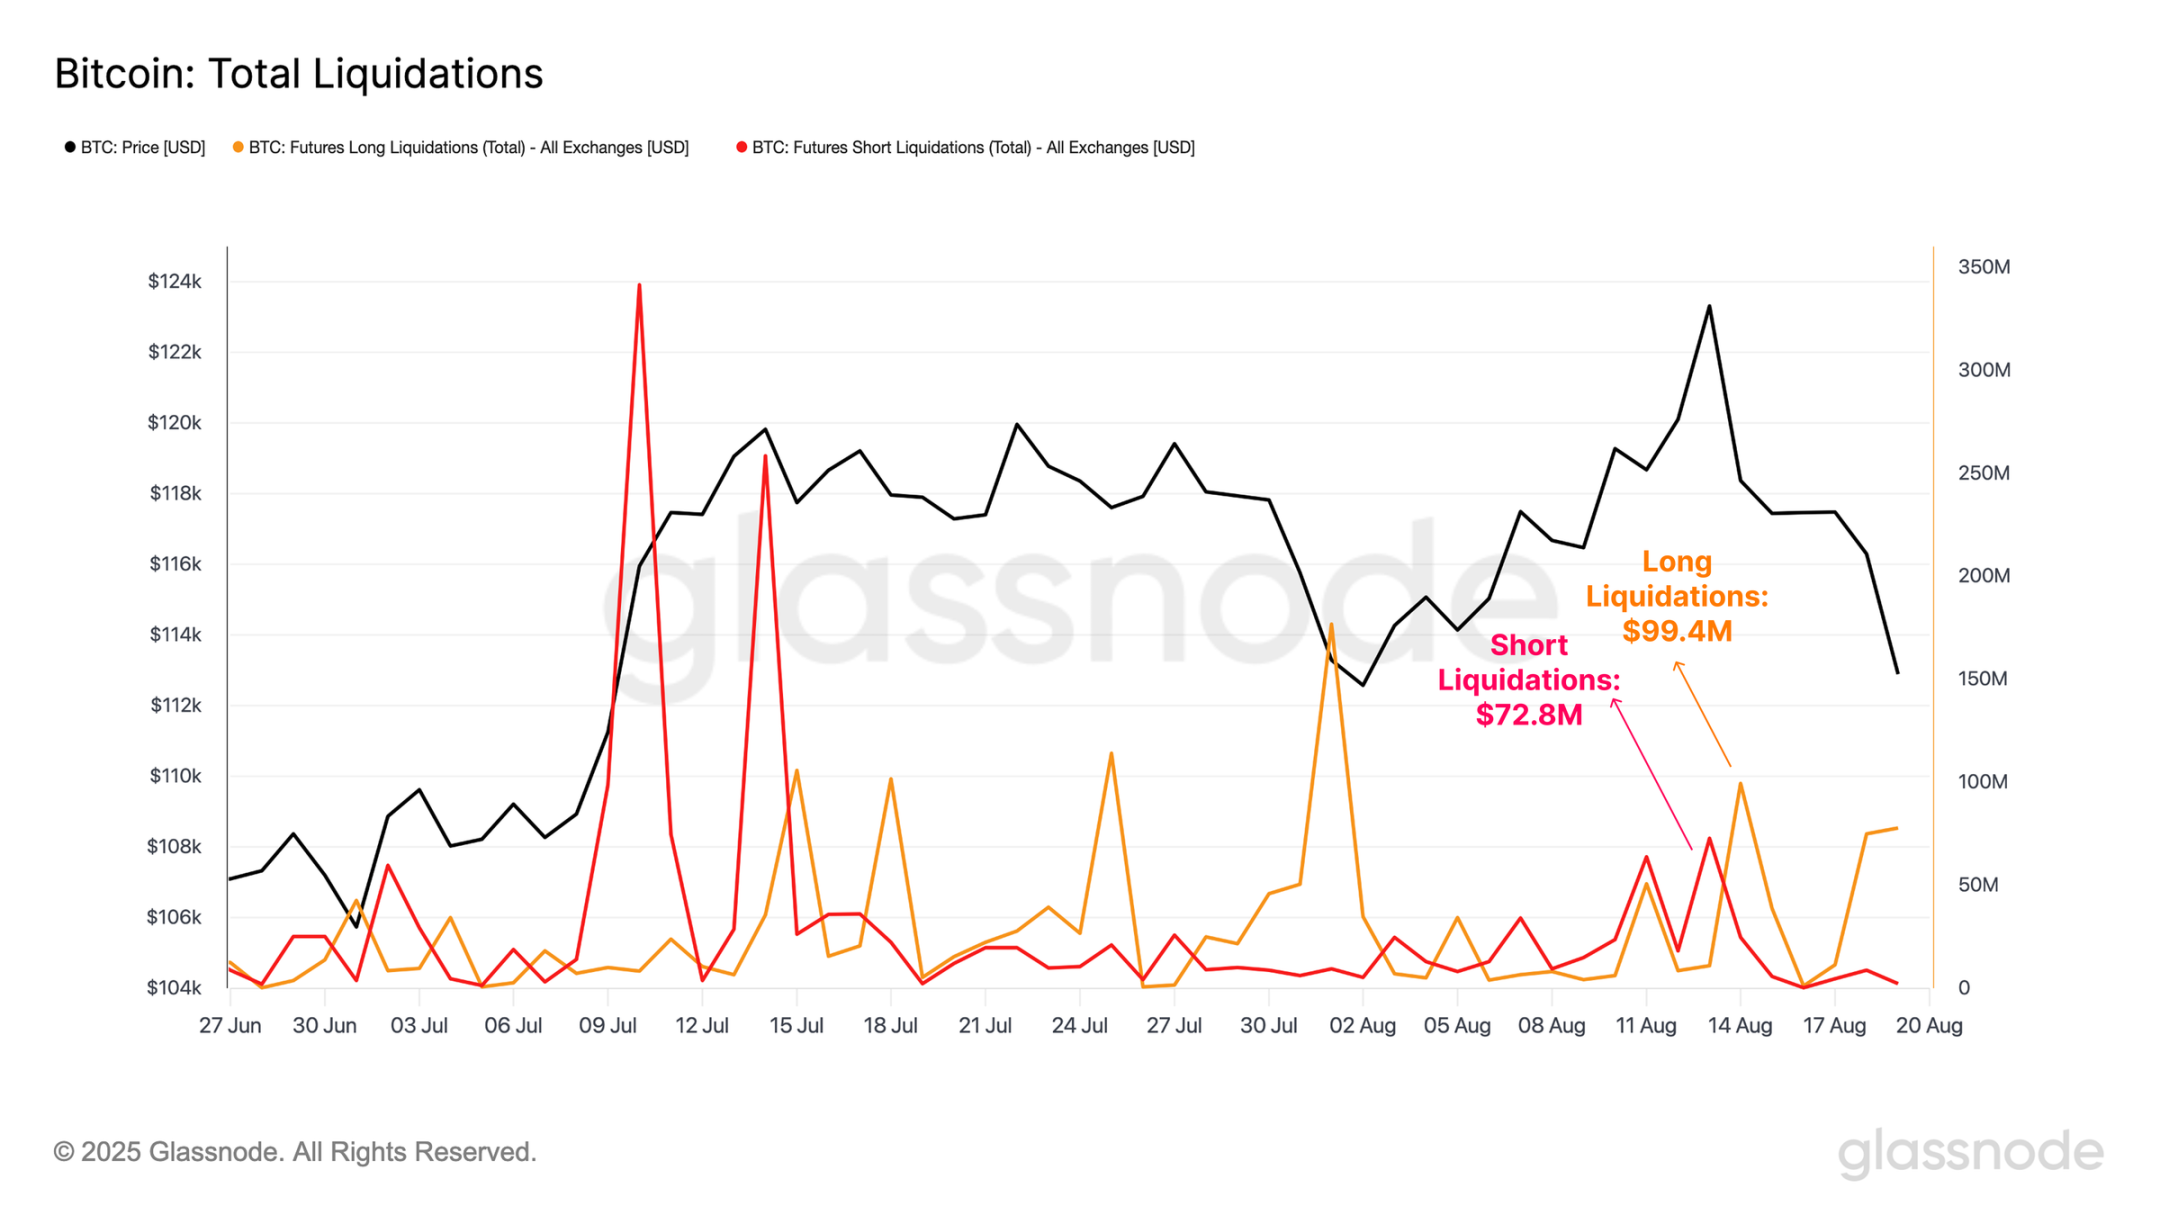
Digging deeper, we can assess the total size of long and short liquidations during the formation of the all-time high and the subsequent price contraction.
While liquidations did rise during these events, with short liquidations reaching $74 million during the all-time high and long liquidations reaching $99 million during the downtrend, these levels are significantly lower than those seen during similar periods of significant price volatility this year. This suggests that a significant portion of the near-term contract liquidations may have been voluntary and therefore risk-managed, rather than forced liquidations driven by the removal of excessive leverage.
Real-time charts
When evaluating open interest in futures contracts for major altcoins (ETH, SOL, XRP, DOGE), we noticed that their combined total surged to a new all-time high of $60.2 billion over the weekend. This was nearly on par with the open interest in Bitcoin futures contracts. However, this surge was short-lived, as prices subsequently corrected and fell, resulting in a $2.6 billion decrease in open interest, the tenth largest decline on record.
These rapid fluctuations indicate that altcoins are currently attracting a significant amount of investor attention and have significantly exacerbated the reflexivity and fragility of the digital asset market.
Real-time charts
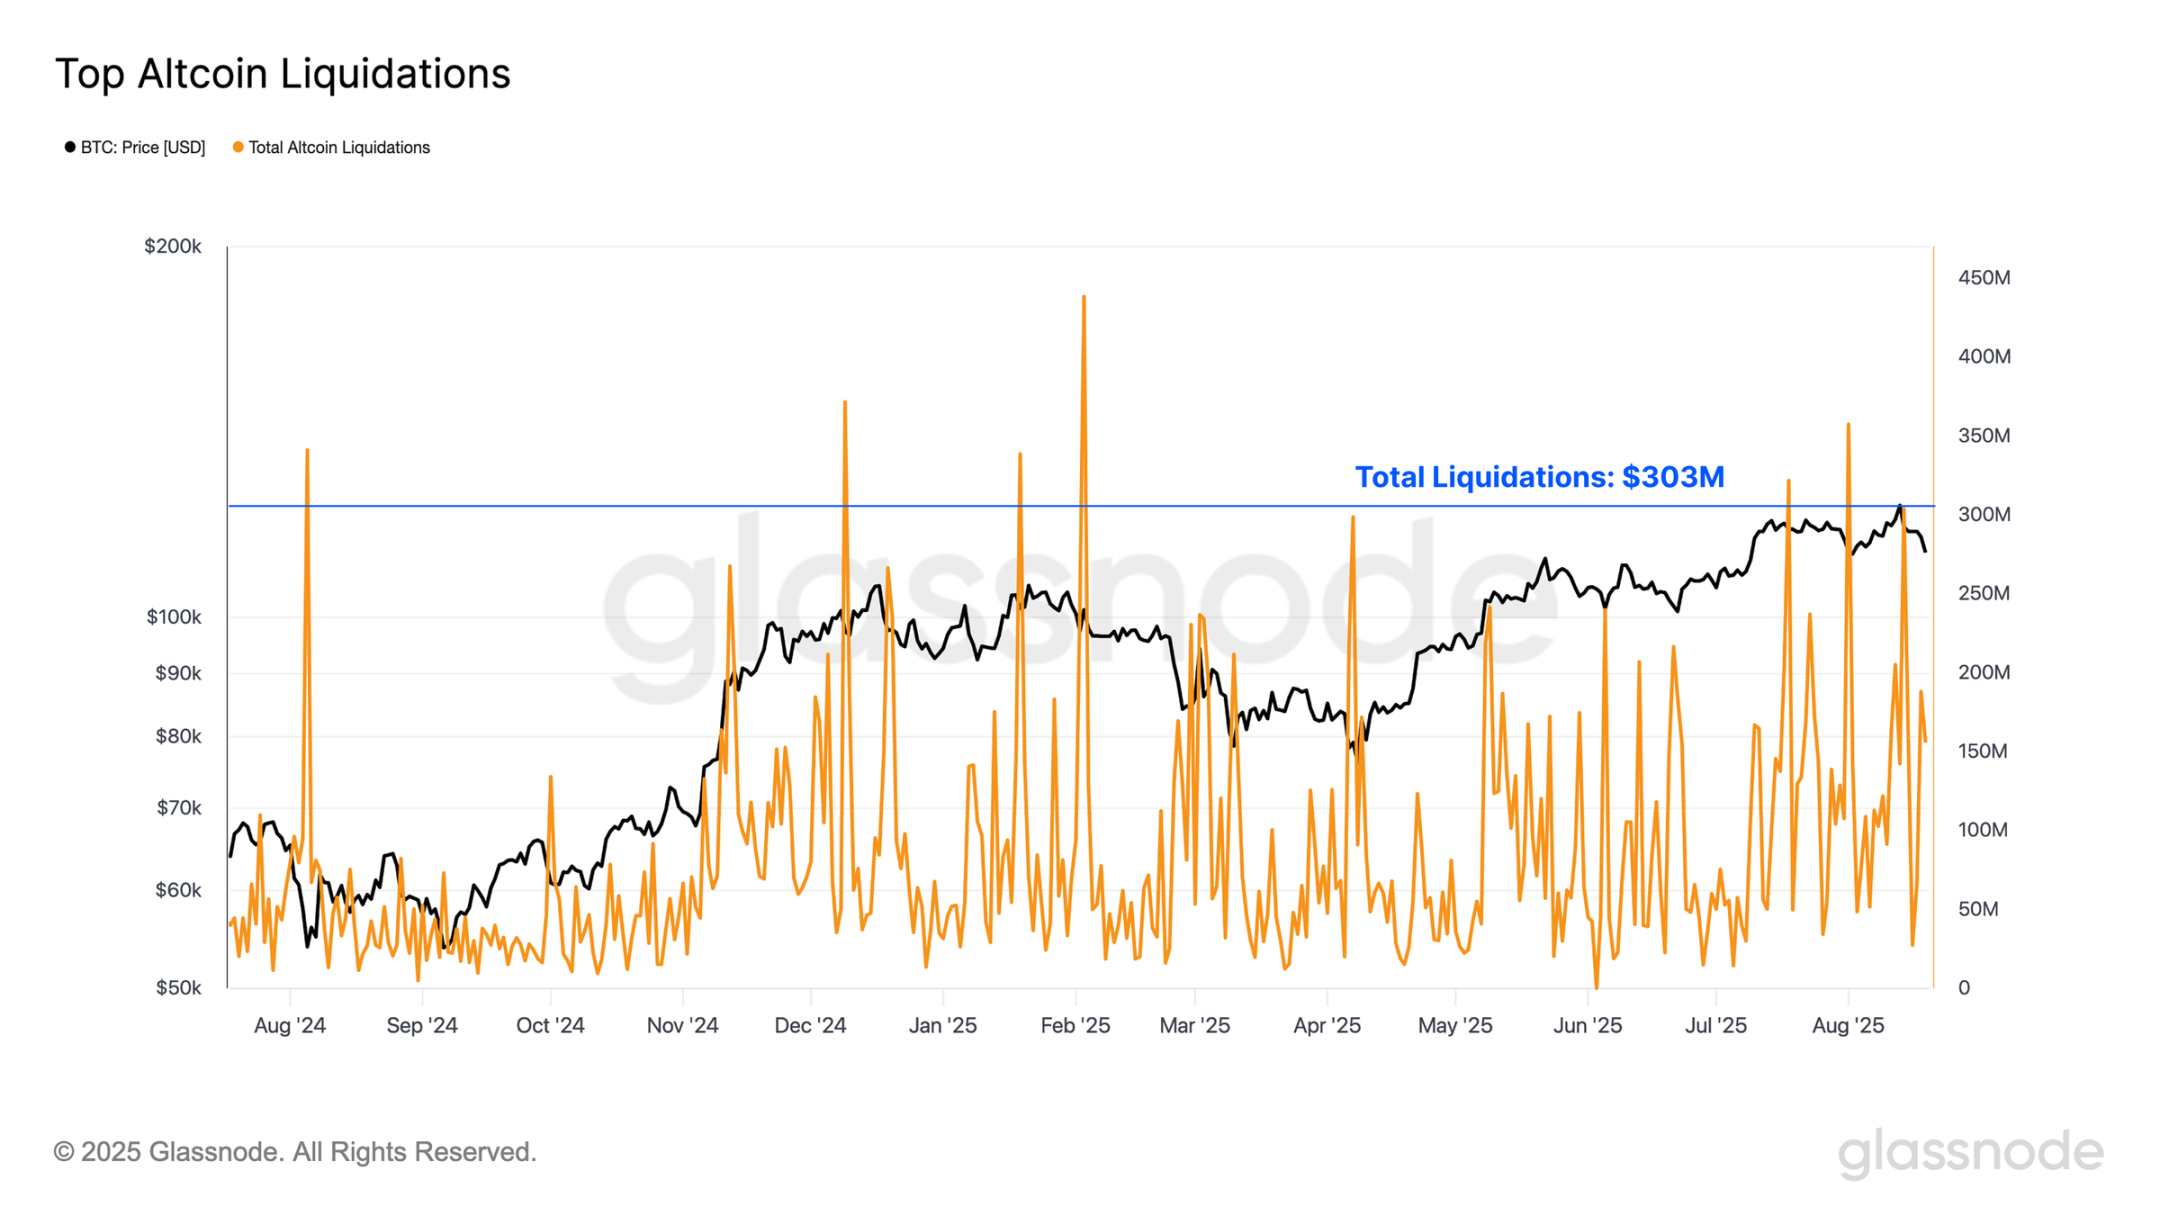
Furthermore, total liquidations for major altcoins have been quite high recently, peaking at $303 million per day, and experiencing more than double the liquidation volume of the Bitcoin futures market.
Furthermore, last weekend’s liquidations now rank 15th on record, signaling a heightened appetite for leveraged exposure in the altcoin space.
Real-time charts
Speculation intensifies
Over the years, Ethereum has often been viewed as a bellwether asset, with periods of outperformance typically correlating with broader “alt season” phases in the digital asset market.
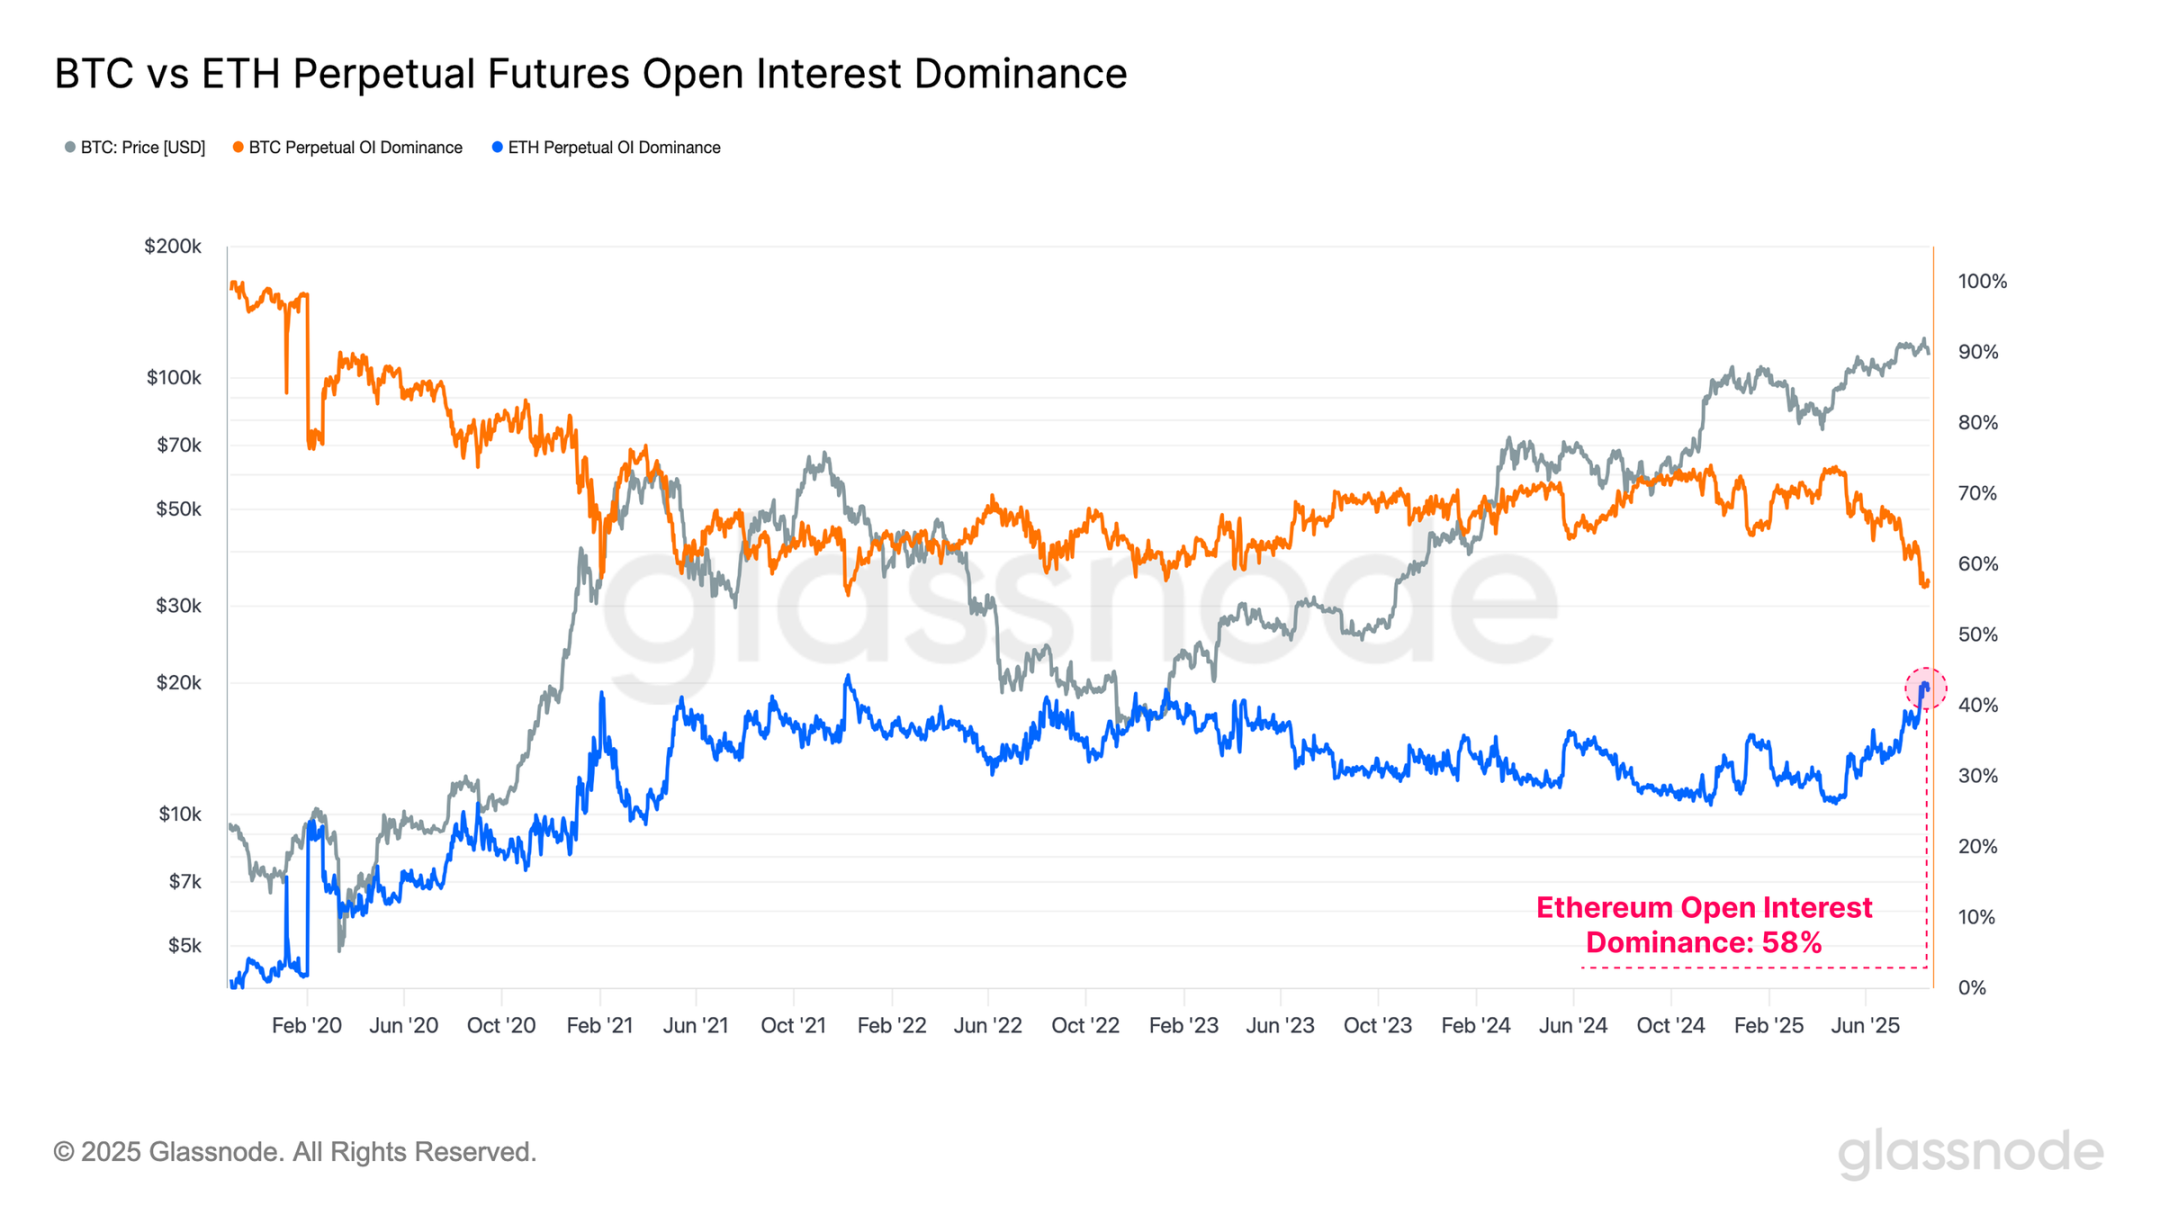
This relationship can also be observed through the open interest dominance ratio between Bitcoin and Ethereum, which reflects the changes in risk appetite of market participants. As of now;
- Bitcoin Open Interest Dominance: 56.7%
- Ethereum Open Interest Dominance: 43.3%
Ethereum's open interest share has been climbing rapidly recently, indicating a significant shift in market attention further up the risk curve. Notably, Ethereum's open interest dominance ratio has reached its fourth-highest level on record, highlighting a significant increase in speculative activity. It's important to note that as the second-largest digital asset, Ethereum is one of the few assets capable of attracting institutional-scale capital.
Real-time charts
This trend becomes even more striking when viewed through the lens of trading volume. Ethereum’s perpetual futures trading volume dominance has surged to a new all-time high of 67%, the strongest shift on record.
Such a significant rotation in trading activity reflects growing investor interest in the altcoin sector and points to an acceleration in risk appetite within the current market cycle.
Real-time charts
crossroads
When we look at Bitcoin’s performance from the lows of each cycle, we can see that in both the 2015-2018 and 2018-2022 cycles, the all-time highs were reached approximately 2-3 months later than where we are in the current cycle, in relative terms.
While these are just two examples from before a mature cycle, and therefore insufficient to assume this synchronicity will persist, it is still a noteworthy data point. This perspective is particularly relevant when considering the wave of on-chain profit-taking over the past two years and the high levels of speculative activity visible in derivatives markets today.
Real-time charts
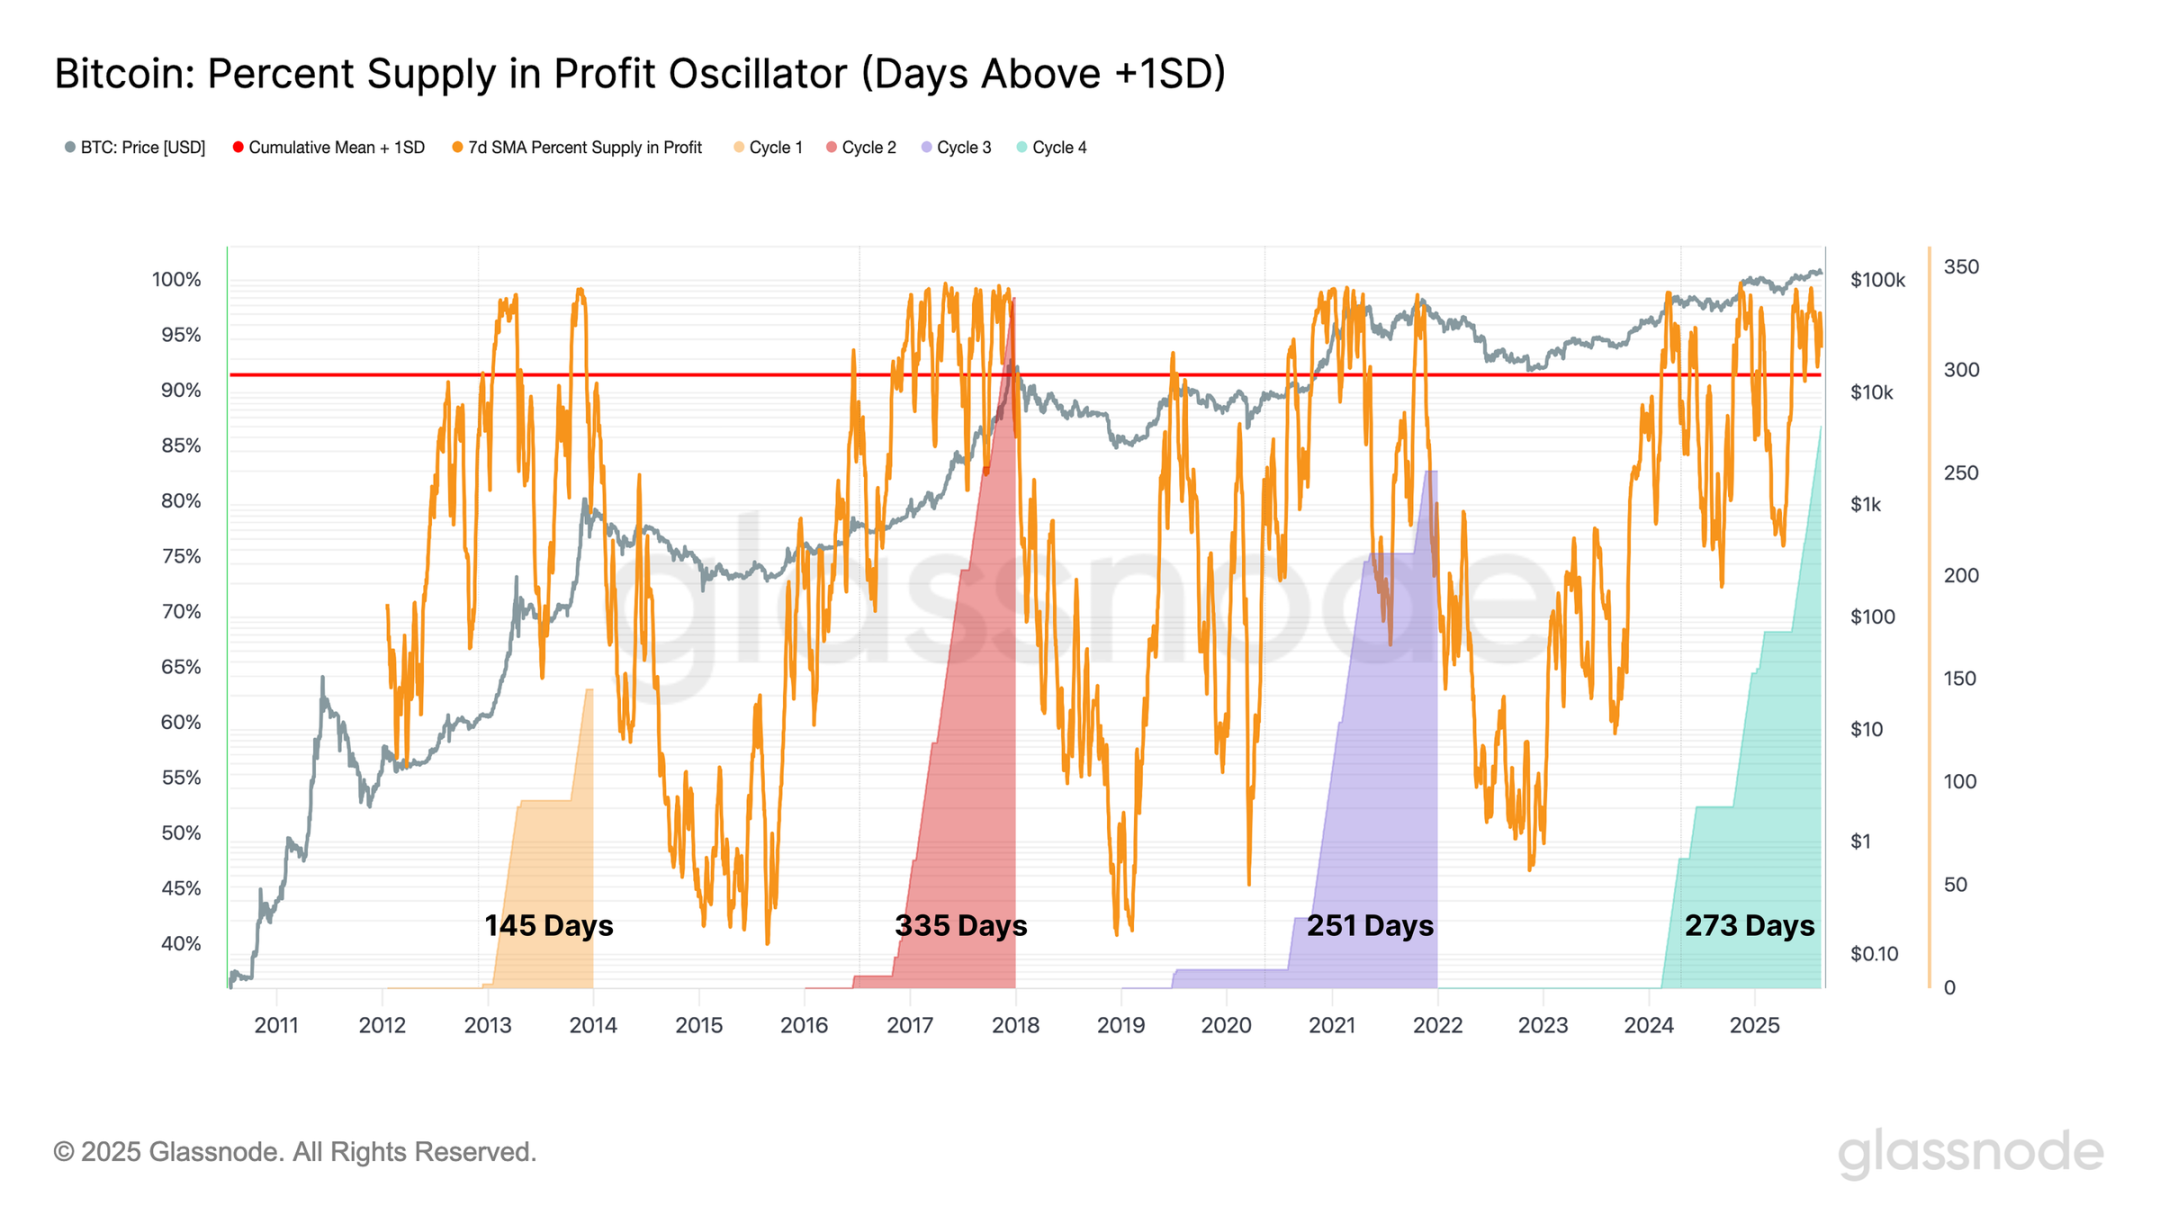
To further support this observation, we can look at the length of time that the percentage of Bitcoin’s circulating supply remained above the +1 standard deviation band during each cycle.
In the current cycle, this period has now extended to 273 days, making it the second-longest on record, behind only the 335-day period of the 2015-2018 cycle. This suggests that the current cycle is comparable in duration to previous cycles when measured from the perspective of the vast majority of supply being held at a profit.
Real-time charts
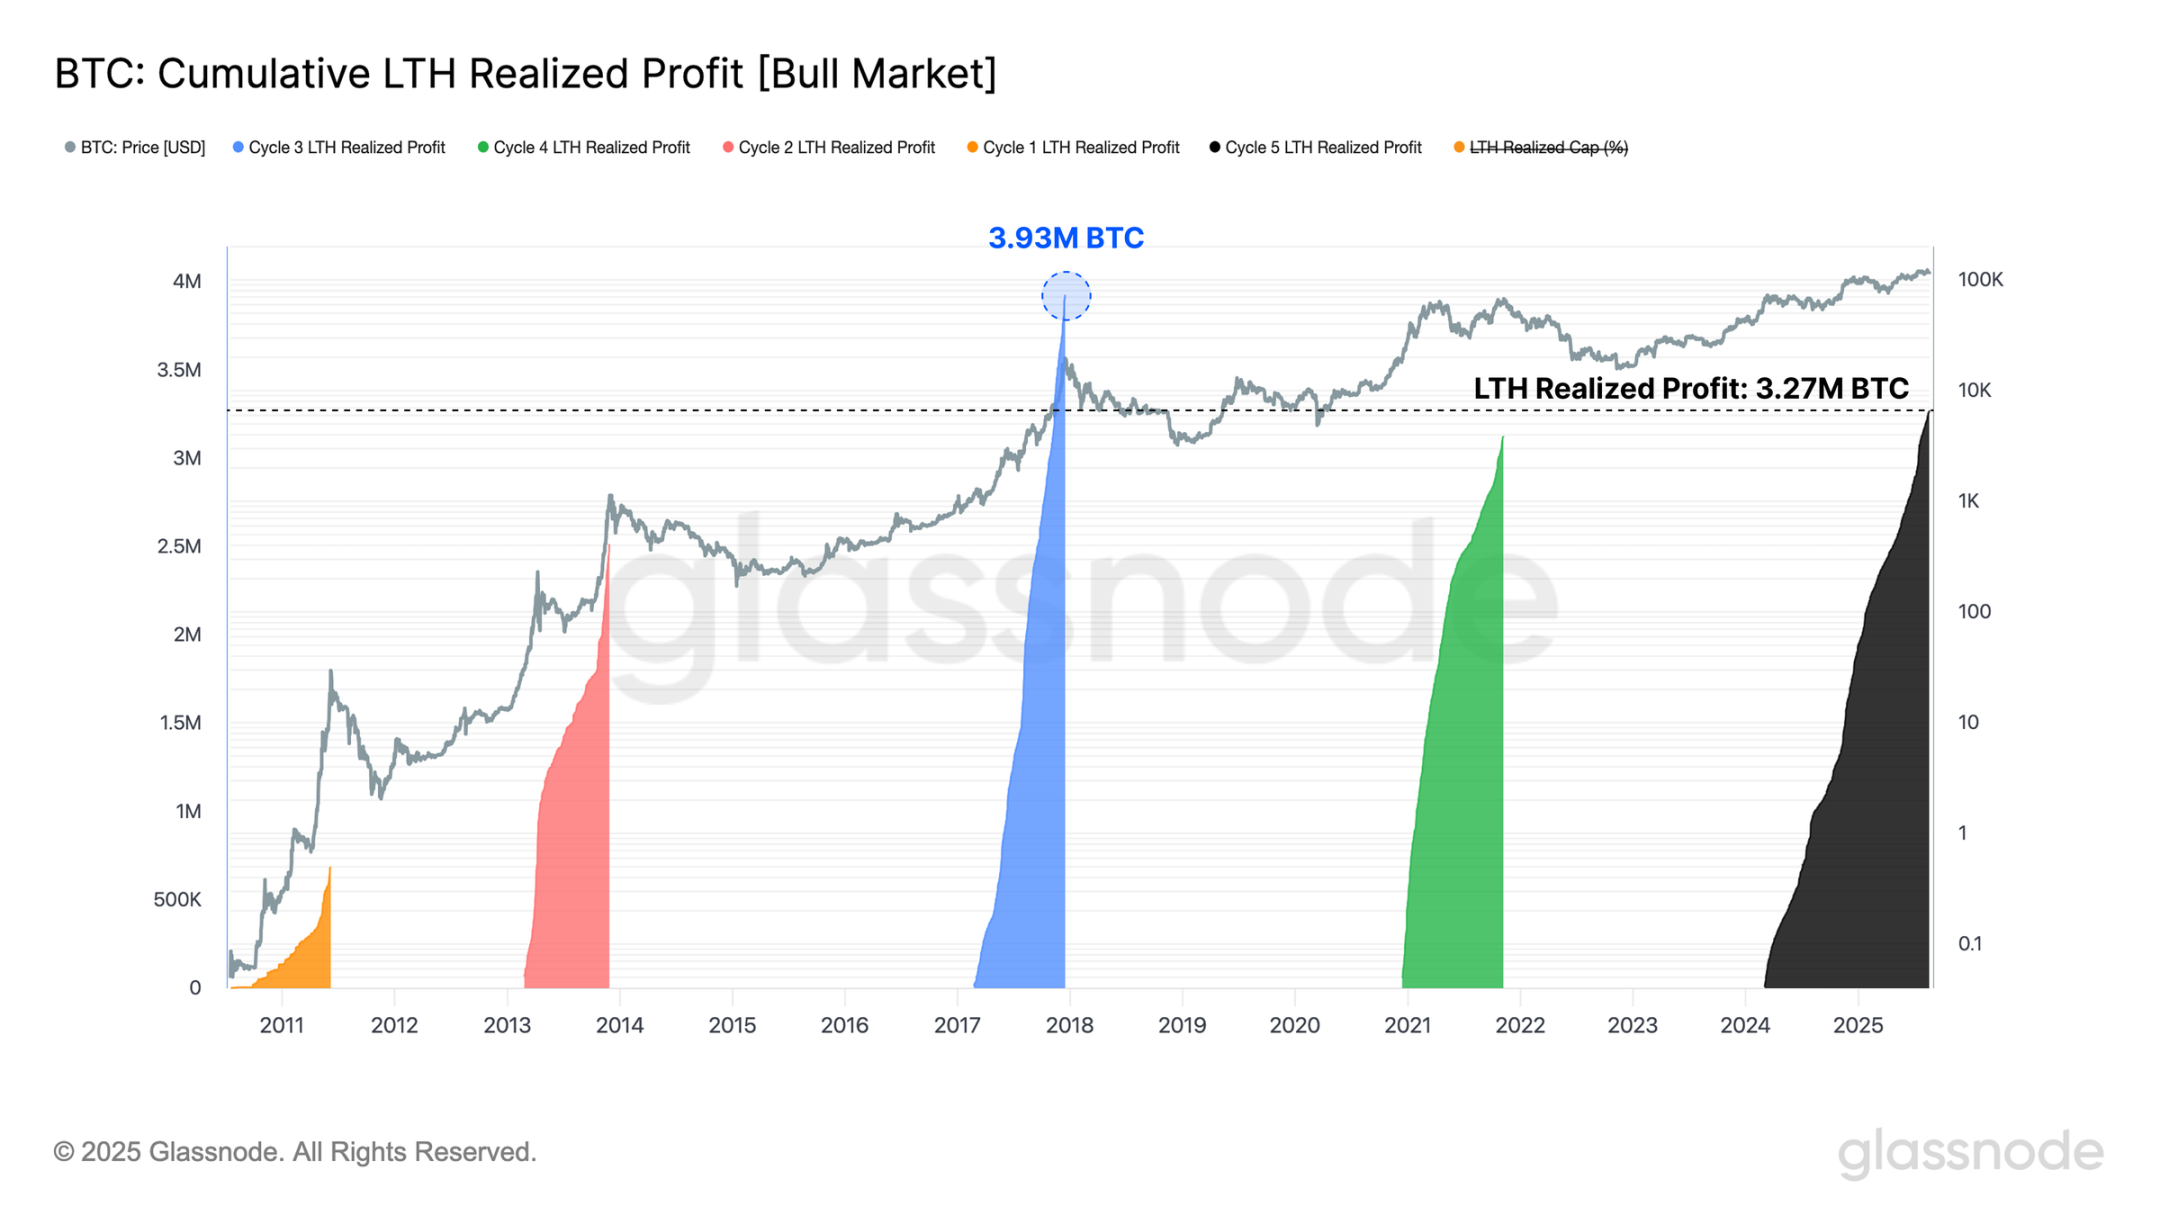
We can also measure the cumulative profits realized by long-term holders from the time a new cycle all-time high is reached until the final peak of the cycle. From this perspective, we find that the group of long-term holders (who are typically most active at the extremes of the cycle) has realized more profits than in all but one of the previous cycles (the 2016-2017 cycle).
This observation is consistent with previous indicators, adding another dimension through the lens of seller pressure. Taken together, these signals reinforce the view that the current cycle is in its late historical stage.
However, each cycle has its own characteristics, and there is no guarantee that market behavior will follow this fixed time pattern.
Nonetheless, these dynamics raise an interesting question. Does the traditional four-year cycle continue to hold true, or are we witnessing its evolution? These questions will be answered in the coming months.
Real-time charts
in conclusion
Capital inflows into Bitcoin are showing signs of weakening, with demand declining even as the price hit a new all-time high of $124,400. This slowdown coincides with a surge in speculative positions, with total open interest in major altcoins briefly reaching a new all-time high of $60 billion before retracing, shedding $2.5 billion.
Ethereum, long considered a bellwether of "alt season," is once again at the forefront of this movement. Its open interest dominance ratio has climbed to the fourth highest level on record, while perpetual futures volume dominance has soared to a new all-time high of 67%, marking the strongest structural shift to date.
From a cyclical perspective, Bitcoin's price action echoes previous patterns. In both the 2015-2018 and 2018-2022 cycles, all-time highs were reached only two to three months later than the current juncture, measured from the cycle lows. Meanwhile, the level of profits realized by long-term holders is comparable to past market manias, reinforcing the impression of a late-cycle market.
Taken together, these signals highlight rising leverage, profit-taking, and increased speculative intensity, which have historically characterized maturing markets. However, each cycle has its own characteristics, and there is no guarantee that Bitcoin and the broader market will follow a fixed timeline.


