
Key metrics: (May 26, 4pm -> June 2, 4pm Hong Kong time)
BTC/USD fell 4.4% (110.2k USD -> 105.4k USD), ETH/USD fell 2.7% (2,580 -> 2,510 USD)
Although Bitcoin has retreated from its highs over the past week, the price has basically been in a sideways correction, which has not affected the overall upward trend. We still believe that the market will try to break out again in the next few weeks or months, which may push us to the ultimate target of $120-130k. Of course, the exact time is difficult to determine, and if the support level of $99-101k does not hold, the complete completion of this wave of rise may be delayed until the end of summer. At present, we believe that the place where the support level is slightly lower can be strategically added to the long position or re-buyed. If the price of the coin does fall below $99k, the price of the coin may fall to the range of $93-94k. On the upper side of the coin price, the first resistance level appears at $108-109k, followed by a new high of $112k.
Market Theme
Risk markets saw a brief rally in the middle of last week after the U.S. International Trade Court ruled that the Trump administration's use of the International Economic Emergency Powers Act (IEEPA) to impose comprehensive tariffs was illegal. However, the stock market did not continue to rise, and the risk rebound that began in early April seems to have reached its limit. At the same time, volatility of various assets has hit new lows, further confirming that the market is exhausted and has made significant reductions. In general, the market is looking forward to the upcoming summer vacation, not worrying about any possible accidents, and turning a deaf ear to some negative news (such as Trump's tweet on Friday that China violated the trade agreement).
Bitcoin's amazing gains finally lost momentum last week, ending the week with a loss for the first time in 2 months (calculated by the New York close on Friday). The total inflows into the IBIT ETF in May exceeded $6 billion. This downward correction was mainly technical, accompanied by some short-term leveraged long liquidations, but overall realized volatility remained low. As long as this situation continues, we should continue to see passive inflows on small dips, especially considering the weakness in dollar-related markets caused by US policy uncertainty.
BTC ATM Implied Volatility
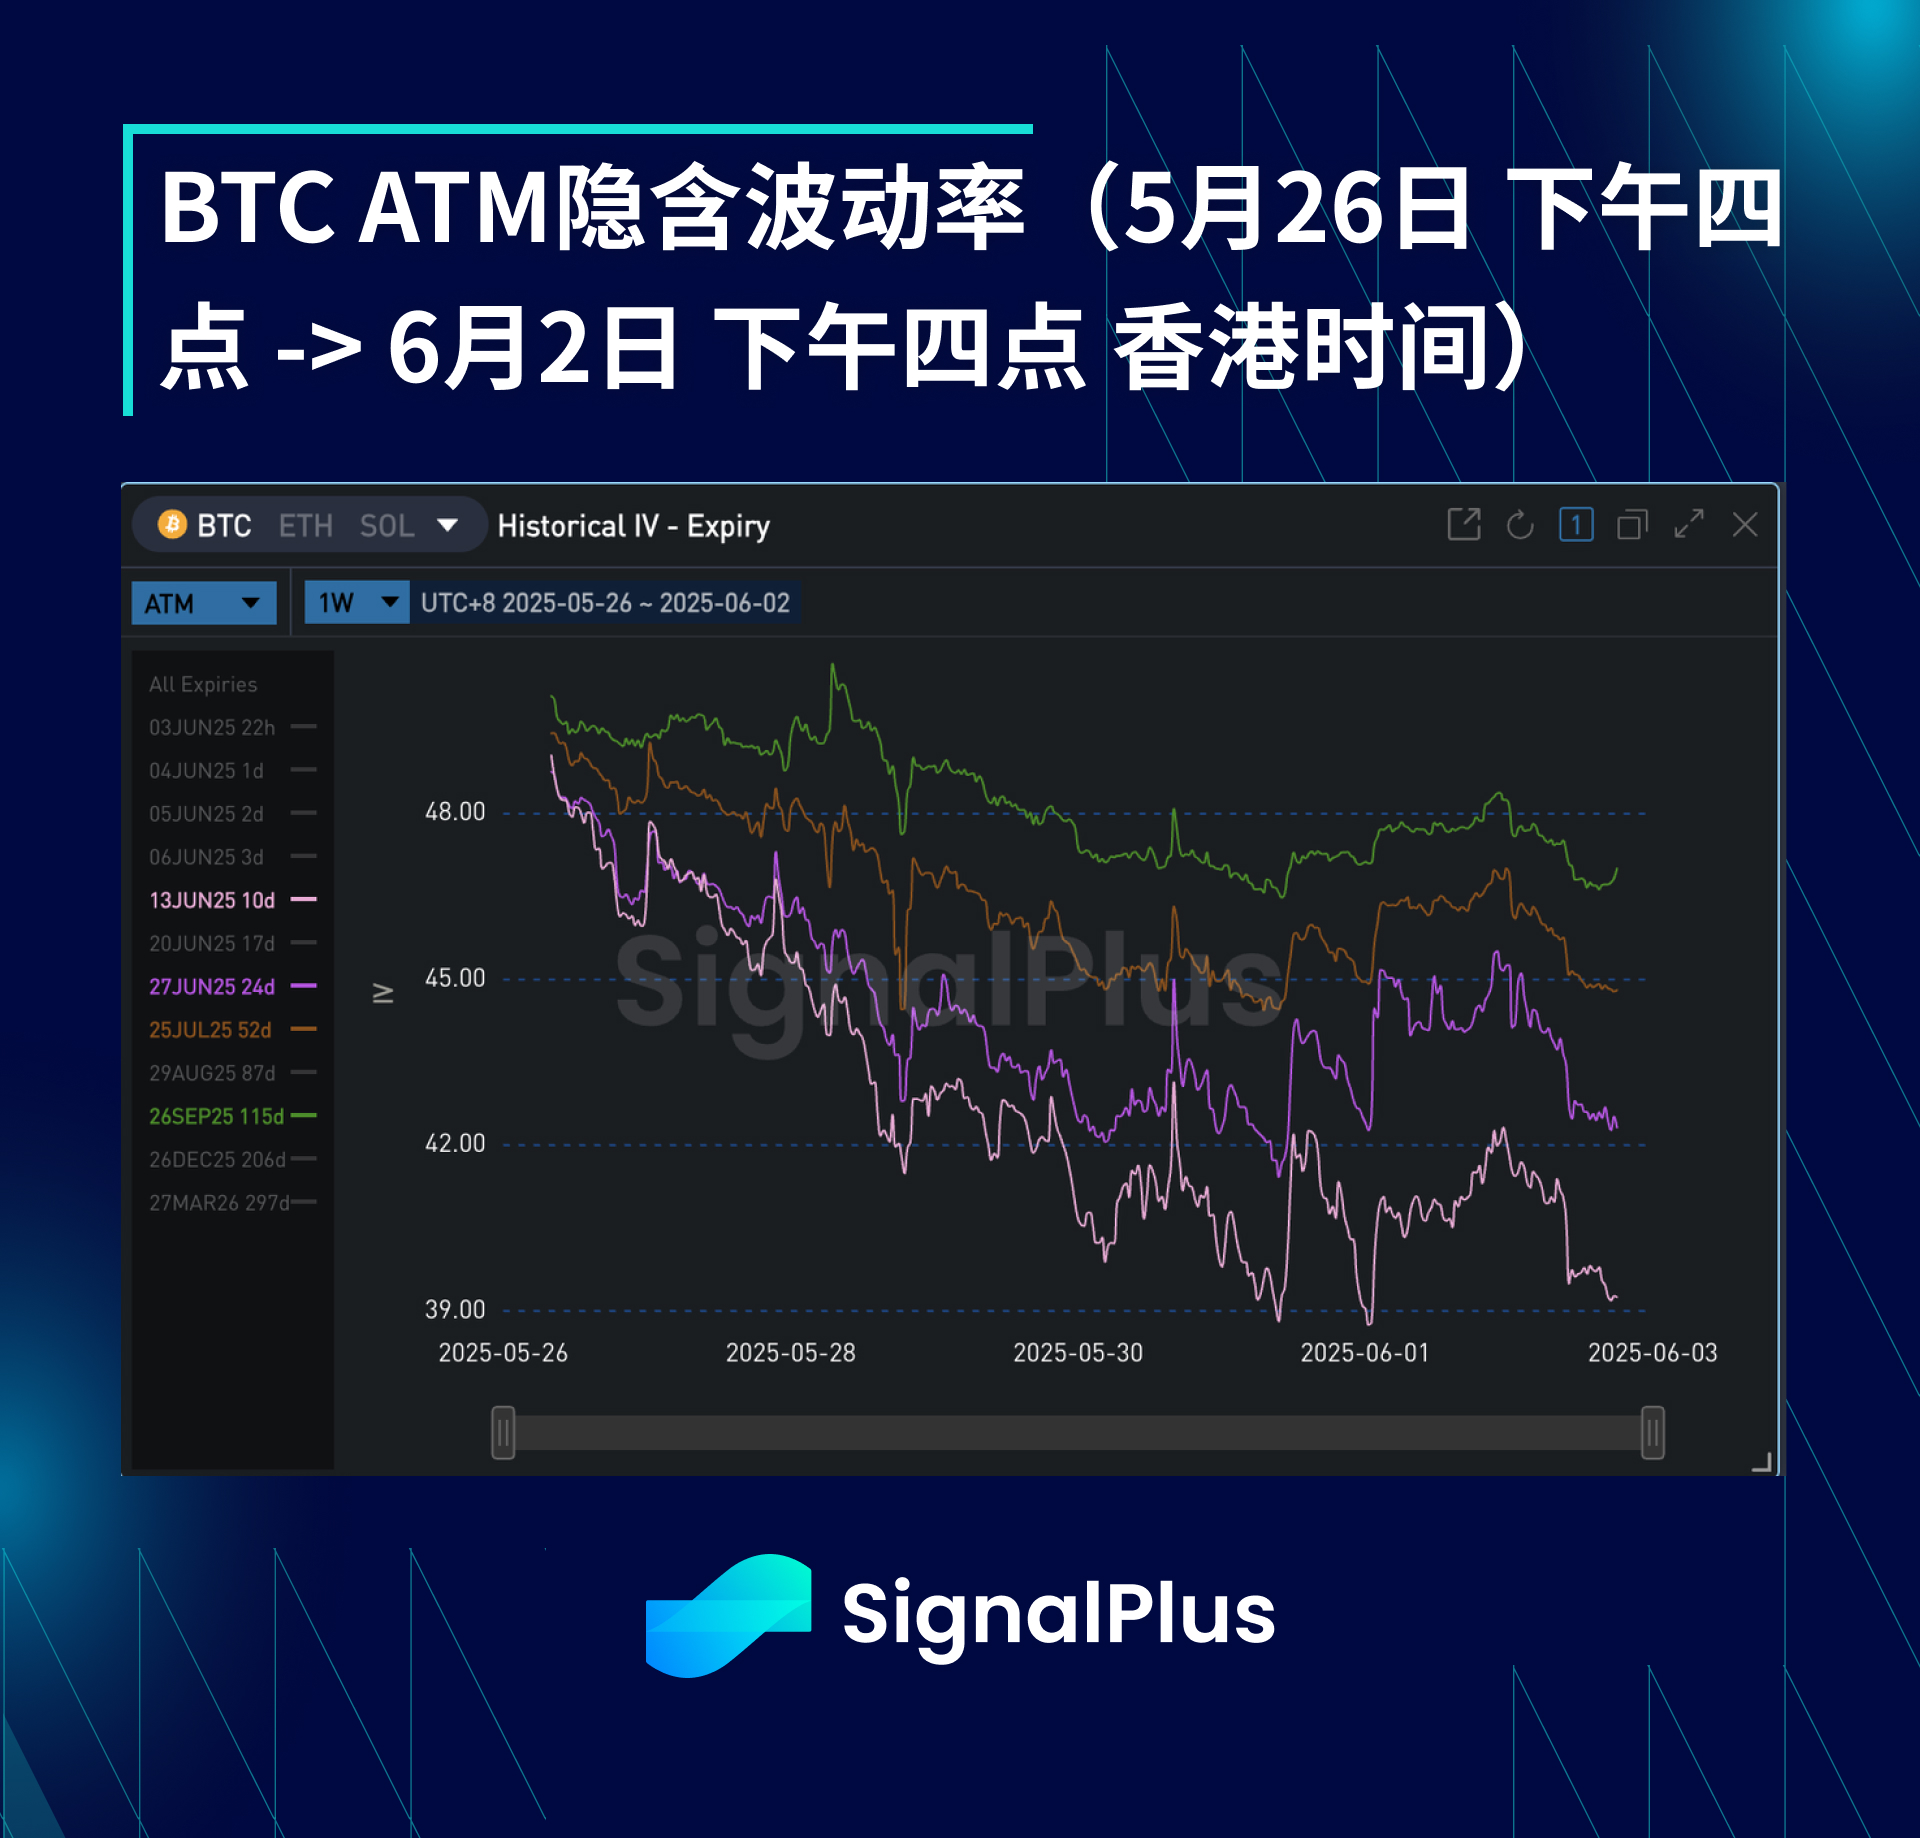
The week before, the price of the coin broke through a key point to reach an all-time high, and then Trump's remarks on EU tariffs caused a rapid decline. These two events led to a brief increase in realized volatility. Since then, realized volatility has continued to decline last week. Although the range of coin price activity last week was very large, high-frequency realized volatility was only in the mid-30s. With the coin price returning to the range of 103-106k US dollars that has trapped us for several weeks, we expect that unless there is an unexpected catalyst, the coin price activity will remain quiet and will continue to suppress realized volatility, eventually putting pressure on implied volatility and appearing double-sell coin price activity The strike price outside the range has caused more and more long gamma on the market.
The term structure remains steep, with the market still struggling to support long positions in June-September with short-term shorts. At the same time, realized volatility is very quiet as the Las Vegas conference failed to produce any unexpected surprises, with short-term expiration dates falling hard again. This makes it more difficult to continue selling front-end support forwards and further pressures June/July volatility.
BTC Skewness/Kurtosis
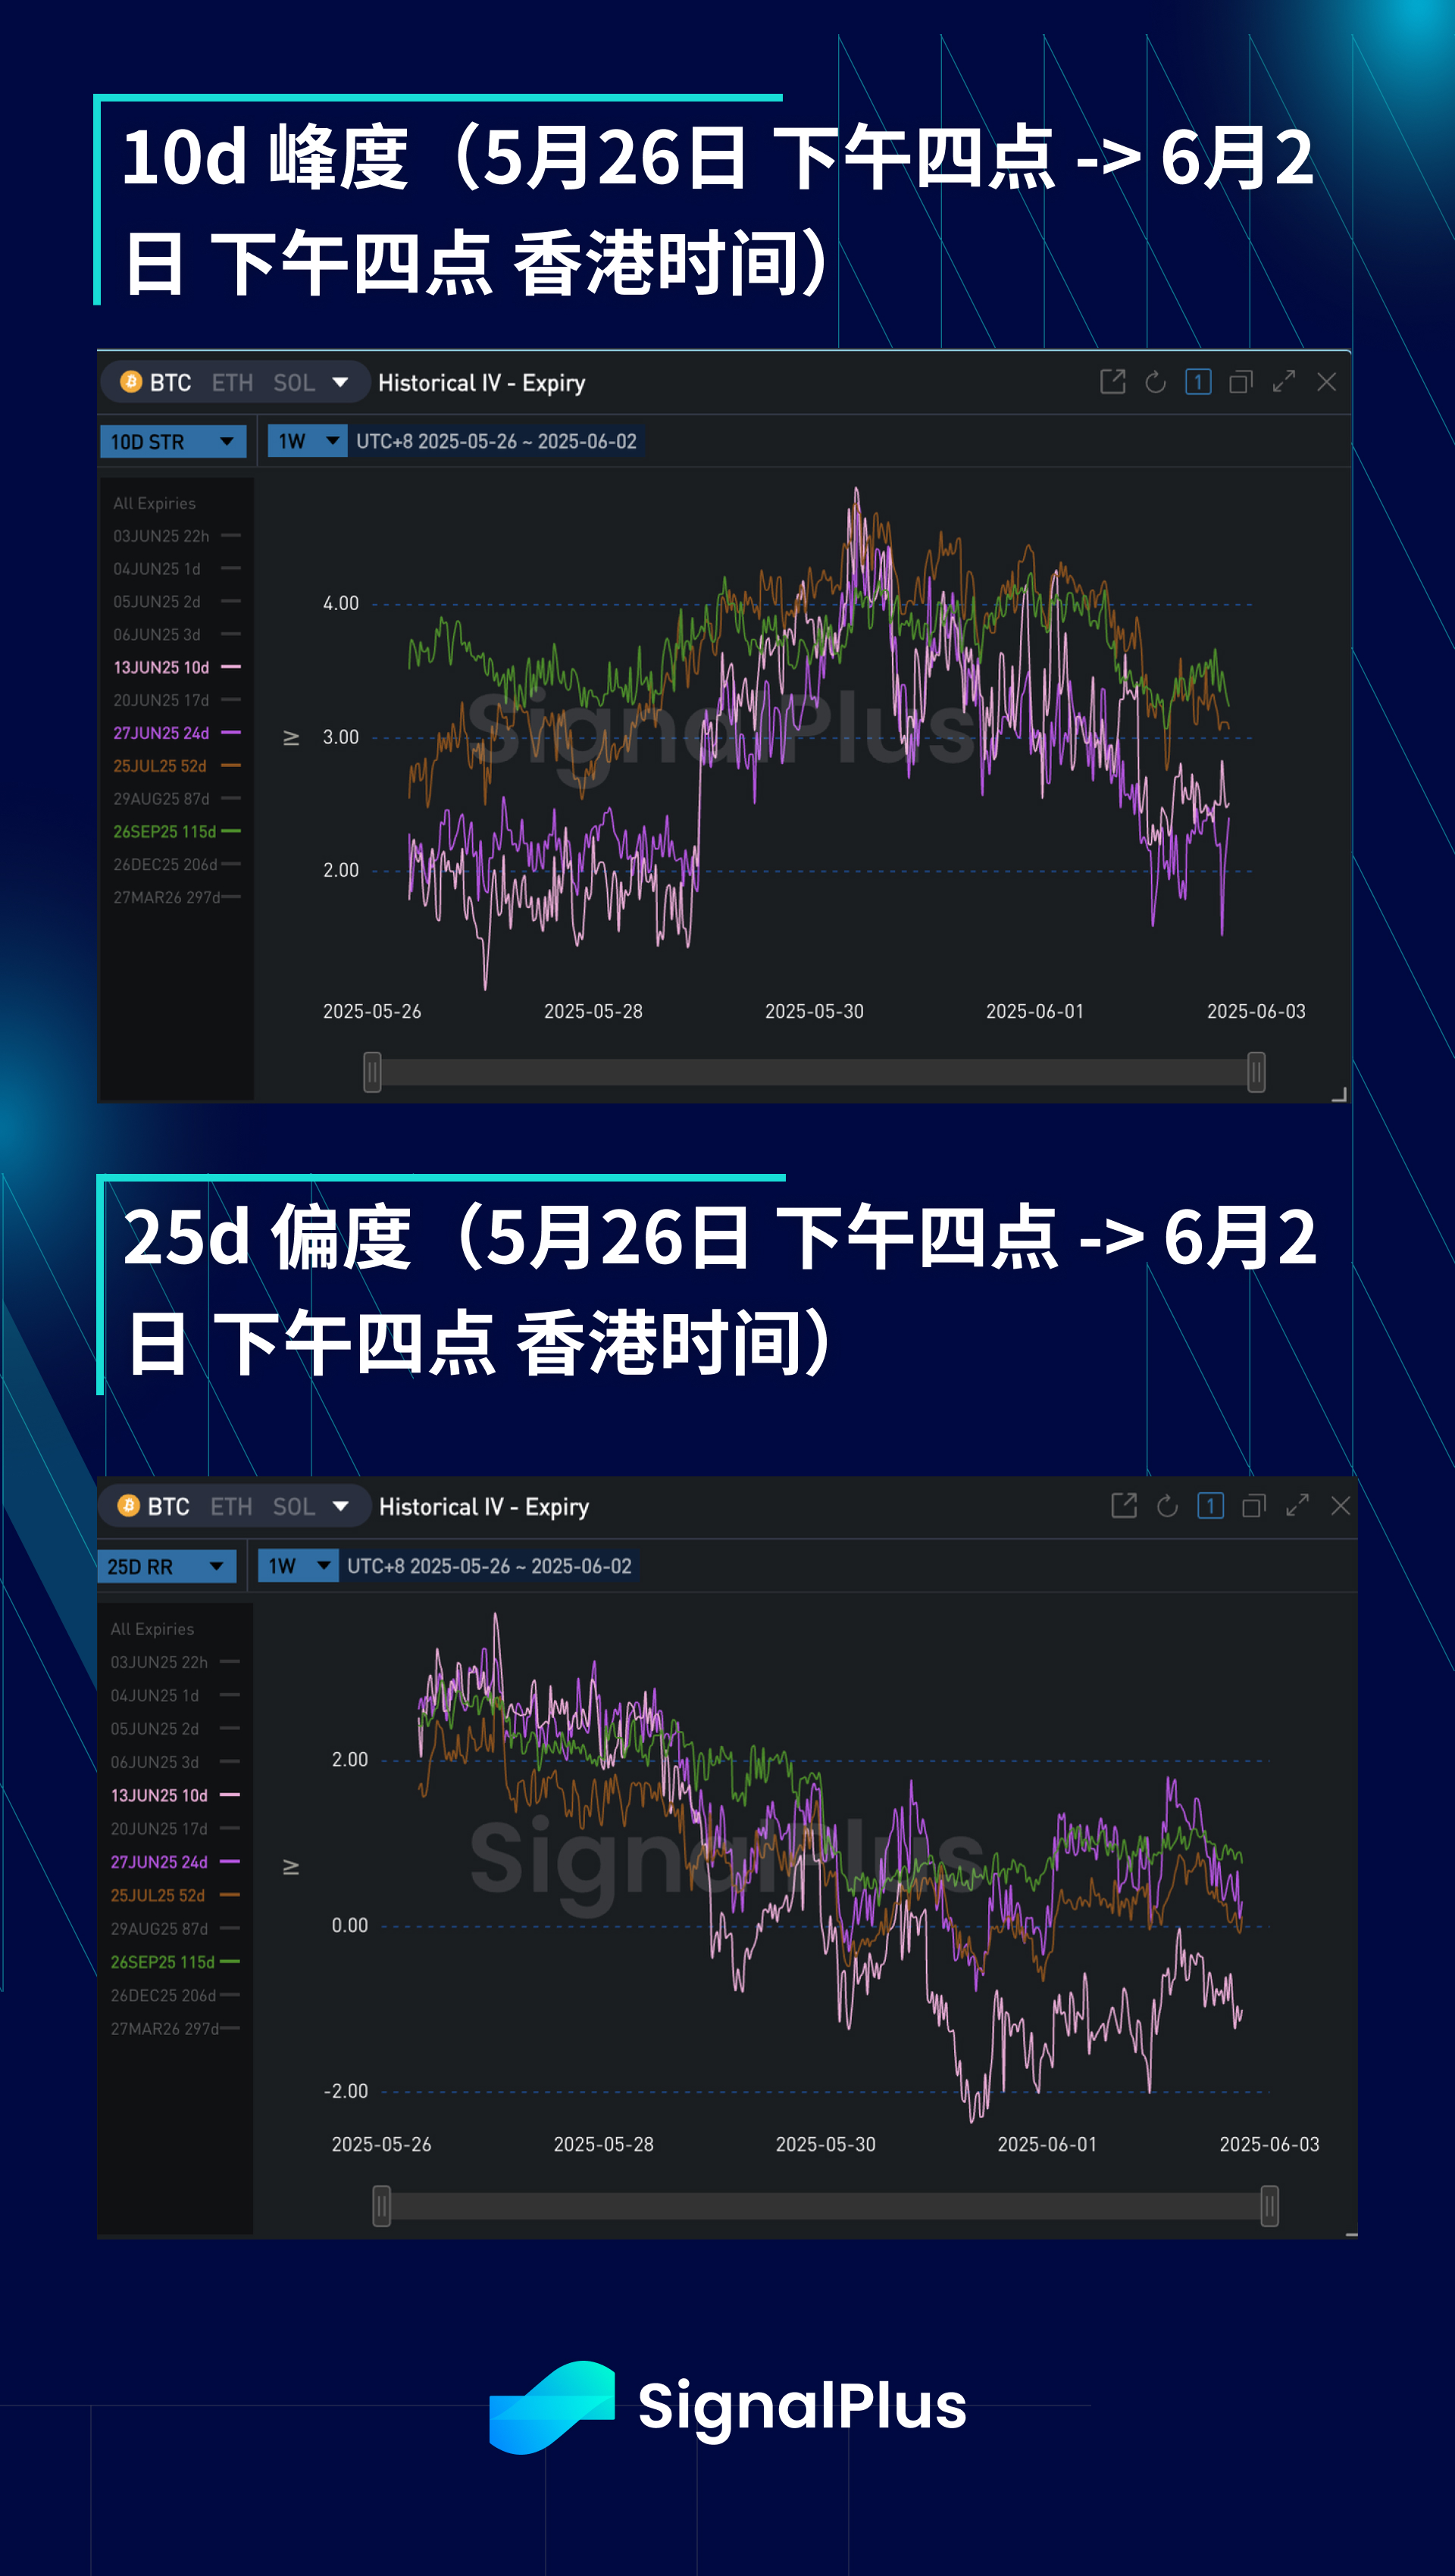
The skewness is more biased to the downside this week, which is consistent with the short-term market momentum shift. The market is not interested in buying call options even when it reaches historical highs, and continues to sell when the price rises slightly to reduce exposure. The combination of the two has led to the market's unwillingness to buy call options at a premium. At the same time, the market is aware of the danger below the price. If the price falls below the support level of $99-101,000 or the risk asset wind changes, the price trend may be very jumpy.
Kurtosis has been sideways for the past week, with a slight decline. Because people continue to sell the strike price of the wing, and the market is trying to support long positions on both sides of the middle strike price and the price, they are willing to sell both sides slightly lower to reduce the loss of Theta. Considering the current quite restrained price trend and the rapid increase in realized volatility (and implied volatility, skewness) after breaking through the range, we think it is very worthwhile to hold a long wing position at present.
Good luck to everyone this week!
You can use the SignalPlus trading vane function for free at t.signalplus.com/news , which integrates market information through AI and makes market sentiment clear at a glance. If you want to receive our updates in real time, please follow our Twitter account @SignalPlusCN, or join our WeChat group (add the assistant WeChat, please delete the space between English and numbers: SignalPlus 123), Telegram group and Discord community to communicate and interact with more friends.
SignalPlus Official Website: https://www.signalplus.com