
BTC high pressure alert: triple critical indicators resonate, a change in the market is imminent
- 核心观点:比特币市场处于多空临界点,波动风险加剧。
- 关键要素:
- 期货空头持仓突破警戒线,轧空风险高。
- 巨鲸持续抛售BTC,压制市场反弹。
- 7日净已实现利润达年内次高,获利盘兑现压力大。
- 市场影响:短期或现剧烈波动,方向待突破。
- 时效性标注:短期影响。
Original | Odaily Planet Daily ( @OdailyChina )
Author | Ethan ( @ethanzhang_web3 )

Recently, the price of Bitcoin has continued to hover at a high level, fluctuating repeatedly at the key technical support level of $115,000, seemingly stuck in a "dilemma".
Under the calm surface, there are undercurrents: market trading volume continues to shrink, investor sentiment tends to be cautious, and three core on-chain indicators - futures short leverage strength, the degree of realized profit release on the chain, and the movement of whale funds - are simultaneously approaching historical extremes . This rare superposition of the critical state of the three indicators makes the current market structure extremely fragile and the high-pressure situation is significant. Any abnormal movement of any key indicator may become the fuse that triggers violent market fluctuations.
Signal 1: Shorts continue to exert pressure, and OI net positions fall below the $100 million warning line
According to CryptoQuant data, on July 25, the net open interest (OI) of the BTC futures market fell below the $100 million mark again, hitting a new low since early July and entering the "maximum short suppression" range. This means that short contracts are absolutely dominant in the capital structure, severely compressing the leverage space of longs.
Historical rules reveal the significance of early warning: Whenever the OI net position enters this area (such as October 2023, March 2024, and early July 2025), the market tends to fluctuate violently in the short term. Extreme short-selling suppression usually creates a local bottom or triggers a short-term explosive rebound.
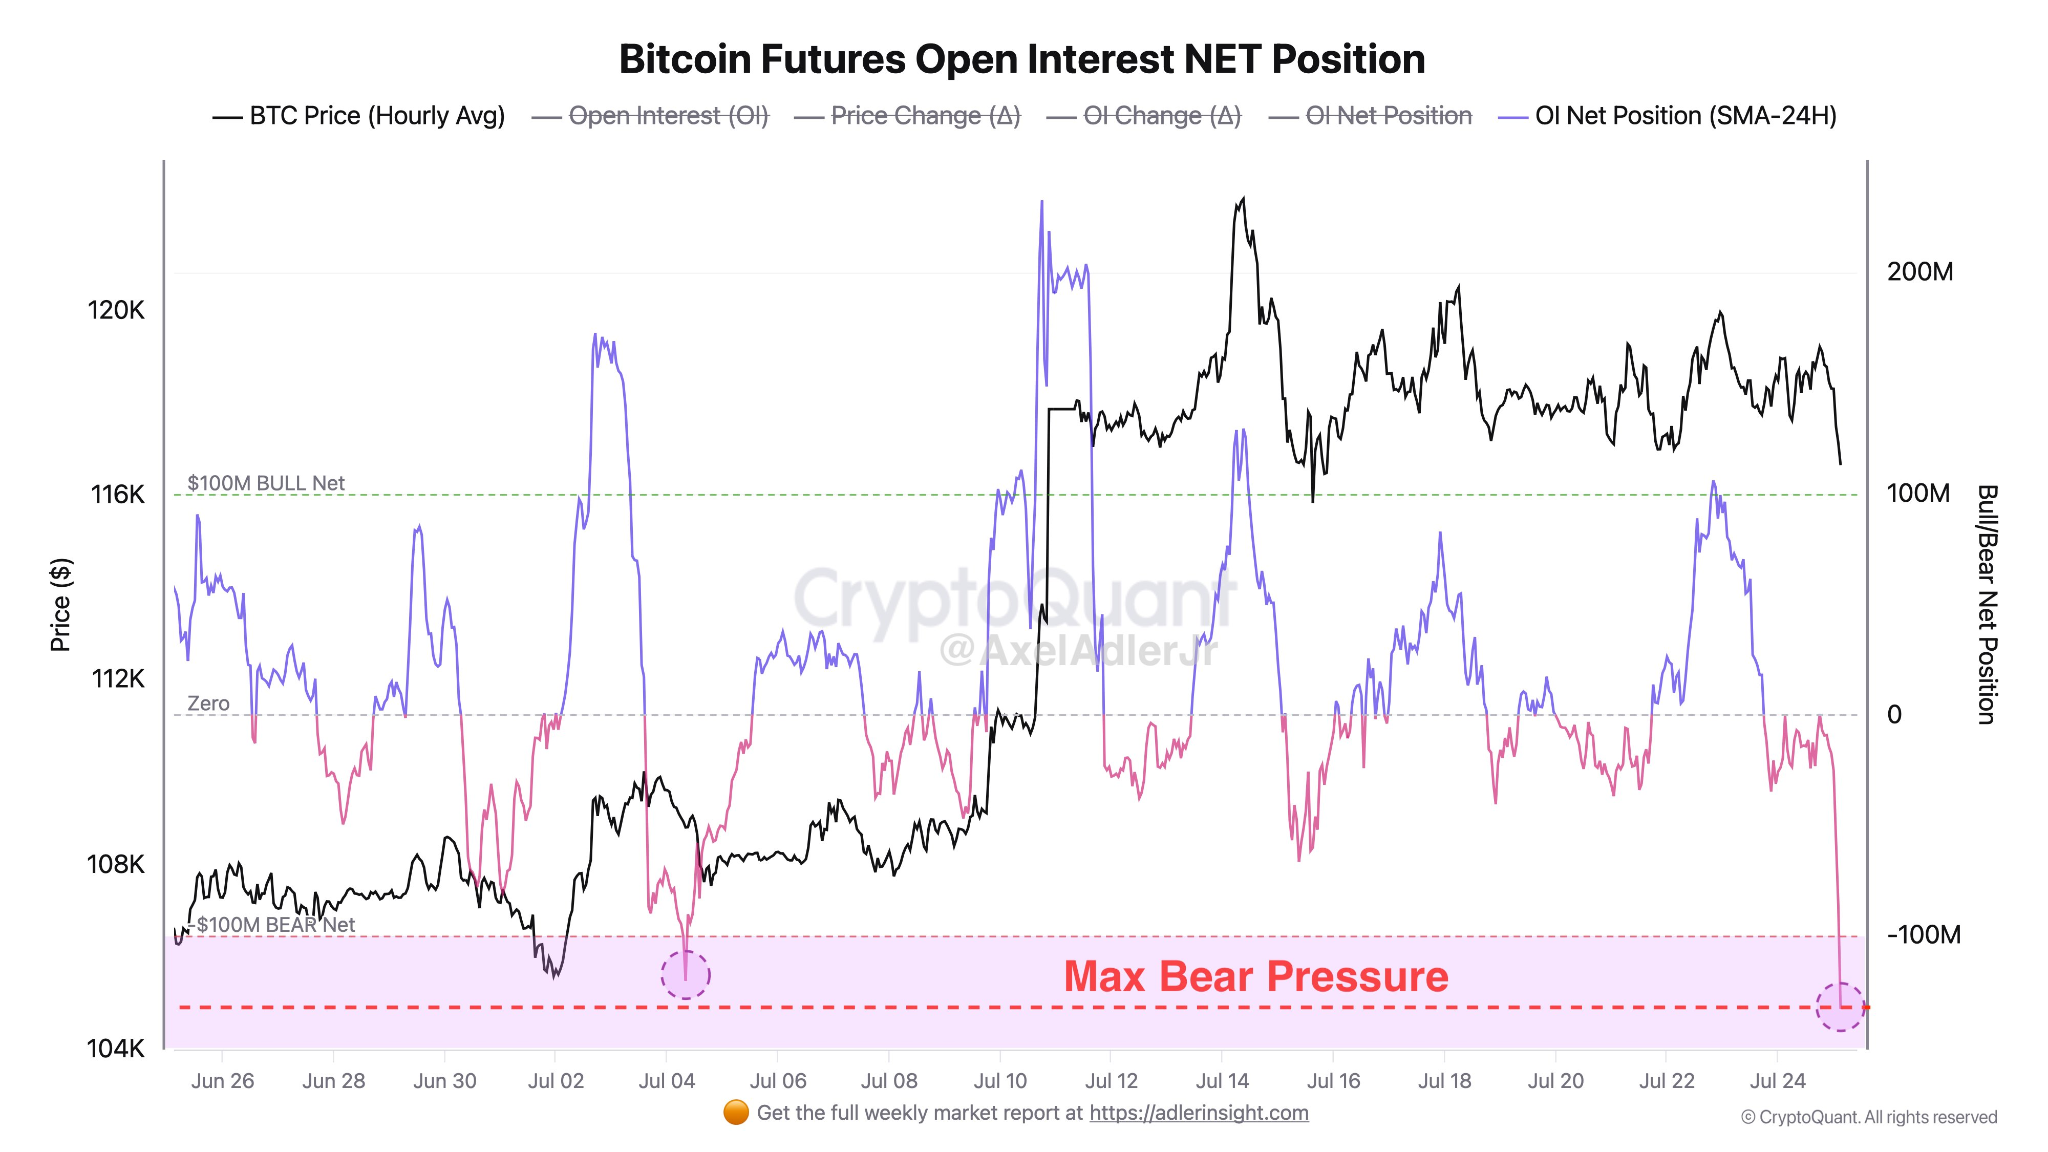
Analysis of potential trigger points: Shorts continue to increase their bets, expecting the price to eventually break down. However, from the perspective of market behavior, the extremely crowded short structure itself is a typical reverse signal - once the price starts to rebound, the large-scale stop-loss liquidation of shorts will form a "short squeeze" effect, pushing the price up explosively. The core observation point of the current market is whether Bitcoin can effectively break through the resistance range of $116,000-118,000 and ignite this "short powder keg".
Signal 2: Whales are selling at a high price, Galaxy Digital transfers another 3,700 BTC
While the futures structure is highly tight, the “real” variables on the chain - the behavior of whales holding coins - do not provide any breathing space for bulls.
On-chain data shows that an old wallet address holding more than 80,000 BTC has been continuously transferring assets to exchanges and new addresses since July 15. The address was later identified as being hosted by Galaxy Digital, which is assisting in selling the assets obtained from early mining in batches.
Latest trends and holdings perspective:
- As of July 24, more than 68,000 BTC have been confirmed to have been transferred out, flowing into exchanges such as Binance, Bitstamp, OKX, Bybit and new addresses of suspected OTC buyers.
- In just 24 hours, the address distributed another 3,715 BTC (about $428 million) to 12 new addresses.
- The wallet currently still holds 18,504 BTC, worth more than $2.1 billion.
Market interpretation and strategic impact: For the market, Galaxy's unliquidated positions are still a "Sword of Damocles" hanging high. Although the current price has not dropped significantly, the real selling pressure on the chain is far from over, which provides the confidence for the shorts to maintain their positions. It is worth noting that its transfer rhythm (small batches, multiple batches) shows that it adopts a "mild but persistent" distribution strategy , aiming to avoid concentrated selling to impact the market. Although this strategy alleviates the short-term stampede risk, it may prolong the suppression period and delay the time window for the market to completely strengthen.
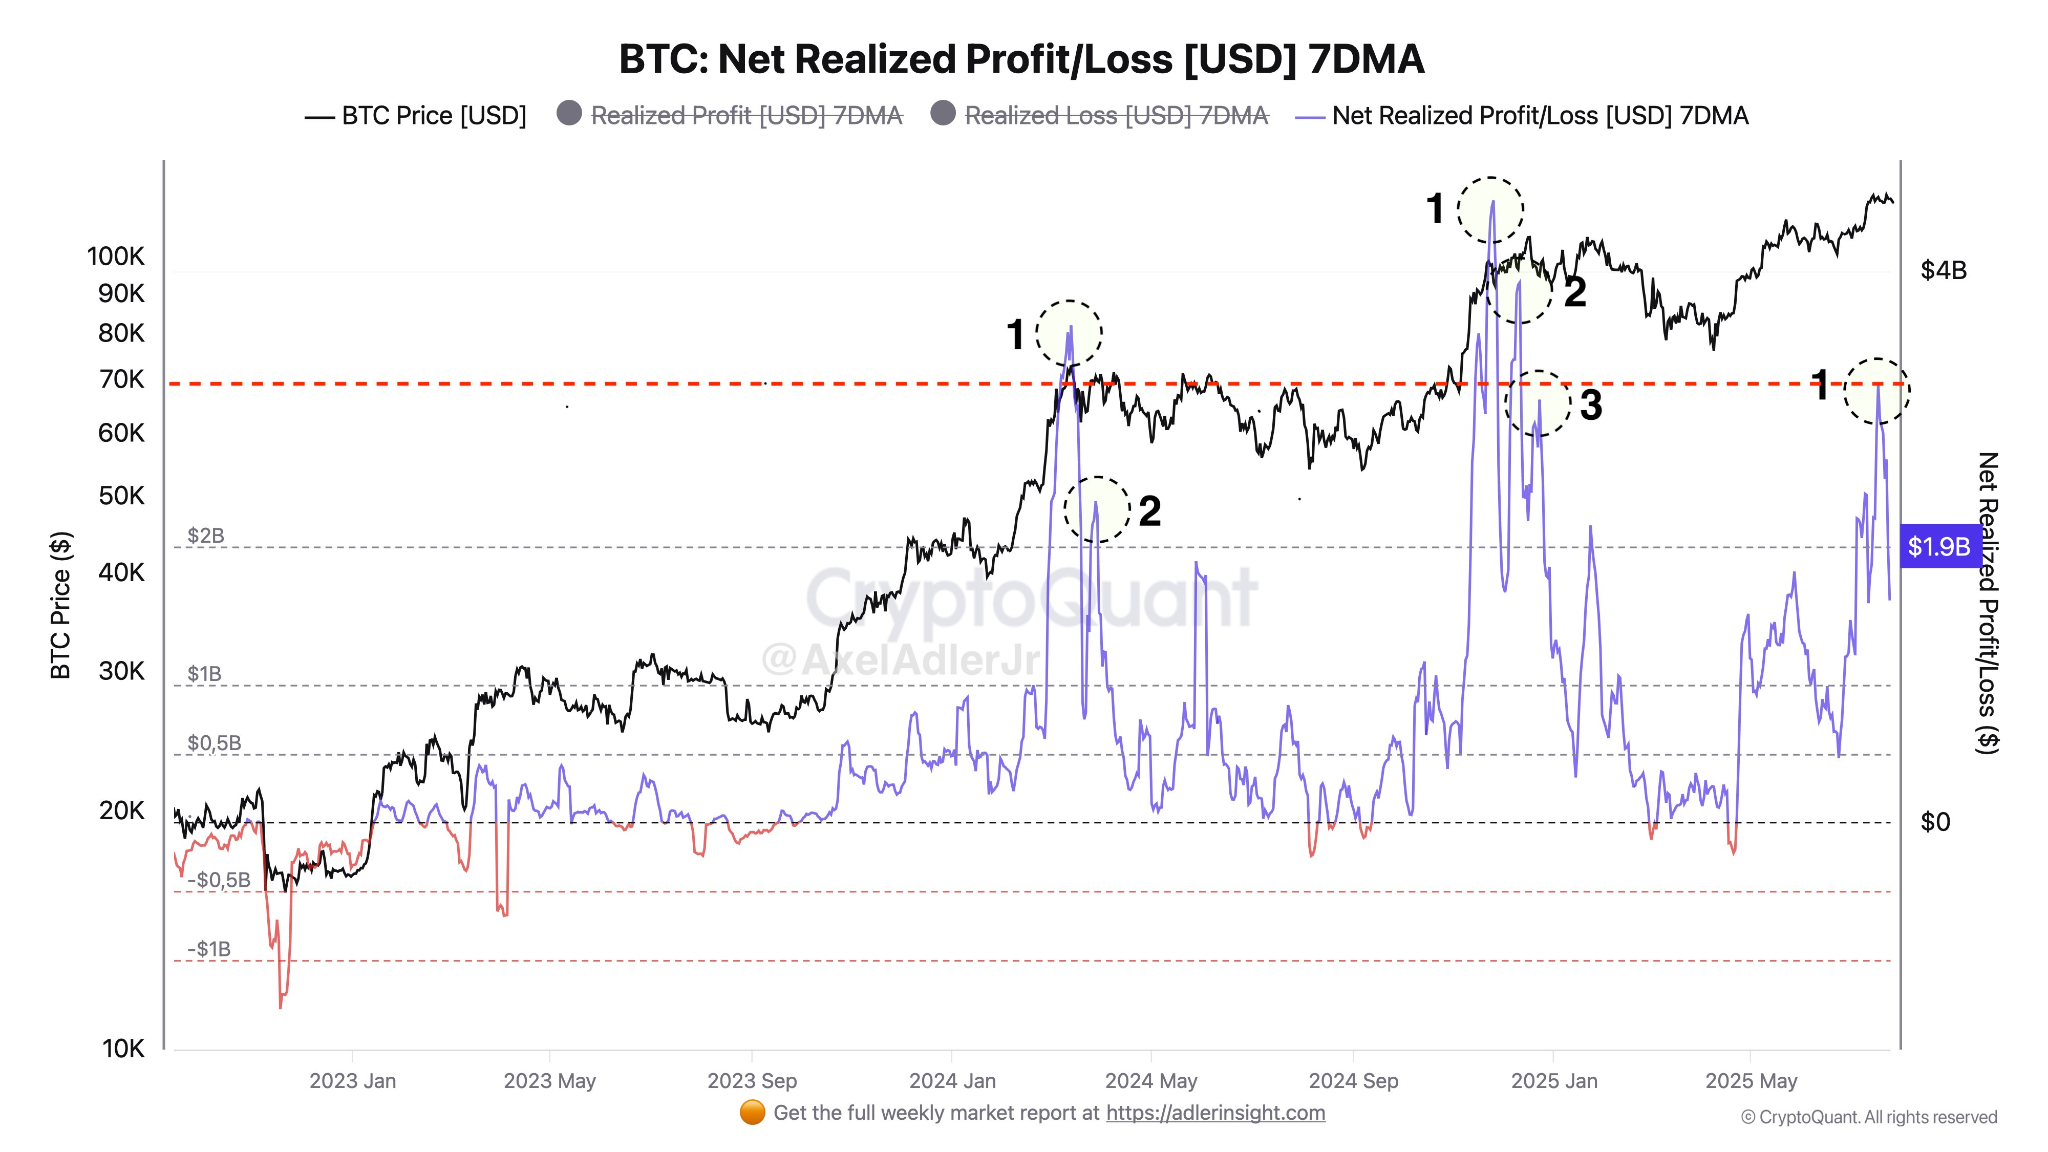
Signal 3: Profits are being cashed out, 7-day PNL hits the second highest level of the year
The third major warning signal on the chain has emerged: Bitcoin’s 7-day average net realized profit (PNL) soared to $1.9 billion on July 24, the second highest point since 2025, second only to the peak in March.
Historical backtesting associated risks: The past three similar profit realization peaks (November 2023, March 2024, and January 2025) all indicate the formation of a staged top to varying degrees. The internal logic is that high prices prompt holders to concentrate on realizing profits. If the subsequent buying is insufficient, the selling pressure will self-reinforce, forming a "profit-taking top".
Current Assessment and Warning:
- Although the BTC price has not reached a new high, the PNL indicator has risen rapidly, indicating that a large amount of funds have chosen to cash in early .
- Part of the selling may come from long-term holders (LTH) who have held the currency for more than 1 year. Their outflow often suggests that the confidence of medium-term traders is loosening.
- Key divergence point: Although the cashing scale of $1.9 billion has not reached the historical peak and belongs to the category of "healthy adjustment", if the indicator continues to rise in the next few days and the price stagnates, it may confirm the risk of a reversal of long and short forces.
High-pressure market: long-short game at the critical point
The current market presents a typical "triple critical" high-pressure structure: futures short leverage reaches its peak, on-chain profit-taking accelerates, and whale real selling pressure remains unresolved. Any sudden change in a single variable is enough to break the current fragile balance and trigger a new round of market conditions.
The core logic of the long-short confrontation:
- Short view: BTC price is constrained by the resistance level of $118,000, the Galaxy balance is not cleared, and the PNL is high. The downside risk still exists.
- Bulls rely on: Betting on excessive short leverage (short squeeze potential), marginal decreasing selling pressure and accumulation of structural rebound potential.
Historical experience and path deduction: This kind of high-pressure state is difficult to maintain for a long time. The key watershed is:
- If the $112,000 support level is effectively broken, the short-term downward trend will be confirmed.
- If the $118,000 resistance zone is broken through strongly, it may trigger large-scale short stop-loss liquidation, pushing prices up rapidly.
Investor strategy recommendations:
Faced with high uncertainty, short- and medium-term investors should not place heavy bets on a single direction . Compared with "chasing up and selling down", reducing leverage, closely tracking capital movements and technical structure changes, and waiting for directional signals to become clear before making decisions are more prudent strategic choices.
Conclusion: Avoid one-sided bets and keep your strategy flexible
The Bitcoin market is at a critical moment of extreme confrontation between long and short structures . This is not a period of unilateral bull market acceleration, nor a period of bear market confirmation, but a typical "oscillation convergence" window.
On the one hand, the basic indicators on the chain (such as active addresses and transaction frequency) have not declined significantly, indicating that the market is still vibrant; on the other hand, the position structure, price momentum and sentiment indicators are simultaneously on the verge of limits. Any leading force (long/short) that breaks first may trigger a chain reaction of technical breakouts and capital stampedes.
The market has no lack of momentum for direction selection, but only lacks the opportunity to make the final move. This opportunity may come from a sudden macro-good news, a whale liquidation, or a round of concentrated liquidation.
Before the trend is settled, it is better to keep the strategy flexible than to bet blindly on the direction.


