Data interpretation of Ethereum after the surge and rebound: the ecological cold and hot faults behind the value reconstruction
Original author: Frank, PANews
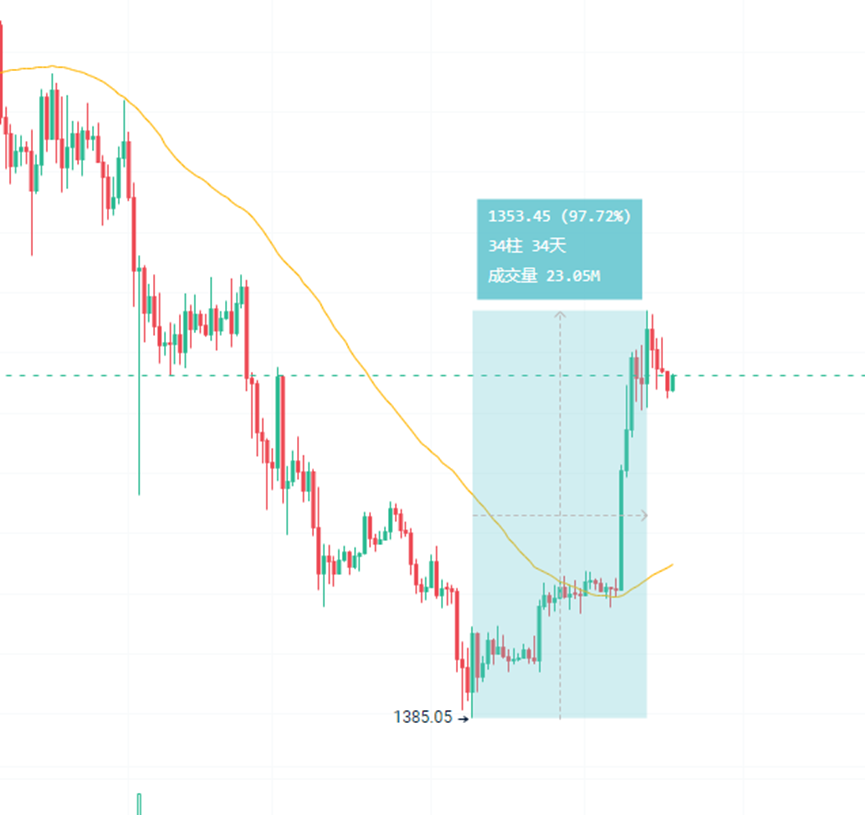
When the price of Ethereum rebounded from a low of $1,385 to $2,700, the 97.7% increase was due to a capital split. Institutional funds remained cautious in the ETF market, but the position of derivative contracts hit a historical peak of $32.2 billion. After a long period of depression, the market hopes to prove that Ethereum is still a value trough through this rebound, and the Pectra upgrade seems to provide evidence for this narrative. PANews attempts to outline the current true state of Ethereum through a comprehensive interpretation of Ethereum data. An Ethereum that is undergoing value reconstruction is gradually emerging.
Markets and funds: ETFs’ caution and contracts’ enthusiasm
As of May 18, the total net asset value of the US ETH ETF reached 8.97 billion US dollars. It accounts for 2.89% of the total market value of Ethereum. Compared with the 5.95% of Bitcoin ETF, this proportion is still low. Overall, it seems that Bitcoin is still more popular in the ETF market.
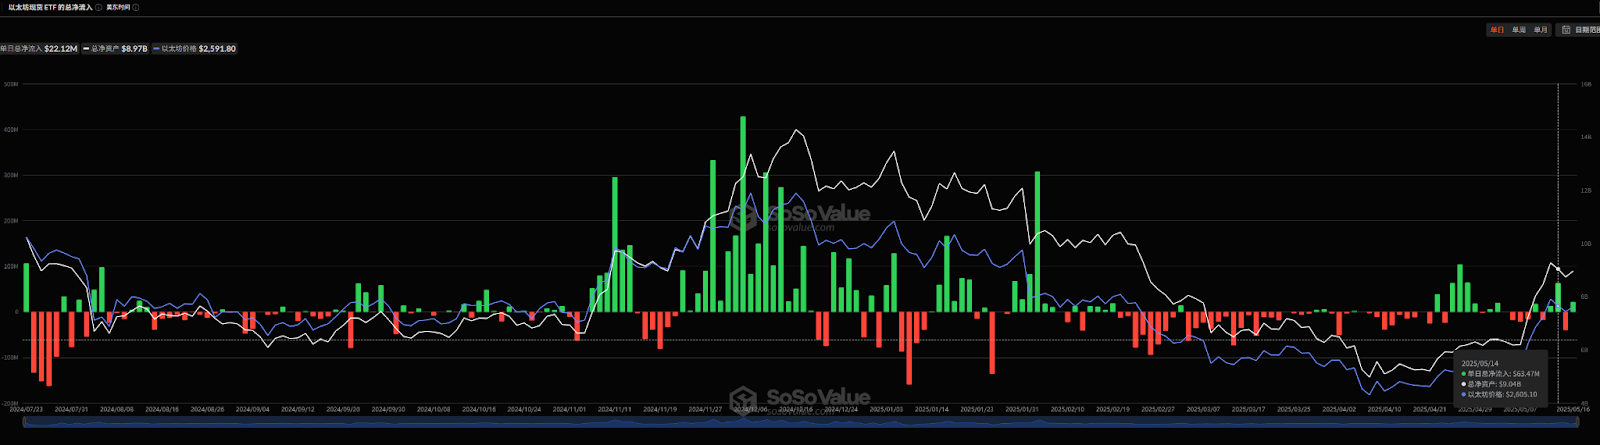
In addition, from February to the end of April, the funds of Ethereum ETF were mostly in outflow. It was not until April 21 that it began to flow back again, but the overall return data was not obvious. The net inflow of Ethereum ETF in April was about 66.25 million US dollars, and the net inflow so far in May was about 30 million US dollars.
According to data from Glassnode, it was also at the end of April that Ethereum's "Net Unrealized Profit/Loss" (NUPL) value reversed to a positive number again. Prior to that, between April 1 and 22, the NUPL value was always negative. During this period, the price of Ethereum fell below $1,800, with the lowest price dropping to $1,385. That is to say, when the price of Ethereum fell below $1,800, the overall holding addresses were basically in a loss state. However, this negative data sometimes also indicates a signal of the market bottom, because the selling pressure is close to exhaustion at this stage. However, as of May 17, the NUPL value reached a maximum of 0.328. Judging from the range of values, it is still in the early stage of the bull market or the recovery period, and has not yet reached an extremely optimistic stage.
Another interesting data is that the number of addresses with a balance greater than 1 on the Ethereum chain has fallen as the price rebounded. In the previous price decline, this data has been rising, indicating that many investors still choose to buy at the bottom in the downward phase. When the price rose to $1,800, some addresses chose to profit and exit. However, this proportion did not drop very high, only about one thousandth. As the price rebounded, the current percentage of profitable addresses in Ethereum has reached 60%.
Although the recent price rebound is still far from the historical high, the contract open interest has reached a historical high recently. On May 14, the Ethereum contract open interest reached 32.249 billion US dollars, which is almost the highest contract open interest level in history. The last time the contract volume reached this value was in January to February 2025, when the price of Ethereum fluctuated between 3,000 and 3,800 US dollars. It can also be seen that the market is still very keen to bet on Ethereum.
Overall, looking at the market and funding data, Ethereum began to see a positive inflow of funds at the bottom of the price range at the end of April, and the price subsequently saw a sharp rise, with the highest increase reaching 97.7%, nearly doubling. However, judging from the inflow of funds, especially the flow of ETF funds, the proportion of increased funds from traditional institutions is still not high.
TVL rebounds, but low gas fails to activate transaction volume
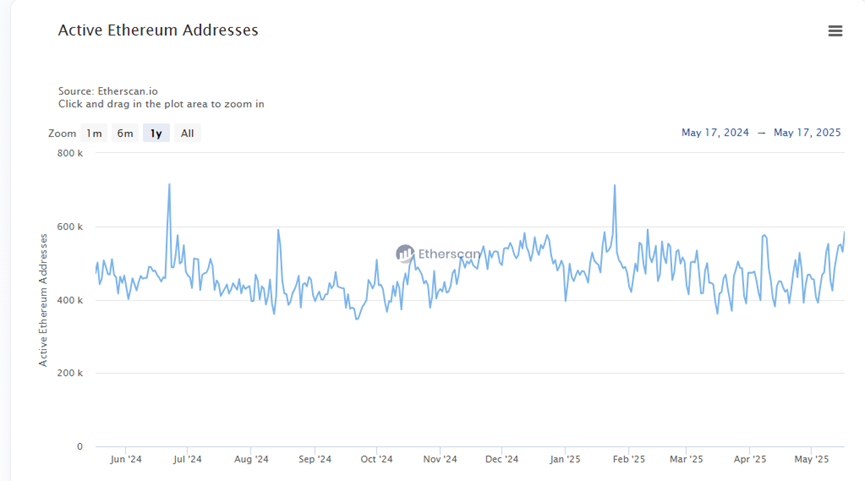
From the perspective of on-chain activity, the change in Ethereum active addresses is not obvious, and the current value is still fluctuating between 400,000 and 600,000 per day. This fluctuation pattern has been maintained for more than a year, but the recent fluctuation curve has broken through the 600,000 range.
Another important data, TVL, has a more obvious trend of change. TVL in US dollars has rebounded since April 22, rising from around US$4.5 billion to around US$64.6 billion. However, considering the sharp rise in Ethereum prices during this period, this change may not reflect the real situation on the chain. After switching the ETH amount, it can be seen that since April 9, the ETH pledged on the Ethereum chain has dropped significantly, from a high of 30.26 million to a low of 24 million, a drop of 20%.
The reason for this phenomenon may be that during the rapid rise in Ethereum prices, some funds chose to take profits or avoid uncompensated losses, resulting in a reduction in the amount of tokens.
As for the changes in Gas, as of May 16, 2025, the average Gas price of Ethereum was 3.572 Gwei, a sharp drop of 21.57% from the previous day, and a sharp drop of 51.76% from last year. The Gas fee has generally been on a downward trend in the past 30 days. It briefly soared to 10.61 Gwei on May 8, but has been maintained below 8 Gwei recently, and was as low as 1.6 Gwei on May 3. This change is related to EIP-7691 in the Pectra upgrade, which aims to reduce L2 fees by expanding blob space.
However, the extremely low gas fee does not seem to have stimulated an increase in on-chain transactions. In terms of the number of daily transactions, no significant changes have been seen.
DEX transactions and asset landscape: Stablecoin dominance and ecological transformation
According to the on-chain staking data, Ethereum's staking has been in a net outflow state from April 15 to May 5. In particular, Coinbase's staking has outflowed 30% in the past six months. Currently, Lido is still the validator with the most staking, with a staking amount of 9.11 million.
In terms of on-chain DEX transaction volume, the Ethereum mainnet has clearly entered an active period after entering 2025. The activity in this cycle is significantly higher than the performance in 2024, close to the peak period from 2021 to 2022. However, judging from the revenue data, the recent increase in trading activity mainly comes from stablecoin-related transactions. USDT has generated $568 million in fees on Ethereum in the past 30 days. As of May 18, Ethereum is still the public chain with the largest issuance of stablecoins, accounting for more than 50%, and the total issuance has reached $127.3 billion, which is twice the Ethereum DeFi TVL.
By analyzing the types of funds on the Ethereum chain, it can be seen that nearly half of the transactions on the Ethereum chain are completed by stablecoins and ETH transfers. And the proportion of stablecoin transactions is obviously increasing, while the proportion of DeFi and ERC-20 token transactions is actually still declining. This also shows that Ethereum is still transforming into the role of an asset value storage center on the chain, while the development of MEME and applications seems to be restricted. From this point of view, Ethereum's strategy of trying to boost activity by reducing handling fees and increasing transaction speed may be difficult to work.
In addition, although the average single transfer amount on Ethereum has also declined recently, it is still between thousands of dollars and $10,000. This data is far ahead of all public chains, and Solana's data is generally only tens of dollars. This shows that Ethereum is an absolute exclusive chain for large users.
In general, the reason behind Ethereum’s recent price rebound is more like the result of the pain of transition. On the one hand, the Ethereum ecosystem has been trying to optimize performance through continuous technical updates and upgrades, but this effort seems to have failed. On the other hand, it is a place where large-scale funds and stablecoin transactions are concentrated, and the big players seem to be very satisfied with the current quiet state of Ethereum on the chain.
Therefore, the rise and fall of a single indicator can no longer simply define the "good" or "bad" of Ethereum. The market may need to go beyond the previous growth narrative and re-examine and understand the core role and long-term value of Ethereum in a multi-chain landscape. Instead of being obsessed with judging whether it is "rising" or "declining", it is better to realize that after all the noise and iterations, a more mature and "stable" Ethereum may be the inevitable direction and final appearance of its evolution.