Coinbase x Glassnode:一季度加密市场投资指南


Original source: CoinbaseGlassnode
Original text compiled by: Yanan, BitpushNews
This guide is a research report jointly created by Coinbase Institutional and Glassnode, which provides institutional investors with an in-depth analysis of the most critical encryption market indicators and trends.
market Overview
Cryptocurrency total market capitalization
The total market capitalization of cryptocurrencies is an important indicator reflecting the market value of global digital assets, covering Bitcoin (BTC), Ethereum (ETH), tokens, and stablecoins. In 2023, driven by the strong performance of Bitcoin and Ethereum, the total market value of cryptocurrencies increased by more than 108%.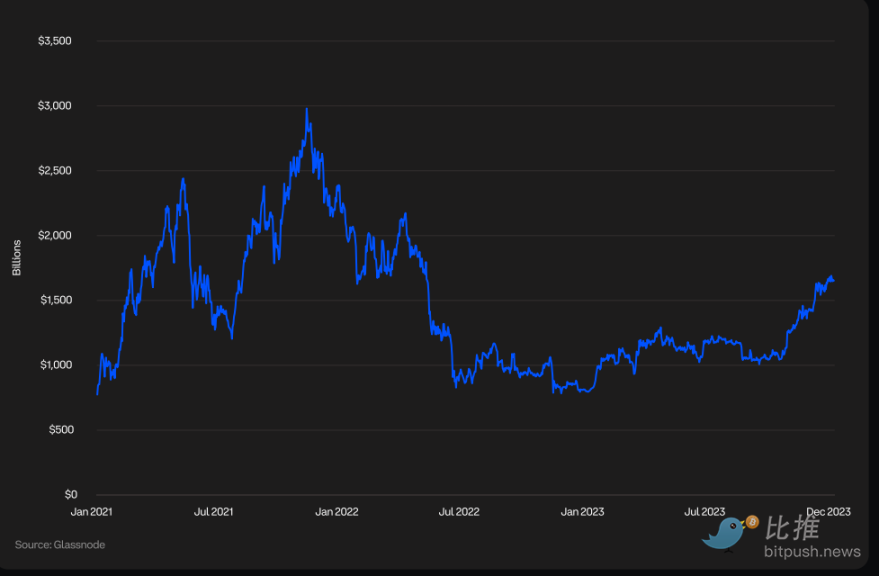
Cryptocurrency Dominance
Cryptocurrency dominance measures the market capitalization of a specific cryptocurrency as a percentage of the total market capitalization of all cryptocurrencies. In 2023, Bitcoin’s dominance increased as the market became increasingly bullish on the prospect of Bitcoin spot ETF approval and funds moved to quality assets. Some market participants also view Bitcoins April 2024 halving as a potential price increase catalyst.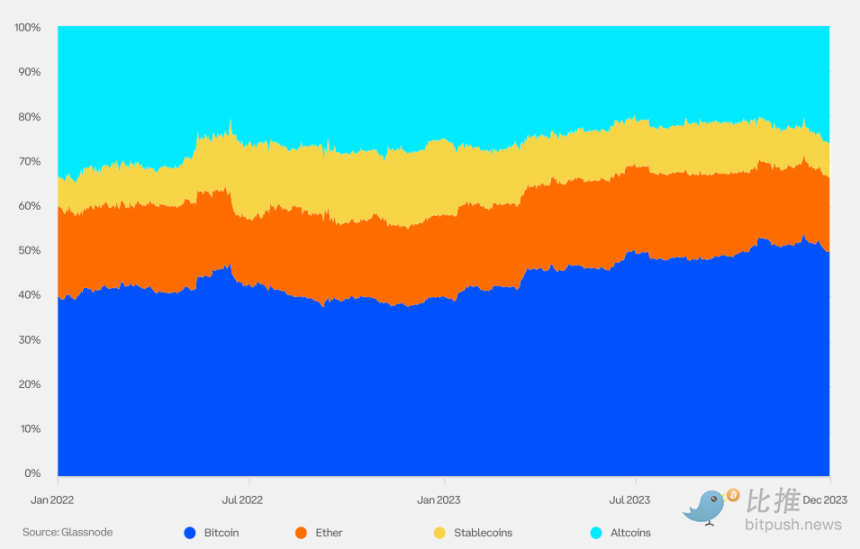
Correlation
Historically, cryptocurrencies have had low correlations with traditional asset classes. 2022 was an exception, when almost all assets fell simultaneously, but the market returned to historical norms in 2023, indicating that cryptocurrencies will become one of the sources of non-systemic risk.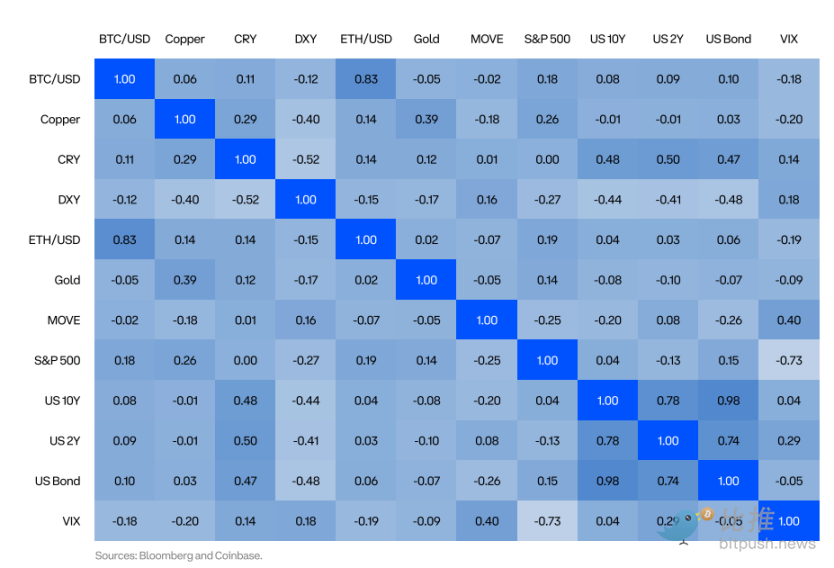
Portfolio Diversification
Allocation to cryptocurrencies can help traditional portfolios diversify risk and enhance returns. In this table, we analyze the 60% MSCI ACWI (Translators Note: MSCI ACWI is a global stock index launched by Morgan Stanley Capital International (MSCI), the full name is MSCI All Country World Index.) and 40% The effect of a small allocation to the Coinbase Core Index (COINCORE) in a portfolio composed of the US Agg (Translators Note: refers to a broad index of the US bond market, the full name is Bloomberg Barclays US Aggregate Bond Index.). COINCORE is a market capitalization-weighted cryptocurrency index that is rebalanced quarterly, with the weights of Bitcoin and Ethereum accounting for 65.3% and 28.7% respectively, and the two together account for nearly 94%. The set period is from March 2018 to October 2023, covering the two main fluctuation cycles of the cryptocurrency market. The results show that adding COINCORE improved both the absolute and risk-adjusted returns of the portfolio.
Stablecoin circulating supply
A stablecoin is a digital currency designed to maintain a stable value. They are usually pegged to the U.S. dollar or other fiat currencies at a fixed exchange rate of 1:1 and hold corresponding reserve assets. Stablecoins backed by fiat currencies dominate the stablecoin market. When evaluating stablecoins, market participants should focus on the quantity and type of reserve assets.
Bitcoin
BTC Price and Market Cap
In 2023, the price of Bitcoin increased by more than 155%. Market participants are encouraged by a number of factors, including the slowing pace of inflation and the increased likelihood of approval of spot cryptocurrency exchange-traded funds (ETFs).
BTC price performance since cycle lows
Bitcoin has gone through four complete bull and bear cycles. In this chart, we can observe how the current market cycle, which begins in 2022, compares to previous cycles.
Bitcoin entity holdings adjusted net unrealized profit and loss (NUPL)
Net unrealized profit or loss (NUPL) is the difference between relative unrealized profits and relative unrealized losses. Adjusted NUPL excludes transactions between addresses of the same entity (internal transactions) to more accurately measure actual economic activity and provide more optimized market signals than unadjusted NUPL.
BTC supply profitability
The circulating supply of a cryptocurrency is made up of a losing supply (all coins with a cost basis above the current spot price) and a profitable supply (all coins with a cost basis below the current spot price). Observing supply profitability can help reveal where cryptocurrency prices are in the current market cycle. Previous cryptocurrency market cycles have been characterized by three phases:
Bottom discovery period: In the final stages of a bear market, when long-term price depreciation causes the proportion of losing supply to increase (the percentage of profitable supply is < 55%).
Mania: During a bull market, when prices exhibit a parabolic upward trend, the proportion of profitable supply dominates (% of profitable supply > 95%).
Bull-Bear Transition: The transitional period between the bottom discovery period and the mania period, when supply profitability is closer to equilibrium (the percentage of profitable supply is between 55% and 95%).
BTC daily active addresses
The number of active addresses refers to the number of unique addresses that remain active as senders or receivers on the network. This metric is crucial for measuring user acceptance, network status, and economic activity.
BTC daily active entities
Although the number of active addresses is an important metric, a single entity can have multiple addresses, so we also need to focus on the number of active entities. An entity is defined as a set of address clusters controlled by the same network entity, and these address clusters are estimated through advanced heuristics and Glassnodes proprietary clustering algorithm. Here, advanced heuristics refer to a sophisticated method or technique based on experience, knowledge, and observation patterns for making estimates or decisions with incomplete information.
Total supply of BTC held by long-term holders
Glassnode defines long-term holders (LTHs) as investors who have held cryptocurrencies for at least 155 days. This holding period usually means the assets are less likely to be sold. Therefore, observing the activity patterns of long-term holders can be an effective indicator of predicting cyclical fluctuations in the cryptocurrency market, helping to identify potential peaks and troughs.
BTC annualized 3-month volatility
As cryptocurrencies mature as an asset class and institutional participation increases, their volatility has shown a steady downward trend.
BTC Monthly Realized Volatility Bands
This chart uses Bollinger Bands to analyze one-month realized volatility to identify potential volatility turning points. If volatility deviates more than one standard deviation from the one-month mean, a reversal is more likely.
BTC Realized Price and MVRV
Realized price refers to the average price of a cryptocurrency’s supply, calculated as the value of each coin on the day it was last traded on-chain; it is often considered the market’s on-chain cost basis. MVRV is the abbreviation of Market Value to Realized Value; it represents the ratio between market value (spot price) and realized value (realized price). An MVRV of 2.0 means that the current price is twice the markets average cost basis (the average holder earns twice as much).
An MVRV of 1.0 means that the current price is equal to the markets average cost basis (the average holder is at the break-even point).
An MVRV of 0.50 means that the current price is 50% below the markets average cost basis (the average holder loses 50%).
Extreme MVRV values can reveal periods of overheating or undervaluation in the market, as well as periods when investor profits were well above or below average (i.e., realized prices).
BTC MVRV Momentum
This chart shows the MVRV ratio along with the six-month simple moving average (SMA) used as a momentum indicator. Periods in which the MVRV is above the six-month SMA typically describe an uptrend in macro markets, while periods below the line generally describe a downtrend.
Cycle turning points are typically marked by a strong breakout of MVRV above the six-month SMA. A strong breakout above the SMA indicates large amounts of BTC were acquired at levels below current prices, while a strong breakout below the SMA indicates large amounts of BTC were acquired at levels above current prices.
BTC Derivatives
BTC futures trading volume
Crypto futures trading volumes are divided into traditional futures (also known as period or calendar futures) and perpetual futures (perps), the latter of which are unique to cryptocurrencies. Perpetual futures have no expiration date, so holders do not need to roll over.
BTC Futures Open Interest
Although perpetual futures are the mainstay of BTC futures trading, traditional futures still occupy an important position in BTC futures open contracts due to their wide application in hedging and spot arbitrage trading.
BTC futures annualized rolling basis (3 M)
Basis in the cryptocurrency market has historically been positive (barring market dislocations). Extreme swings in basis, whether positive or negative, are often associated with large swings in market sentiment.
BTC Perpetual Futures Funding Rate
Perpetual futures have no set expiration date, so holders do not need to perform rollover operations. In order to maintain a reasonable gap between the price and the spot price, perpetual futures introduces a funding rate mechanism. This rate shifts periodically between longs and shorts: longs pay shorts when the funding rate is positive; shorts pay longs when the funding rate is negative.
BTC Perpetual Futures Clearing
Liquidation refers to the forced liquidation of a futures position by an exchange due to a partial or complete loss of the initial margin. Massive liquidations could signal the top or bottom of a sharp price move.
BTC Options Open Interest
Options open interest increased in 2023 as institutional investors increasingly entered the space. In October 2023, BTC options’ open interest exceeded BTC futures for the first time.
BTC Traditional Futures Specifications
Bitcoin futures are offered by multiple exchanges and come in different sizes and denominations.
The next market event BTC will face: Bitcoin halving
We predict that the upcoming Bitcoin halving in the second quarter of 2024 may boost the token performance. Still, this association is speculative because supporting evidence is limited. There have only been three halvings in history, and a completely clear pattern has yet to emerge, especially given that previous events were affected by a variety of factors, including global liquidity measures.
Ethereum
Ethereum (ETH) Price and Market Cap
In 2023, the price of Ethereum (ETH) rose by more than 90%. Market participants were encouraged by the success of the Shapella upgrade and the increasingly clear prospects of approval of cryptocurrency spot-traded open-end index funds (ETFs).
Price performance since cycle low
Ethereum has gone through two complete bull and bear cycles. In this chart, we can observe how the current market cycle, which begins in 2022, compares to previous cycles.
Ethereum Unrealized Net Profit and Loss (NUPL)
Net unrealized profit or loss is the difference between relative unrealized profits and relative unrealized losses.
Ethereum (ETH) Supply Profitability Status
The circulating supply of a cryptocurrency is made up of a losing supply (all coins with a cost basis above the current spot price) and a profitable supply (all coins with a cost basis below the current spot price). Observing supply profitability can help reveal where cryptocurrency prices are in the current market cycle. Previous cryptocurrency market cycles have been characterized by three phases:
Bottom discovery stage: In the final stage of the bear market, when long-term price depreciation causes the proportion of loss supply to increase (profit supply percentage < 55%), the market enters the bottom discovery stage.
Mania Phase: When a parabolic price upward trend occurs during a bull market, the proportion of profitable supply dominates (profitable supply percentage > 95%), and the market enters the mania phase.
Bull-Bear Transition Phase: This is the transitional period between the bottom discovery phase and the mania phase, when the profitable state of supply is closer to equilibrium (the percentage of profitable supply is between 55% and 95%).
Ethereum (ETH) weekly active addresses
The number of active addresses refers to the number of unique addresses participating in activities on the network as senders or receivers. It is an important indicator of user adoption, network health, economic activity, and more.
Ethereum annualized 3-month volatility
As cryptocurrencies mature as an asset class and institutional participation increases, volatility is on a steady downward trend.
Ethereum Monthly Realized Volatility Bands
This chart uses Bollinger Bands to analyze one-month realized volatility to identify potential volatility turning points. If volatility deviates more than one standard deviation from the one-month mean, a reversal is more likely.
Ethereum (ETH) Realized Price vs. MVRV
Realized price refers to the average price of a cryptocurrency’s supply, calculated as the value of each coin on the day it was last traded on-chain; it is often considered the market’s on-chain cost basis. MVRV is the abbreviation of Market to Realized Value, which represents the ratio between market capitalization (spot price) and realized value (realized price).
An MVRV of 2.0 means that the current price is twice the markets average cost basis (the average holder earns twice as much).
An MVRV of 1.0 means that the current price is equal to the markets average cost basis (the average holder is at the break-even point).
An MVRV of 0.50 means that the current price is 50% below the markets average cost basis (the average holder loses 50%).
Extreme MVRV values help identify periods of overheating or undervaluation in the market, as well as periods when investor profitability deviates significantly from the mean (realized price).
Ethereum (ETH) MVRV Momentum
This chart shows the MVRV ratio along with the six-month simple moving average (SMA) used as a momentum indicator. Periods in which MVRV is above the six-month SMA typically describe an uptrend in macro markets, while periods in which it is below typically describe a downtrend.
Cycle turning points are often characterized by a strong breakout of MVRV above the six-month SMA. A strong breakout above the SMA indicates a large amount of ETH was purchased below the current price, while a strong breakout below the SMA indicates a large amount of ETH was purchased above the current price.
Ethereum (ETH) total staked value
Staking is an investment method in proof-of-stake (PoS) blockchains, where token holders pledge assets to secure the network and receive additional tokens as rewards. In order to stake ETH, holders need to stake at least 32 ETH and run a validator node.
Total locked value of Ethereum (ETH) in DeFi
Total Locked Value (TVL) is the total value of assets locked by smart contracts on the Ethereum blockchain or deposited in decentralized applications, covering ETH, stablecoins and various tokens. It is an important indicator for evaluating financial activities and liquidity within the Ethereum ecosystem.
Ethereum (ETH) Derivatives
Ethereum perpetual futures trading volume
Crypto futures trading volume is divided into traditional futures (also known as period or calendar futures) and perpetual futures (perps), the latter of which is unique to cryptocurrencies. Perpetual futures have no expiration date, so holders do not need to roll over. The trading volume of Ethereum futures is dominated by perpetual futures.
Ethereum perpetual futures open interest
Ethereum futures positions are mainly concentrated in perpetual futures, while the trading volume of traditional futures is relatively small.
Ethereum futures annualized rolling basis (3 M)
Basis in crypto markets is generally positive. Its extreme fluctuations, whether positive or negative, are often closely linked to dramatic changes in market sentiment.
Ethereum Perpetual Futures Funding Rate
In order to maintain a reasonable gap between the price and the spot price, perpetual futures introduces a funding rate mechanism. This rate shifts periodically between longs and shorts: longs pay shorts when the funding rate is positive; shorts pay longs when the funding rate is negative.
Ethereum (ETH) options open interest (weekly)
Open interest in Ethereum options hit an all-time high in the fourth quarter of 2023, as market participants became increasingly bullish on the prospects for spot ETFs and Ethereums development in 2024.
Ethereum (ETH) Traditional Futures Specifications
Ethereum futures are offered by multiple exchanges and come in different sizes and denominations.
The next market events for Ethereum (ETH)
After the successful completion of the Shapella upgrade, the Ethereum community is eagerly awaiting the arrival of the Cancun (Decun) upgrade, which is expected to be implemented in the first quarter of 2024. The Cancun upgrade will mainly enhance the scalability and security of the Ethereum network by introducing Proto-Danksharding. The design goal of Proto-Danksharding is to significantly reduce the fees for second-layer transactions and significantly increase the transaction processing capacity per second of the Ethereum network.