BTC Falls to $68K, a 3-Month Low; AI Capital Flows Have Not Returned to Crypto


- Core View: Bitcoin is under short-term pressure, and its trading behavior is that of a high-beta liquidity asset rather than digital gold. Nvidia's CEO departure served as the trigger, but the real drivers are ETF institutional outflows, shrinking stablecoin supply, and elevated real interest rates. Until capital flows reverse, any rebound will be sold into.
- Key Elements:
- Bitcoin fell below $70,000, hitting a low of $68,307, down 7% in 24 hours and 15% for the week, marking its lowest level since August.
- U.S. spot Bitcoin ETFs saw net outflows of $1.44 billion over five consecutive days, with IBIT recording $2 billion in outflows over nine days, putting 2026 on track for its first full-year net outflow.
- Total stablecoin supply shrank by $14.2 billion over 30 days, the largest decline since 2022, indicating capital is leaving the market rather than waiting on the sidelines.
- The 10-year U.S. Treasury yield rose to 5.07%, the dollar index stood at 103.08, and gold and Bitcoin fell in tandem by about 3.4%, both being repriced as zero-yield assets.
- Liquidations totaled $1.46 billion in 24 hours, of which $1.3 billion were longs; open interest remains above $50 billion, leaving cascade risk in place.
- Technically, the price has broken below all daily EMAs and the lower Bollinger Band, with key support at $70,000; the upside target of $82,300 requires capital flows to turn positive.
Original article from TradingNEWS, author Itai Smidt
Compiled by|Speedster@Odaily

On November 13 (Beijing time), Bitcoin fell below $70,000, hitting a low of $68,307, a 24-hour drop of 7%, marking its lowest level since August 19. The weekly picture is even uglier: Bitcoin is down 15% from the same day last week and is on track for a sixth consecutive weekly decline.
Where Is the Selloff Coming From?
The trigger was not inside crypto. At 8:59 a.m. ET, Nvidia (NVDA) announced that Jensen Huang had resigned as President, CEO, and board member, effective immediately. The stock opened down 14%, and the selloff spread to every asset priced on AI enthusiasm and liquidity. Bitcoin immediately fell below $73,000 after the announcement, lost $72,000 within the first hour of trading, and hit its lowest level since August.
The cross-asset pattern defined the trade. The Nasdaq Composite fell 0.63% to 25,306.18; gold fell 3.39% to $3,864.80; Bitcoin fell 3.41%. When the safe-haven metal and the risk asset fall by the same percentage on the same morning, the market is not choosing between risk-on and risk-off. It is selling everything that does not generate yield, because the 10-year Treasury yield is 5.07%.
That is the thesis for this forecast. Bitcoin trades as a high-beta liquidity asset, not digital gold. Huang's departure was the fuse, but the steady drivers are institutional outflows from spot ETFs, a shrinking stablecoin base, and real interest rates that make holding zero-yield assets expensive. Until at least one of these three turns, rallies will be sold.
The upside scenario exists, and the path is clear. Bitcoin has fallen below the lower Bollinger Band, and intraday momentum is oversold. If it reclaims the moving average cluster between $76,230 and $78,905, the upper band at $82,700 becomes the target. Getting there first requires a shift in fund flows.
Nvidia CEO Shock and the Transmission of AI Liquidity into Crypto
The Nvidia event hit Bitcoin through three channels, and all three were operating simultaneously on Thursday morning.
The first is pure correlation. For most of 2026, Bitcoin and the Nasdaq have traded as the same risk complex, and Nvidia sits at the center of that complex. When the world's second-largest company by market cap opens down 14% and sheds more than $550 billion in market value since Sunday, every leveraged long portfolio tied to growth assets gets marked down at the same time.
The second is crypto-native. Tokenized equity exposure now trades around the clock on crypto derivatives venues. Within minutes of the resignation announcement, NVDA perpetual contracts on one on-chain exchange plunged 12% to $160.99. A single long holding 9,959 NVDA contracts was liquidated for a $1.54 million loss; another position worth $31 million was underwater. These losses hit margin accounts that also hold Bitcoin and Ethereum. When collateral on one leg shrinks, platforms sell the other legs to cover margin.
The third is about funding. Nvidia has been using its balance sheet to finance infrastructure around its own chips, including a $2 billion investment in new cloud provider Nebius (NBIS) in March. The market had already begun questioning this circular financing model. With an interim CEO in place, investors started asking whether these funding commitments would contract. Any contraction would tighten financing for AI infrastructure, and much of the speculative capital that flowed into crypto this year has already rotated into the AI trade. If AI wobbles, that money does not come back to Bitcoin; it exits risk assets entirely.
Thursday's numbers line up. CoreWeave (CRWV) fell as much as 13.6%, and Nebius dropped 16.2%. Memory chip maker SanDisk (SNDK) fell 6% to 8.5%. The stocks with the deepest leverage to AI capital fell the hardest, and Bitcoin fell along with them.
One detail matters for the forecast: equities are rotating within AI, not away from it. Broadcom (AVGO) rose 5.6%, AMD rose 3.7%, and traders are betting on Nvidia's rivals. Crypto has no such rotation option—there is no "Broadcom of Bitcoin" to absorb the money. The shock that equity traders can sidestep becomes a direct selloff in crypto.
Nvidia's November 17 earnings report is now also a crypto catalyst. A clean report under interim CEO Colette Kress would stabilize the AI complex, and Bitcoin's correlation would then help it on the way up.
Spot ETF Outflows: $299.9 Million on November 11, $1.44 Billion Over Five Sessions
The most consistent pressure on Bitcoin comes from Wall Street's own plumbing. U.S. spot Bitcoin ETFs saw net outflows of $299.9 million on Wednesday (November 11), the fifth consecutive trading day of redemptions. The streak began on November 5 and has now drained $1.44 billion. Wednesday's outflow was 3.2 times Tuesday's—selling pressure reaccelerated after a one-day slowdown, when the category saw only $95 million in outflows the prior day.
The damage came mainly from iShares Bitcoin Trust (IBIT). It bled $269.73 million on Wednesday, nearly 90% of the day's total. Grayscale Bitcoin Trust (GBTC) gave back $39.13 million. The only inflow that day was Morgan Stanley Bitcoin ETF (MSBT), at $8.96 million—too small to change anything.
IBIT's outflow streak is longer than the category's. The fund has seen net outflows for nine consecutive trading days since October 30, totaling $2.0 billion. The largest single days were $405.3 million on November 2 and $403 million on November 6. IBIT still has $58.71 billion in net assets and $64.54 billion in cumulative net inflows since inception. That means a large number of holders are still in, but at $71,393, a growing portion of them are underwater.
The weekly numbers show how fast the tide has turned. The week ending November 7 saw $1.28 billion in net outflows, the largest single-week outflow since late June, pushing year-to-date 2026 flows to roughly -$914 million. This is the first time the category is on track for a full-year net outflow since spot products launched in January 2024. October already lost $515 million.
Category totals show what is at stake. Spot Bitcoin ETFs hold $93.7 billion in net assets, equivalent to 6.24% of Bitcoin's market cap, or about 1.25 million BTC, with $55.1 billion in cumulative net inflows. Ethereum ETFs are also bleeding, with $144.81 million in net outflows on November 11.
The forecast logic is simple. ETF demand was the marginal buyer absorbing miner supply and long-term holder distribution during the 2024 and 2025 rallies. Now that buyer is selling, and the order book must clear at lower prices. A slowdown in redemptions would be the first sign of a bottom; an actual reversal into net inflows is what the $82,700 target requires.
The flow numbers published after Thursday's U.S. close will show whether the Huang event pushed IBIT into a tenth consecutive outflow day.
Liquidations: $1.46 Billion in 24 Hours, $1.3 Billion of It Longs
The derivatives market accelerated the decline. Total crypto liquidations exceeded $1.46 billion in 24 hours, with $1.3 billion hitting longs. In a 20-minute window after the Nvidia announcement, exchanges force-closed $125 million in long leverage, right as Bitcoin cut through $72,000.
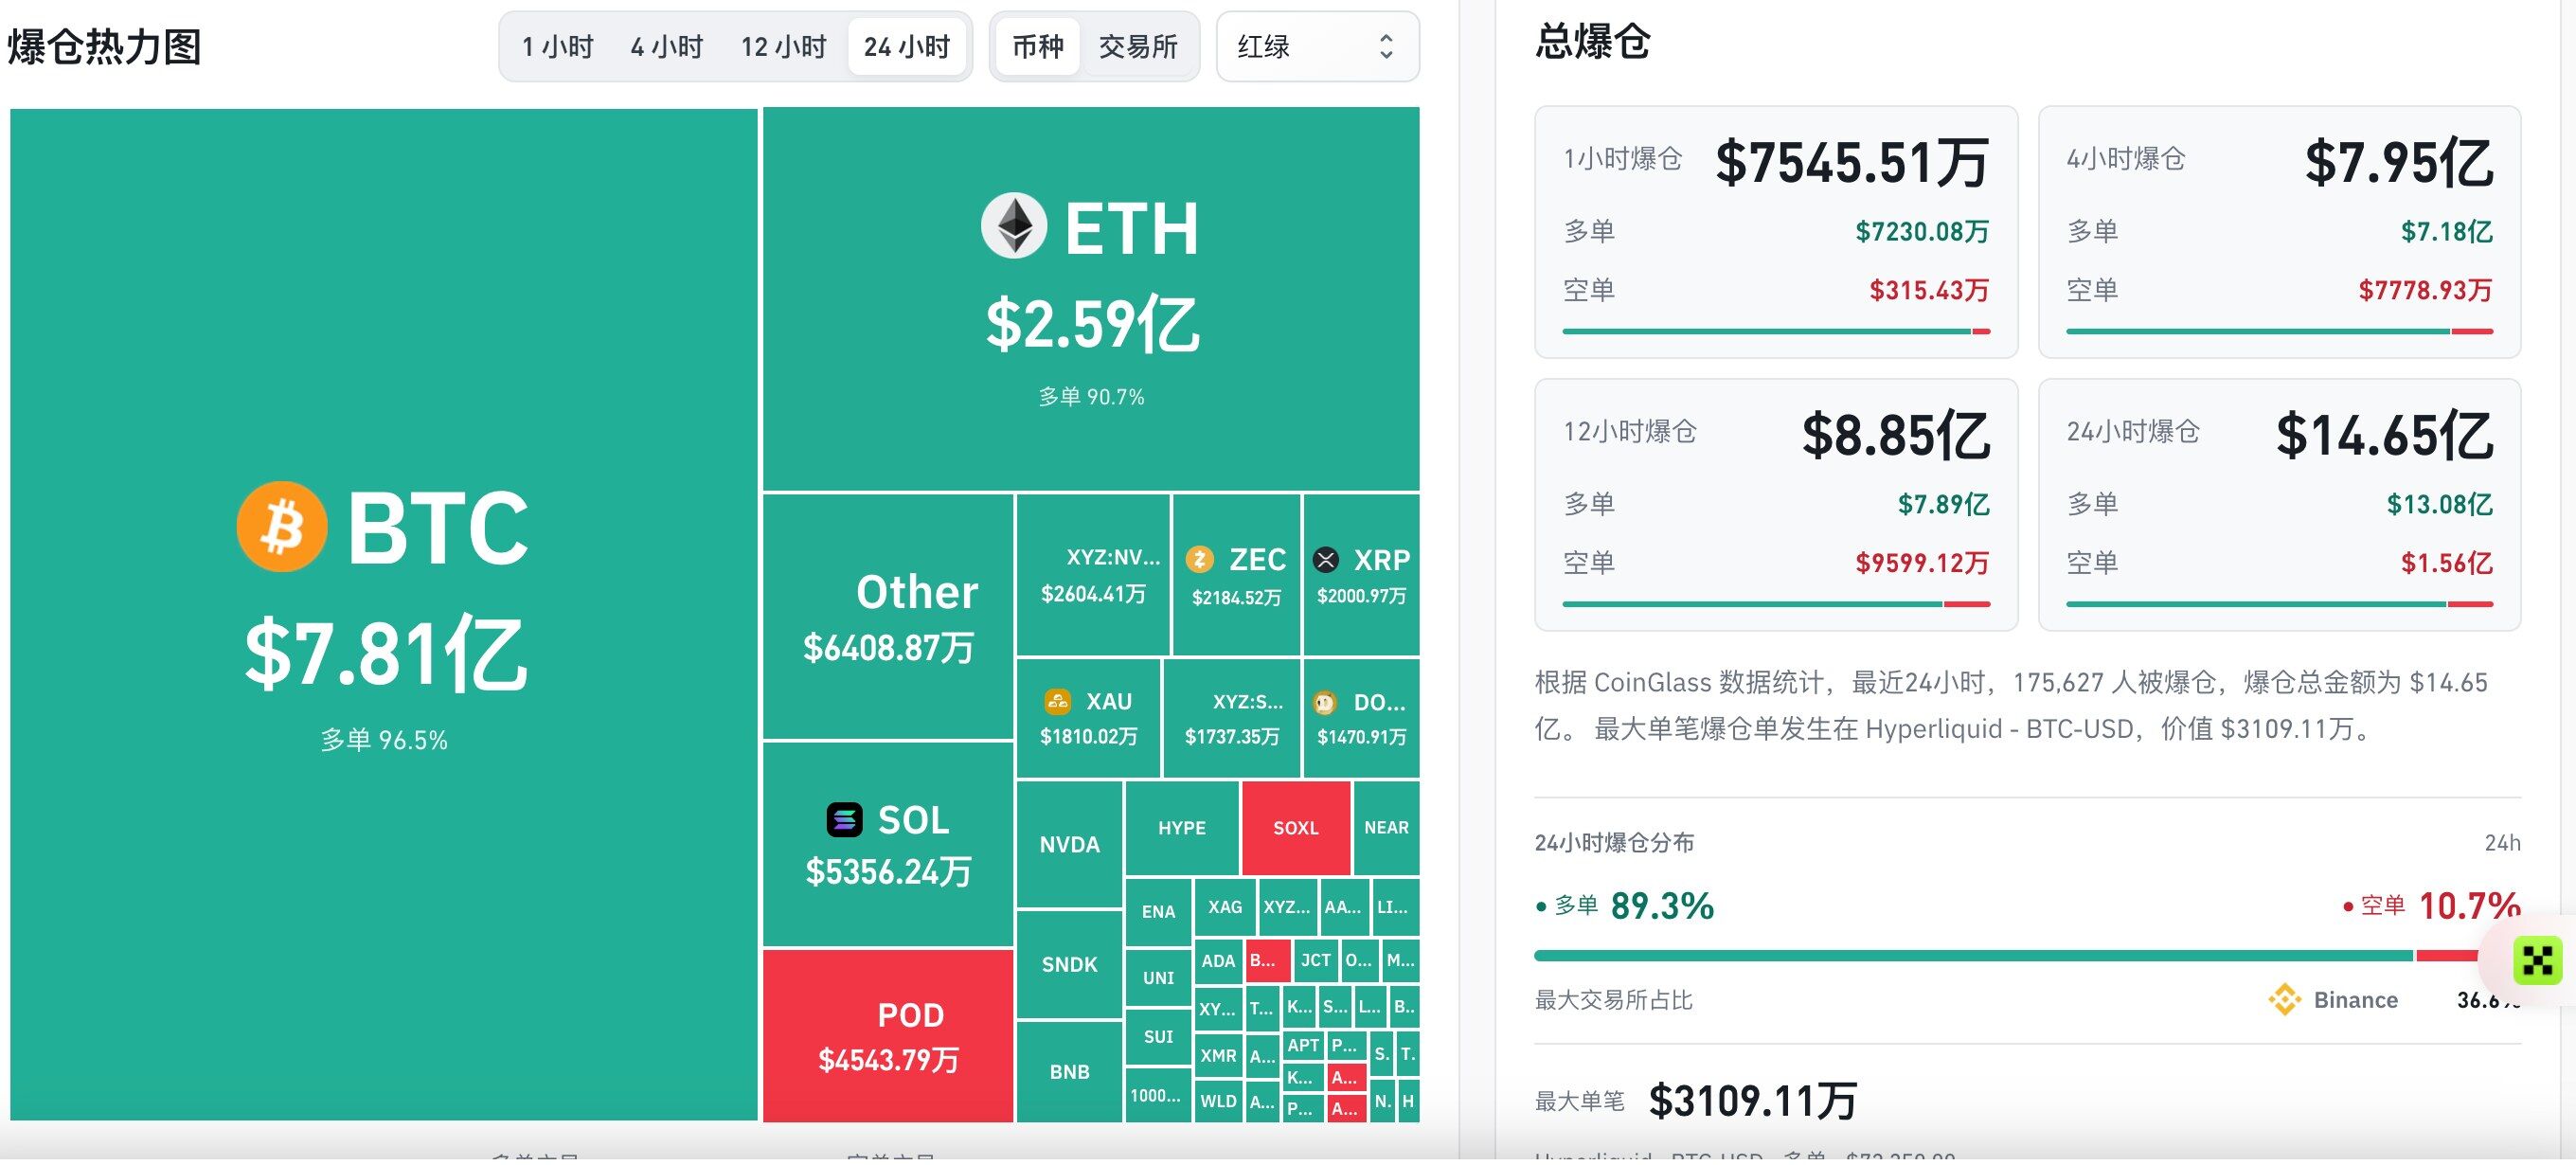
These numbers show who got trapped. Traders who bought the dip toward $74,000 earlier in the week, betting that Wednesday's AI rally would carry over into crypto, were buried on the spot. Leverage stacked just below $73,000—the support zone the market had defended since November 10—so once price broke, stop-losses triggered one after another.
In fact, in the 24 hours before the Nvidia news, total market liquidations had already fallen 63.67% to $263.7 million, with longs accounting for 64.5%. Bitcoin futures open interest fell 2.9%, and volume dropped 27.6%. The market was slowly deleveraging. Thursday's shock turned that slow bleed into a concentrated flush.
Even after this round of liquidations, Bitcoin futures open interest remains above $50 billion. That keeps the risk of another cascade alive—there is still plenty of leverage in the system. If spot breaks below the next support band, a second wave of forced selling could come as fast as the first.
The structure is two-sided, though. A market that just liquidated $630 million in longs does not have much forced selling left on that side. The shorts that piled up on the way down become fuel for any bounce. Short liquidations in the 24-hour window are a small fraction of total longs, suggesting there is still room for short positions to build. If shorts crowd around $71,000, a sharp reversal back to $74,000 is entirely possible without changing a word of the macro narrative.
Funding rates tell traders which side is crowded. Negative funding—where shorts pay longs to hold—has marked local bottoms several times this year. After Thursday's flush, funding remains near neutral, meaning the market is clearing rather than panicking.
The practical read for the forecast is this: derivatives explain the speed of the decline, not its direction. Direction comes from spot—ETF redemptions and shrinking stablecoin balances. Leverage only determines how fast price gets to where spot flows send it.
Stablecoin Supply Down $14.2 Billion in 30 Days: The Dry Powder Problem
Money is leaving crypto, and the clearest signal is in stablecoin data. Total stablecoin supply has fallen $14.2 billion over the past 30 days, the largest 30-day decline since 2022. Stablecoins are crypto's cash balance. Money enters USDT and USDC from bank accounts first, then buys Bitcoin; when investors leave, money flows back out through the same pipe.
A $14.2 billion drain means investors are not just selling Bitcoin for stablecoins and watching from the sidelines. They are redeeming stablecoins for dollars and leaving. That money is no longer available to buy the dip. It is sitting in Treasury bills yielding over 4%, or in money market funds, or it has already rotated into stocks.
The rate backdrop explains why. With the federal funds target range at 3.75% to 4.00% and the 10-year Treasury at 5.07%, cash can earn a real return for the first time this cycle. Stablecoins pay holders nothing; issuers earn the Treasury yield. When cash can earn over 4%, sitting in idle stablecoins waiting for a Bitcoin entry point becomes expensive, so investors move to cash.
Part of the contraction must also be attributed to the Binance hack. On October 29, attackers drained $6.3 billion from Binance hot wallets, the largest crypto theft on record. Stablecoin issuers froze about $2.8 billion of the stolen USDT and USDC. The frozen tokens effectively left circulation, and part of the supply decline comes from that freeze and subsequent weeks of redemptions.
Total crypto market cap confirms the outflow. It fell 4.57% to $2.43 trillion on Thursday. Bitcoin's dominance is 59.79%. That ratio is high but not rising, indicating money is not rotating from altcoins into Bitcoin as a relative safe haven—it is leaving the asset class entirely.
For the forecast, stablecoin supply is the number to watch for a bottom. Every durable Bitcoin rally this cycle has begun with stablecoin supply growth—fresh dollars entering the system first, then reaching BTC. A flattening 30-day change would be the first signal that the bleeding has stopped; a turn back to positive would tell traders the $82,700 target is financeable.
Until then, every rally will run into a pool with fewer and fewer cash buyers.
The Macro Wall: 10-Year at 5.07%, DXY at 103.08, Gold Down 3.39%
Bitcoin's real opponent is the bond market. The 10-year Treasury yield rose 7 basis points to 5.07% on Thursday. The benchmark first crossed 5% in mid-September, the highest since July 2007, hit a closing high of 5.31% on October 5, and has since oscillated between 4.86% and 5.13%. Every return above 5% has pushed risk assets lower within days. Bitcoin has followed that pattern every time.
The dollar is adding pressure. The dollar index hit 103.08 on Thursday, a new year-to-date high, as rate hike bets kept building. Bitcoin is priced in dollars, and a stronger dollar pushes its price down, just as it does for gold. A strong dollar also tightens global liquidity, because offshore borrowers who owe dollars must sell assets to repay.
Gold's move is the cleanest proof. Spot gold fell $135.70, or 3.39%, to $3,864.80. It broke below $4,000 in late October and has not recovered. If Bitcoin were trading as digital gold, the two should diverge on a day like Thursday—one up, one down. Instead they fell by nearly the same percentage. Both are being repriced against a 5.07% risk-free rate and a 103.08 dollar.
Real yields settle the math. The 10-year TIPS real yield reached 2.66% in late October. Investors can lock in a ten-year return 2.66% above inflation with no credit risk. Bitcoin pays nothing, and its value depends entirely on future price appreciation. As real yields rise, the gain Bitcoin must deliver to beat Treasuries rises with them, and fewer buyers are willing to take that bet.
The two-year Treasury—the maturity most tightly linked to Fed policy—jumped above 4.69% after Tuesday's October inflation data. The two-year is the rate that matters most for crypto leverage trades, because it determines the cost of basis trades and margin financing. The higher short-term rates are, the lower the return on the cash-and-carry trade of buying spot Bitcoin while shorting futures to capture the spread, and part of the ETF outflow is that position being unwound.
Bitcoin's macro floor is a 10-year at 5%. A sustained drop back below 5% would relieve pressure on all zero-yield assets; a return to October's 5.31% high would put 2026 lows back in view.
October CPI and the Fed's December 8-9 Decision: 25 or 50 Basis Points
The rate pressure traces back to Tuesday's inflation data. The Bureau of Labor Statistics reported October CPI up 0.4% month over month, above the 0.3% consensus; core CPI rose 0.3% month over month, above the 0.2% forecast. Core has now printed 0.3% for three straight months—August, September, and October. Annualized, that is a 3.7% core pace, far above the 2.6% core annual rate reported in September.
Because the 2025 government shutdown prevented the BLS from collecting October 2025 prices, the agency did not publish a year-over-year figure. The market has only monthly readings to work with, and both ran hot. Energy rose 0.7%, food rose 0.5%, motor vehicle insurance rose 0.7%, and recreation rose 0.8%. Gasoline is up 37.4% year over year.
Bitcoin reacted in the spot market. Within five minutes of the 8:30 a.m. release on Tuesday, BTC fell from $74,264 to $73,494, a $770 drop, and never returned above $74,264. Thursday's break below $72,000 continued exactly the trend that data set off.
The Fed's position makes December a real decision. The central bank raised the target range to 3.75% to 4.00% on September 16, the first hike since 2023, and held steady on October 28 by a 10-2 vote, with two dissenters favoring a hike. Fed Governor Christopher Waller said Tuesday morning that if core CPI came in at 0.3% or higher, the Fed should consider a 50 basis point hike in December. Hours later, the print came in at exactly 0.3%.
After the October jobs report (strong wage growth, unemployment falling from 4.2% to 4.1%), the probability of a December hike had already risen to 75% to 80%. The question is no longer whether the Fed hikes on December 8-9, but by how much. For Bitcoin, the difference between 25 and 50 basis points is material: a half-point hike would push the two-year yield higher, tighten dollar liquidity further, and squeeze the leveraged trades that support crypto prices.
The next input arrives soon. October producer prices are due Friday at 8:30 a.m. ET, and economists already estimate the Fed's preferred core PCE index rose 0.4% in October. The November jobs report comes December 4, and November CPI lands December 10, the day after the decision. If Friday's