LD Capital Macro Weekly Report (11.6): U.S. stocks and cryptocurrency “garbage riot” resonate, and stampede replenishment is underway



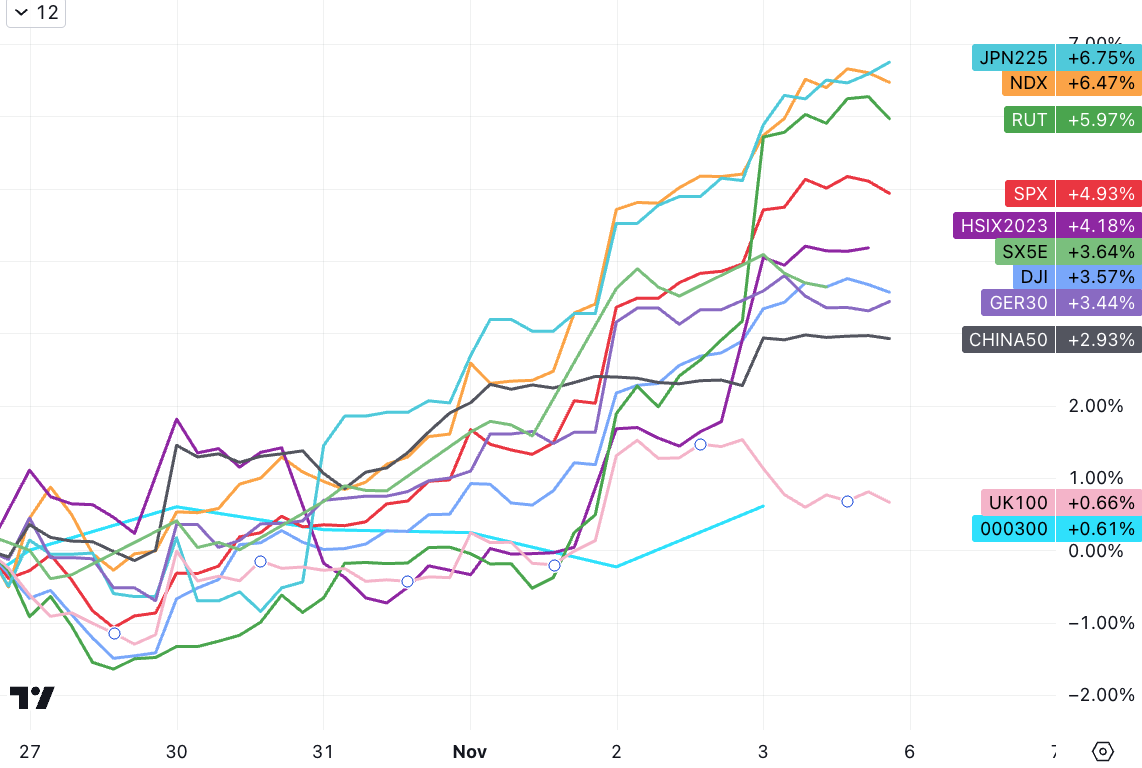
The SP 500 rose for five consecutive sessions last week and posted its best weekly gain since November 2022 (+5.9%), while the Nasdaq gained 6.5% last week, its best weekly gain of the year. Graphically there is hope for a break out of the correction channel that has been in place for the past 3 months. Market participants reacted to a combination of dovish economic data (employment, inflation, manufacturing) and policy-friendly (FOMC+BOJ dovish bias and Treasury debt issuance less than expected) in a backdrop that was reminiscent of goldilock time. Judging from positioning and sentiment data, this rebound is more like short covering, and high volatility will continue.
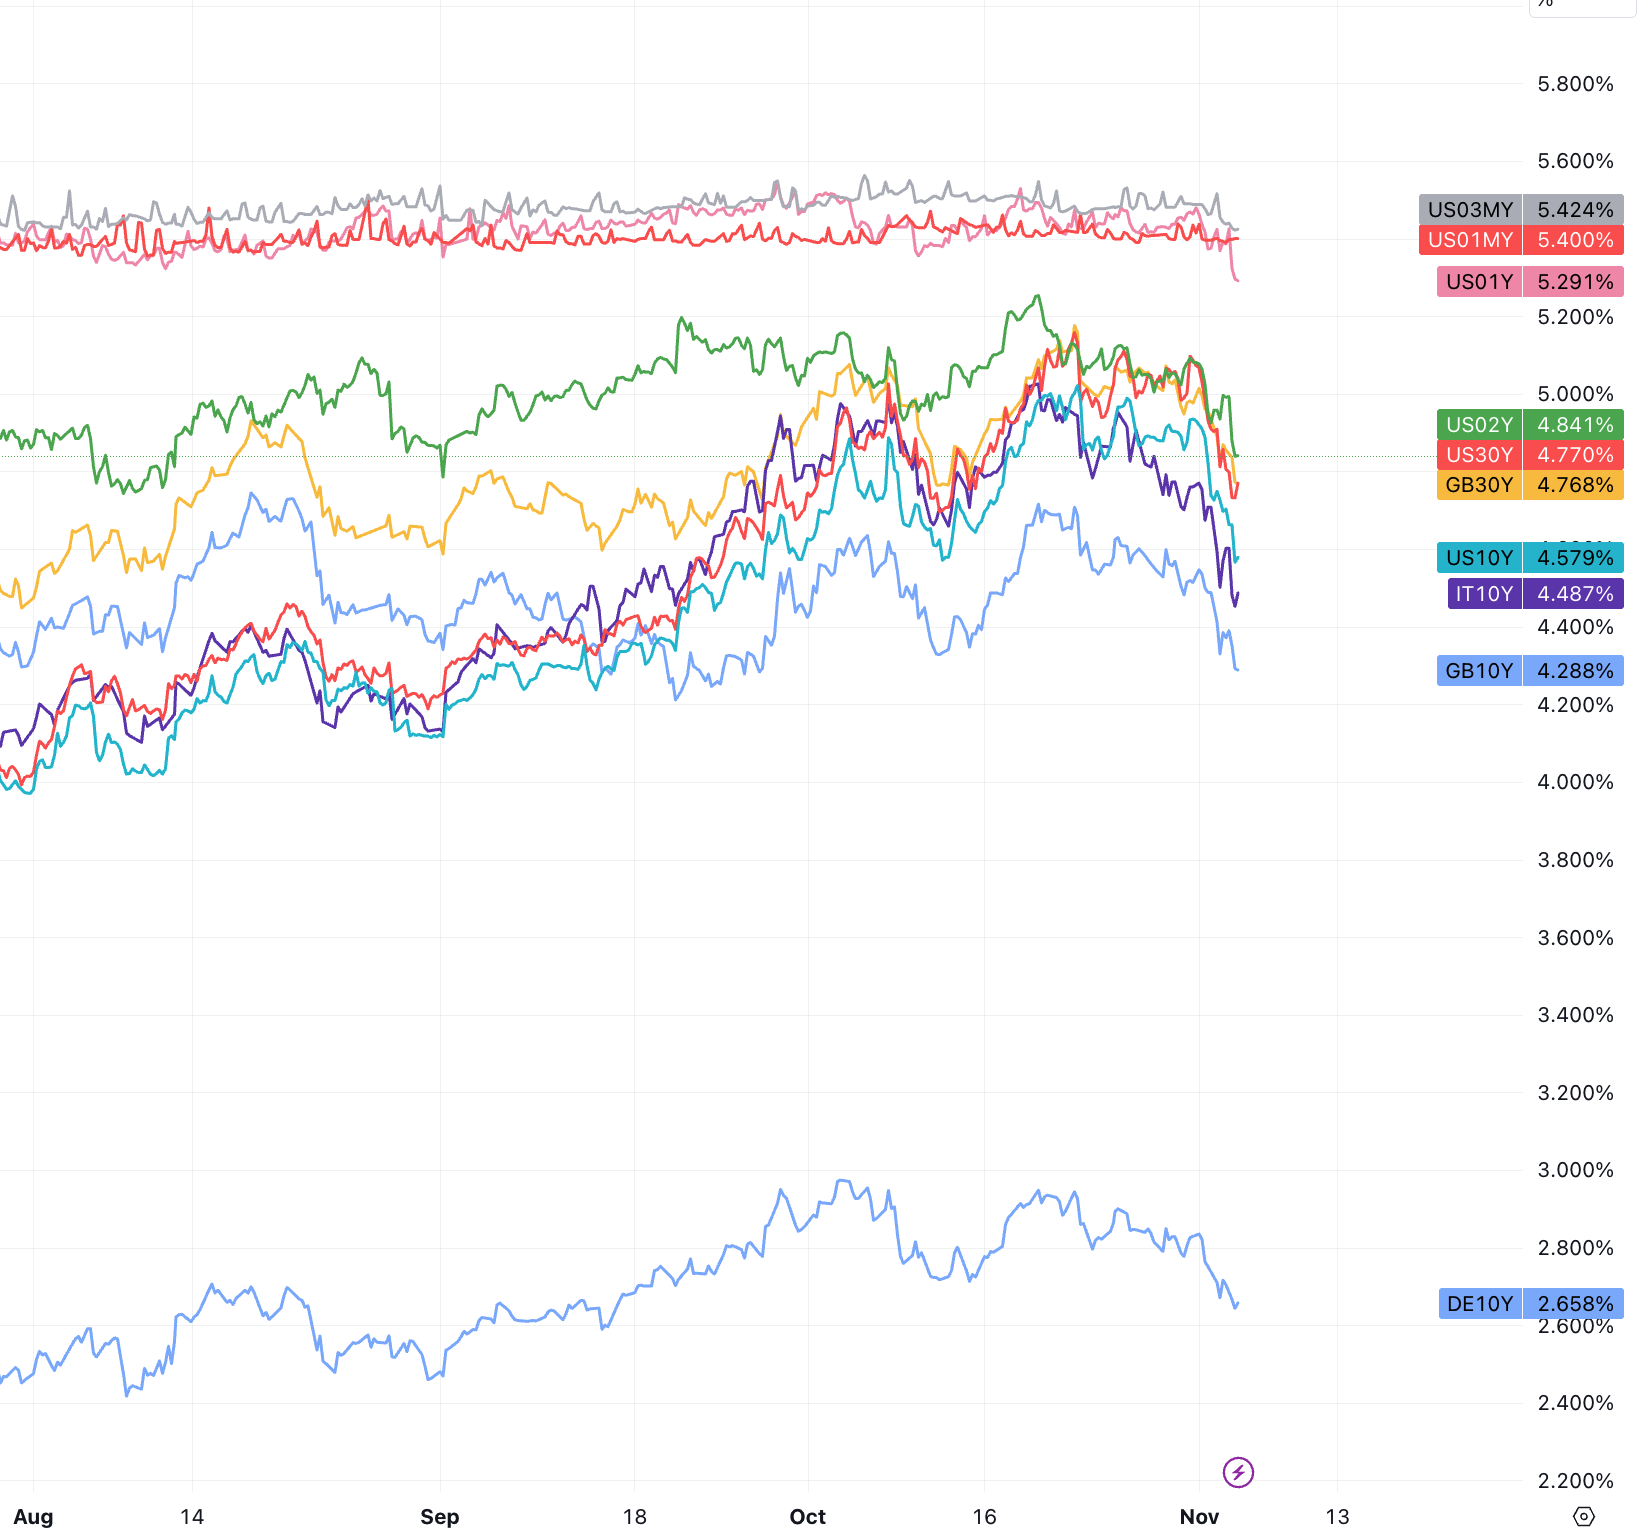
The 10-year Treasury yield posted its biggest weekly drop since March:
Small-cap representative Russel l2 000 posted strongest weekly gain since January 2021:
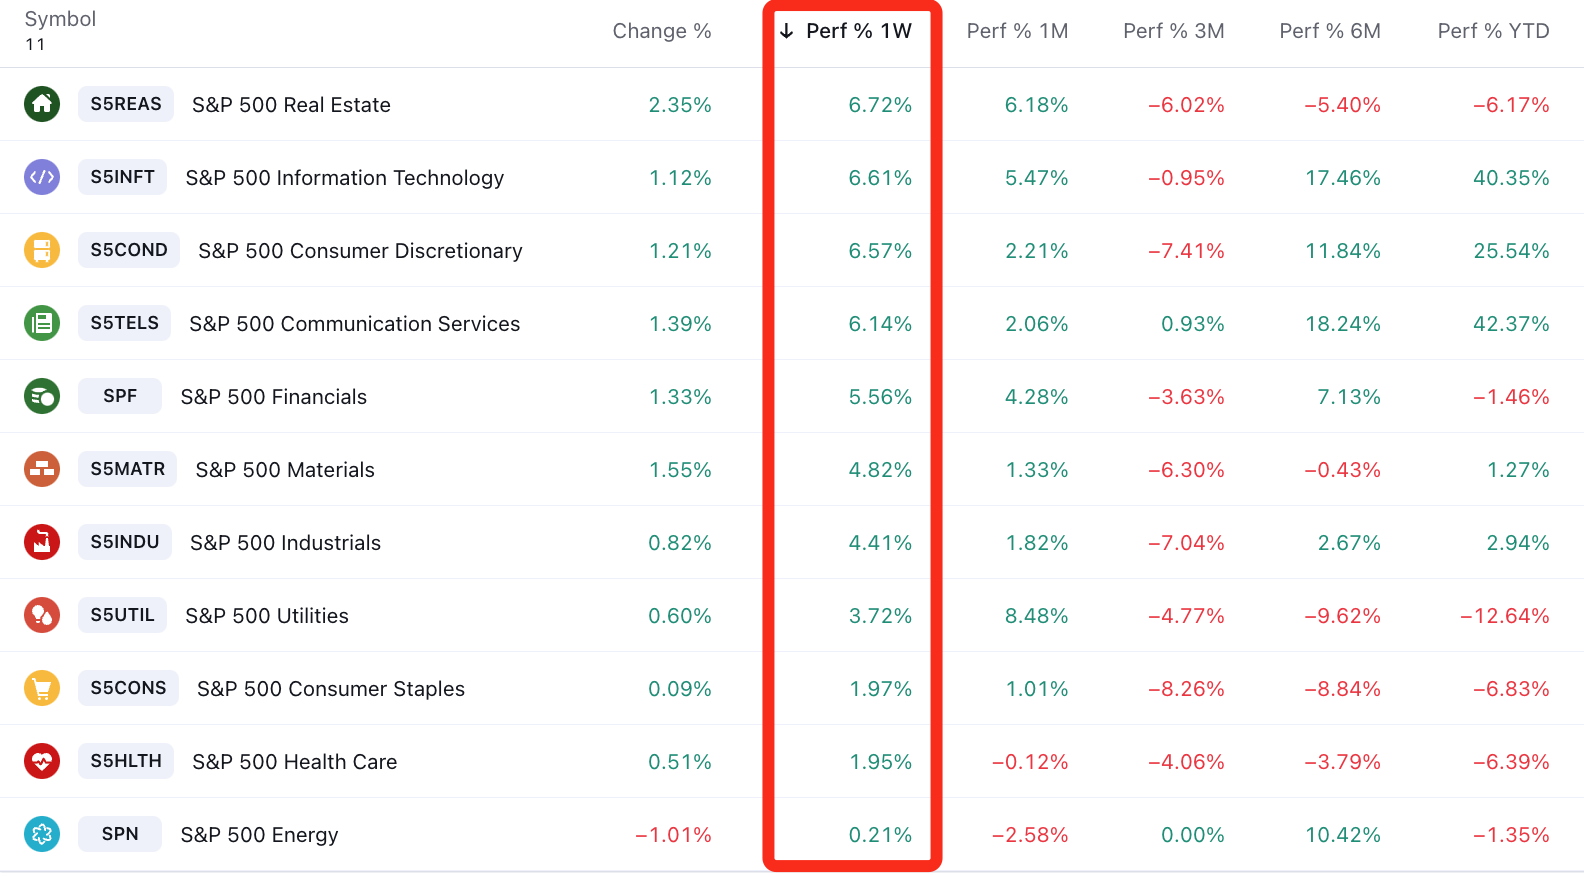
That sent bond yields lower and corporate results last week were generally positive. The real estate and consumer discretionary sectors, which have been suppressed by high interest rates for a long time, rebounded sharply to lead the rise in U.S. stocks. The technology and telecommunications sectors also rose significantly, both exceeding 6%; the worst performers were energy, medical care, and consumer staples.
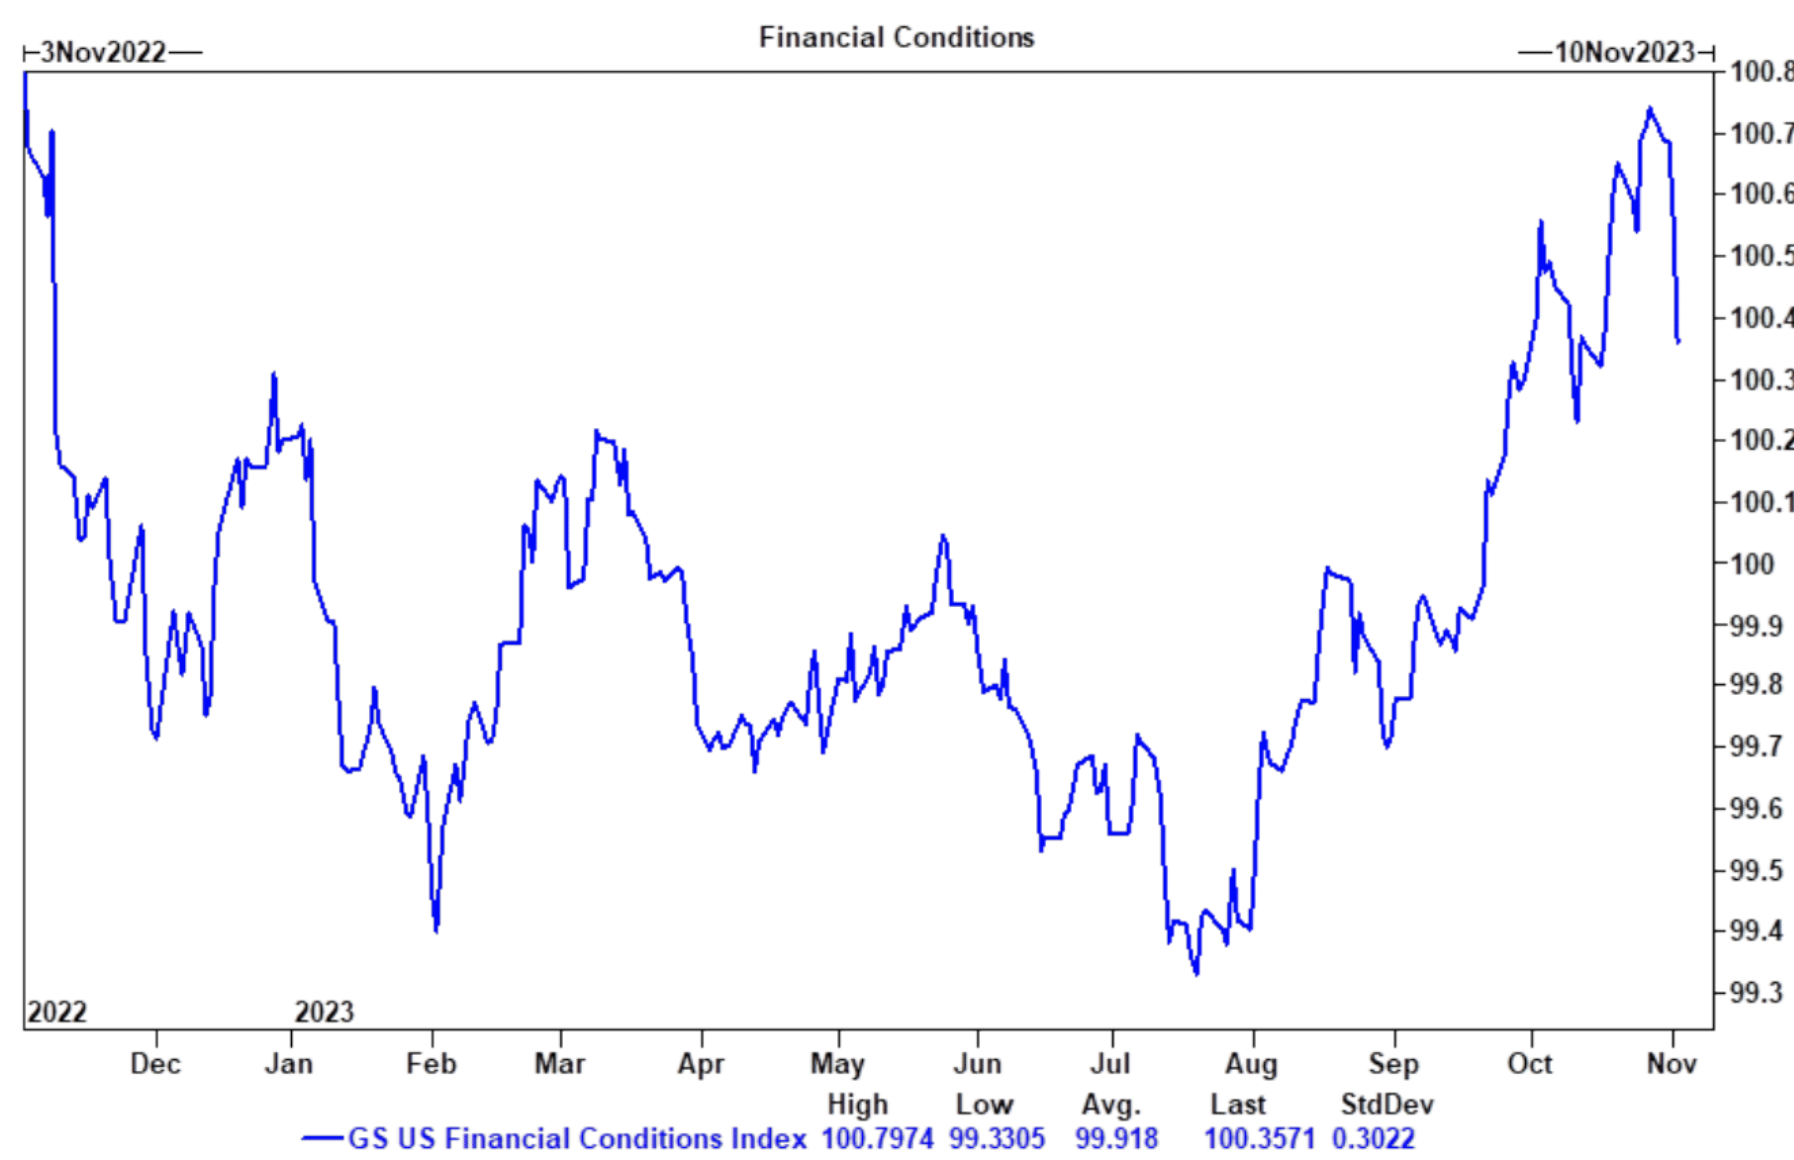
The fall in market yields led to the biggest drop in the financial conditions index since November:
GS’s Financial Conditions Index
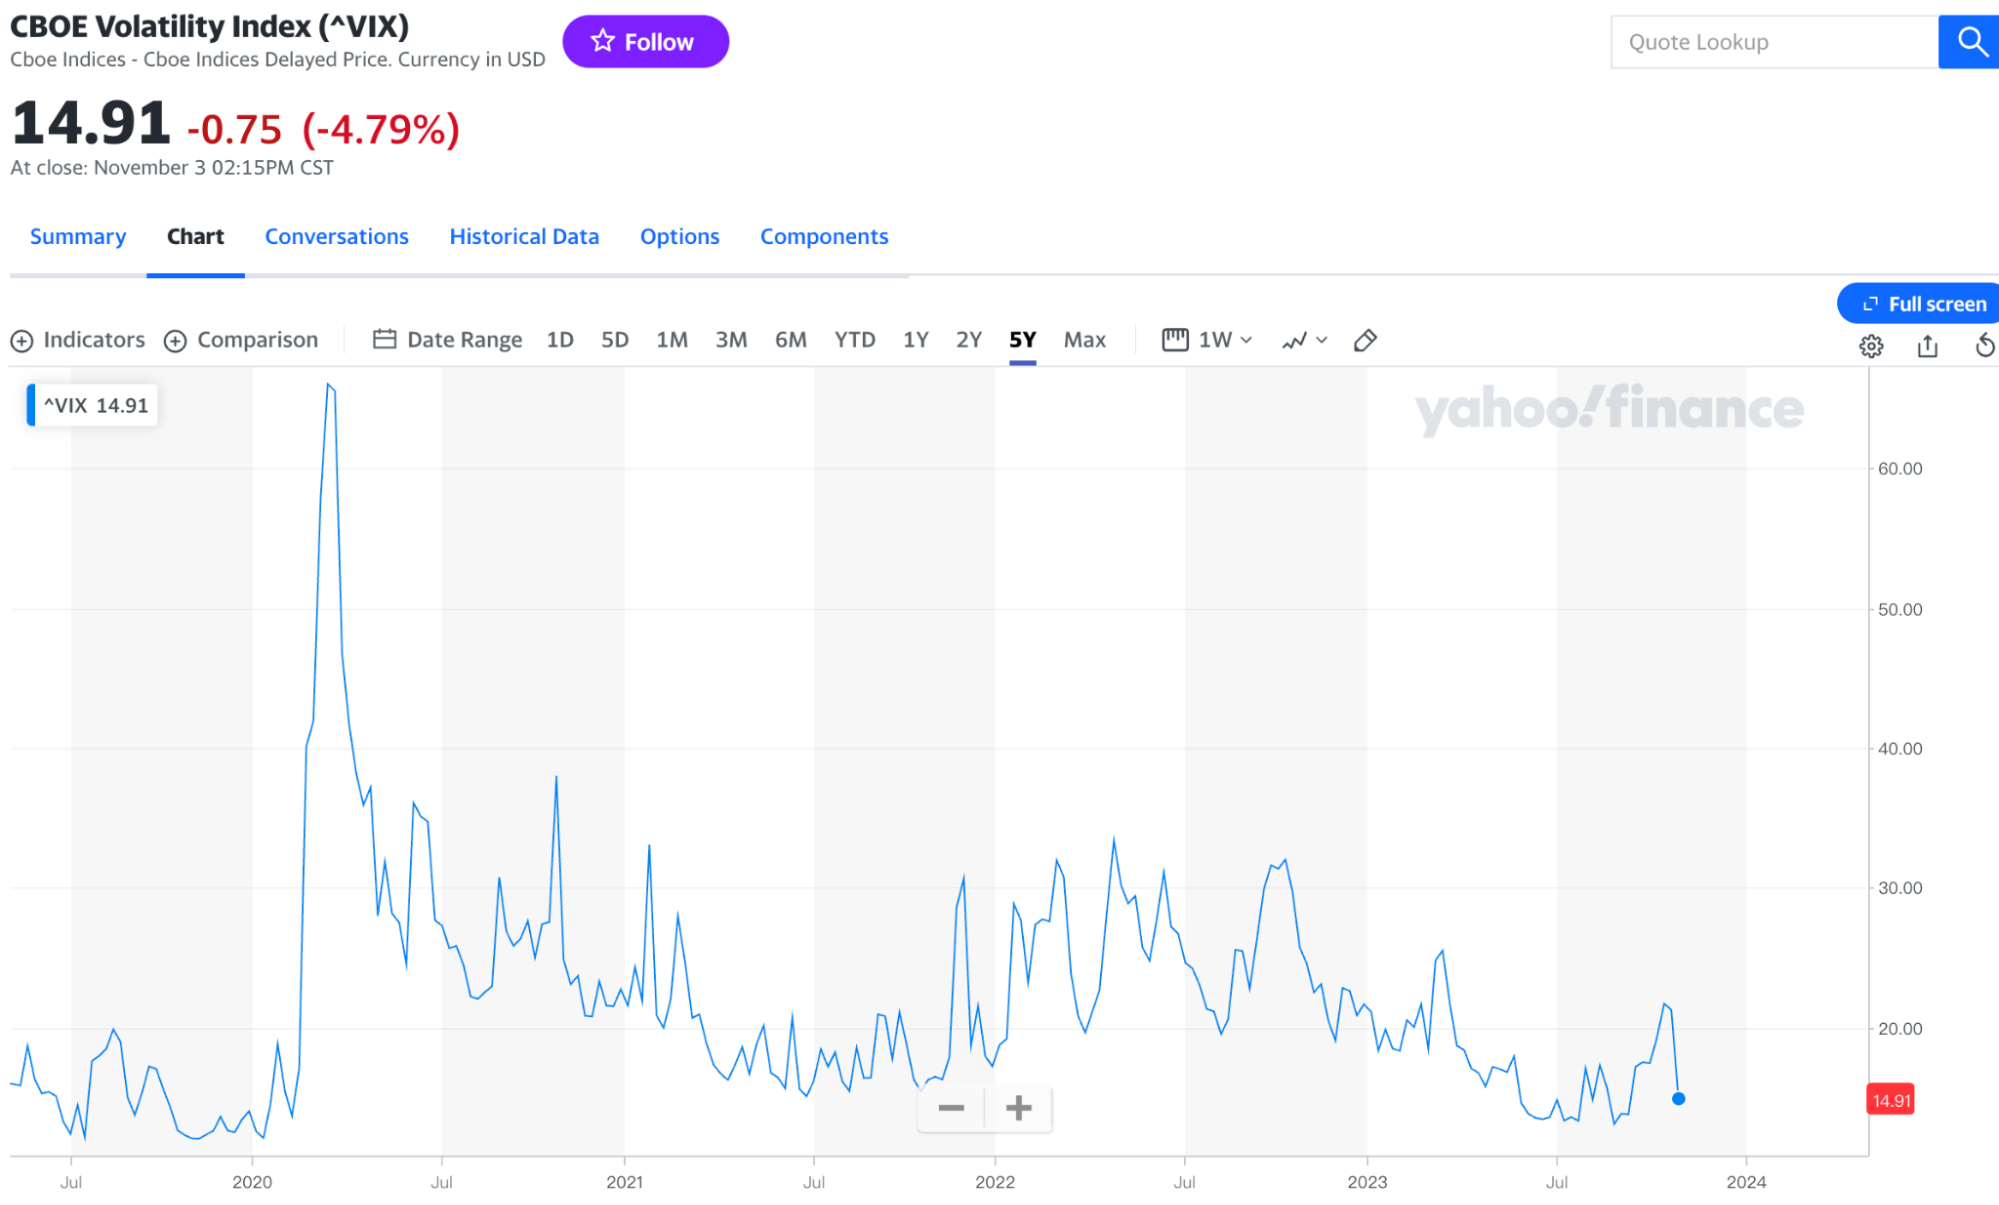
Panic has clearly subsided, and the VIX has fallen sharply:
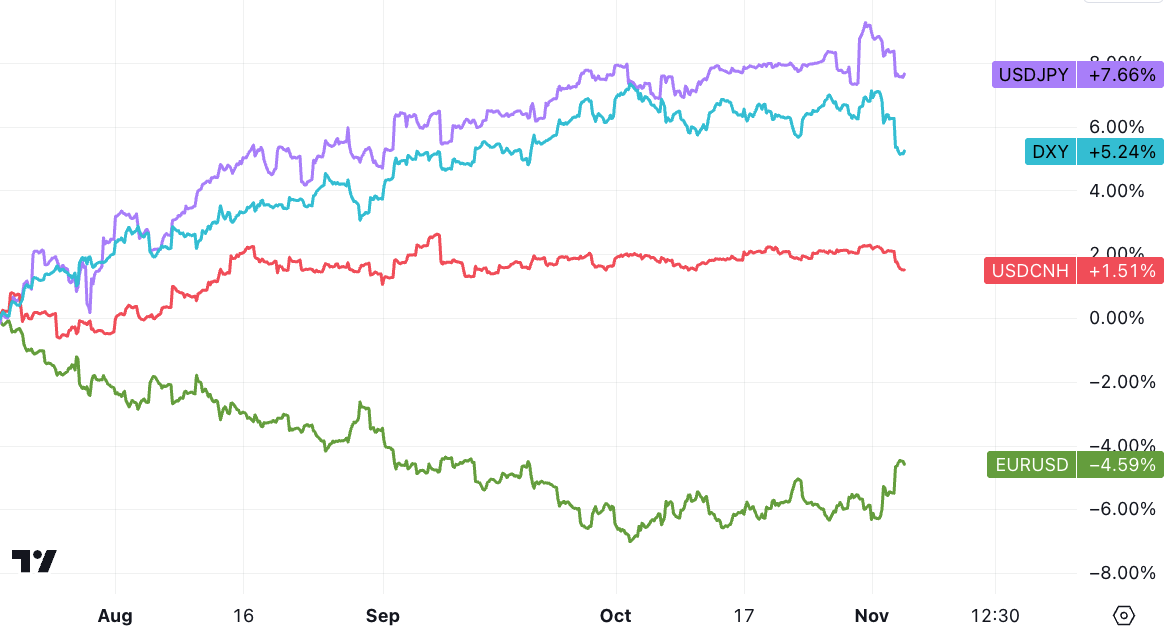
The U.S. dollar index retreated to its lowest level since September 20:
It is worth noting that small-cap stocks rose 7.5% this week, the best weekly gain since February 2021, while unprofitable technology stocks surged 15% this week, the best weekly gain since November 2022, Cathie Wood’s ARKK had its best week on record, rising nearly 19%:
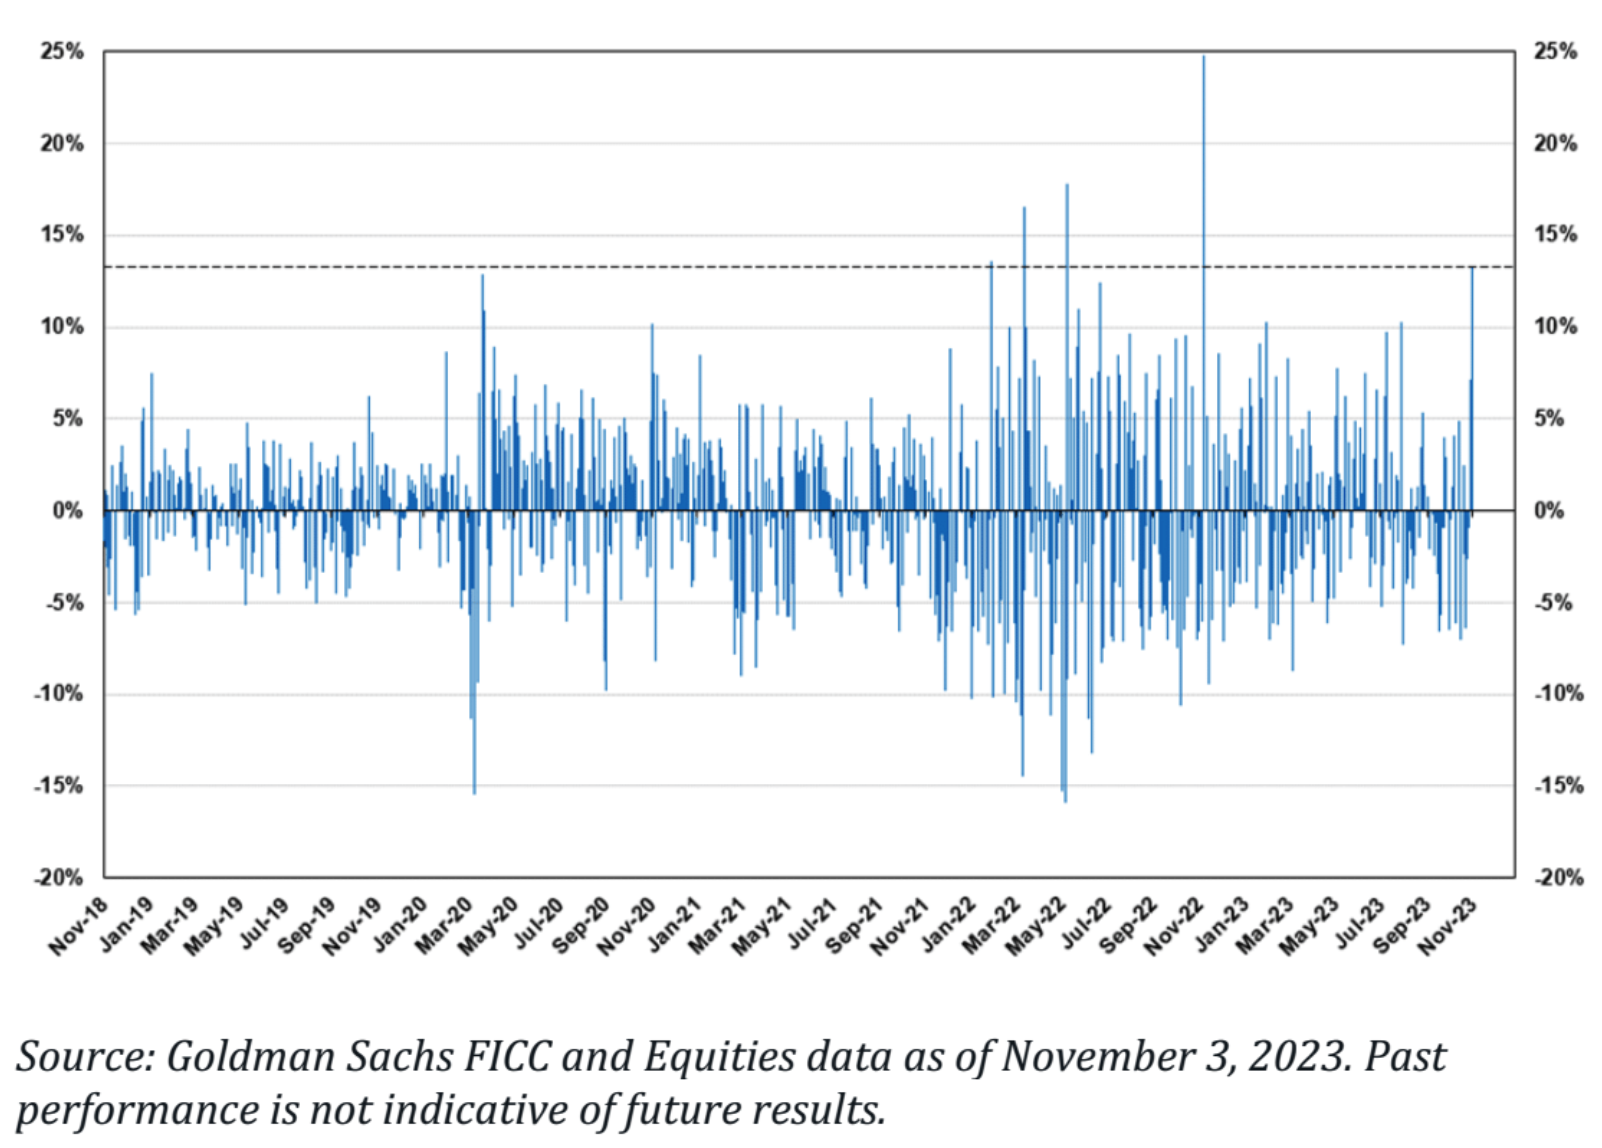
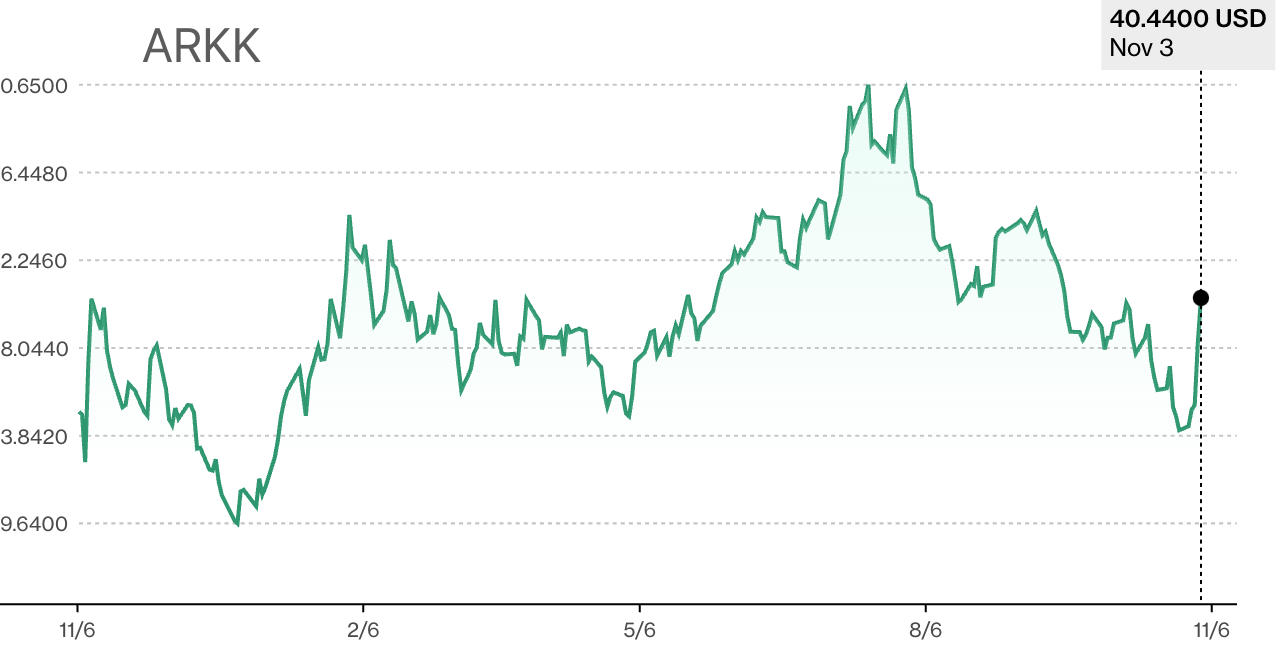
This astonishing rise seems to be more related to the release of emotions, which echoes the cryptocurrency market. Altcoin, a riskier unprofitable technology concept asset, rose 6.2% last week, while BTC+ETH only rose 2.1%. The difference in weekly gains between the two hit the highest level in three months.
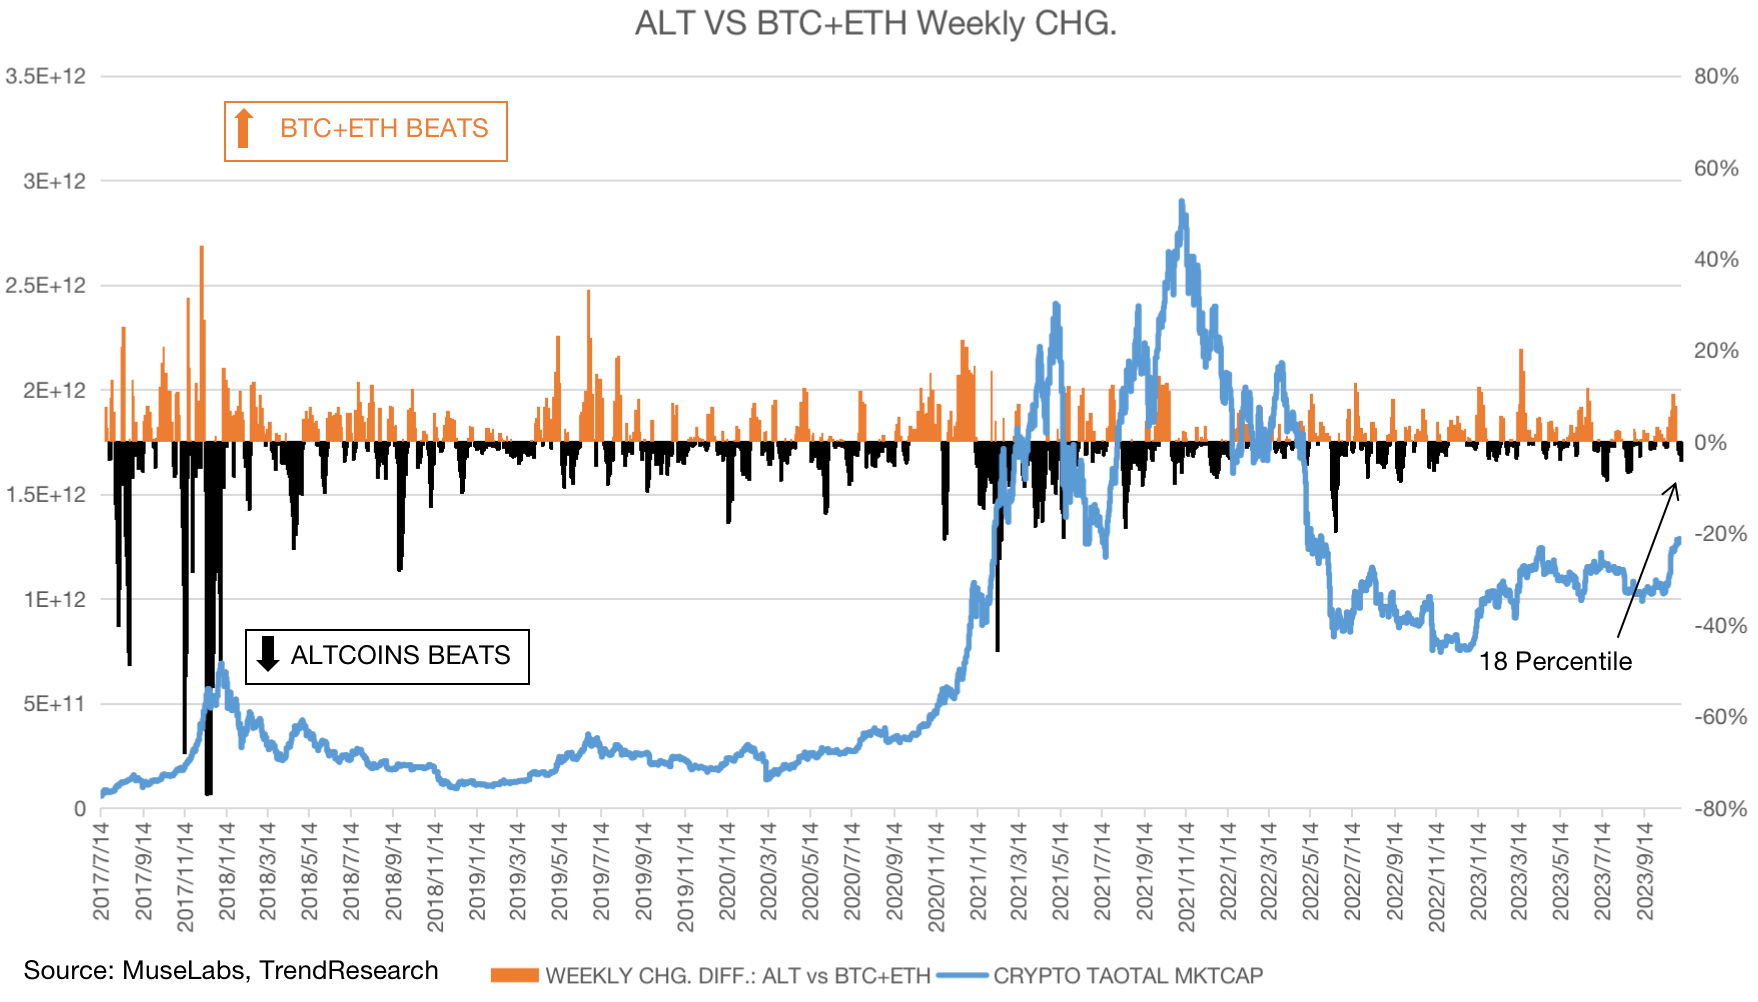
Judging from the history since 2017, ALTCOIN has experienced significant beats in the early stages of the past three bull markets, such as August 2017, June 2020, and August 2021. Weekly change differences like last weeks are only at the 18th percentile historically, suggesting that ALTCOINs agitation is far from exaggerated if this does indeed become a broadly rising crypto bull run.
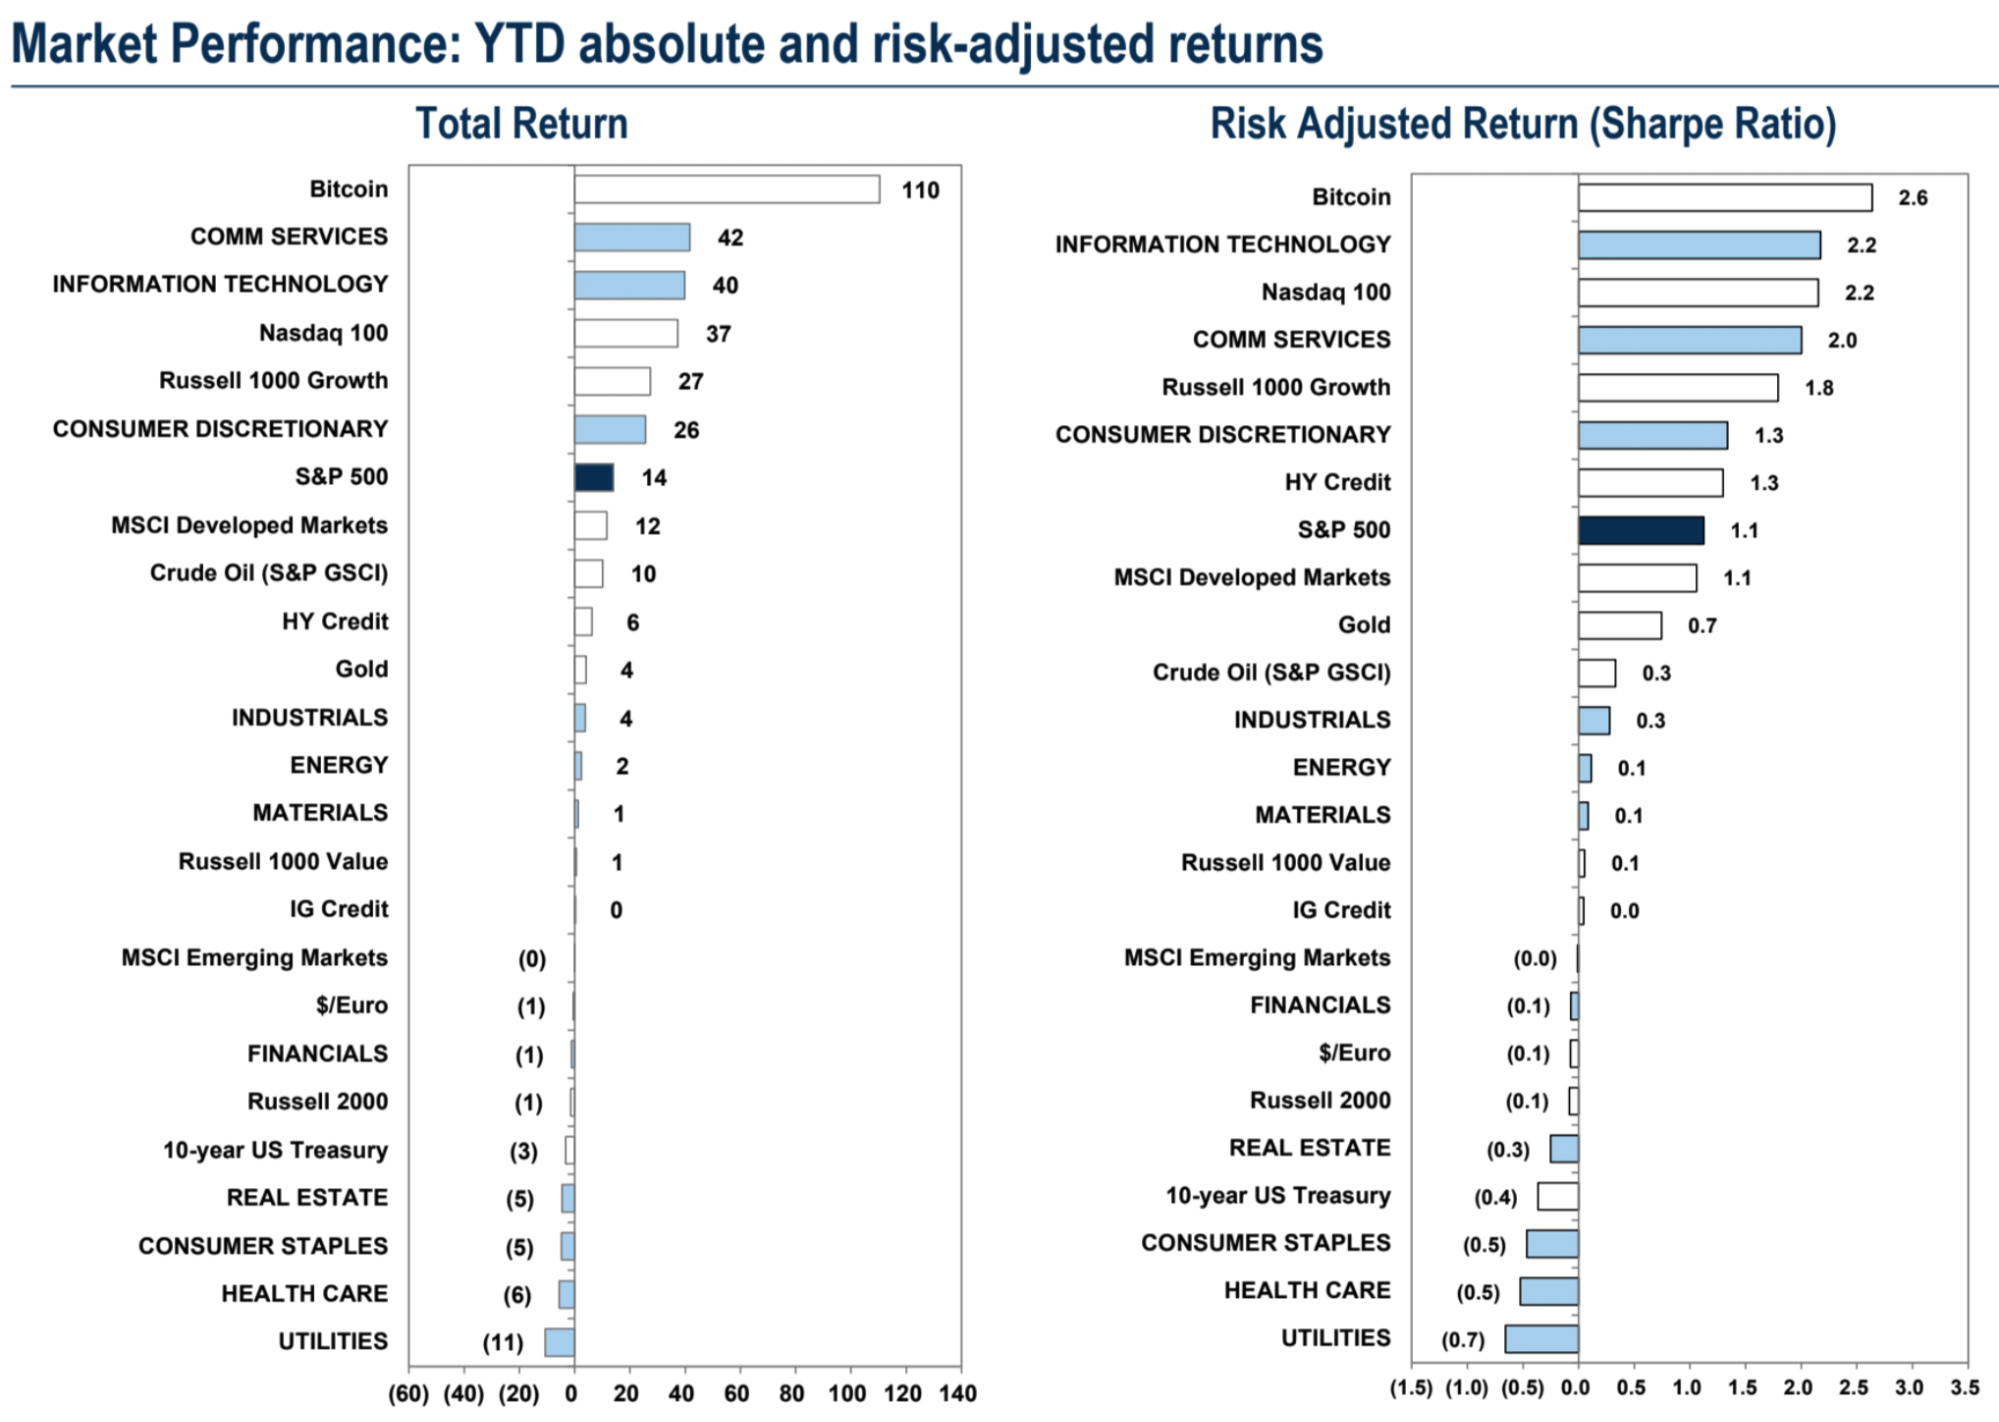
Bitcoin’s nominal return rate and risk-return ratio topped all major asset classes this year:
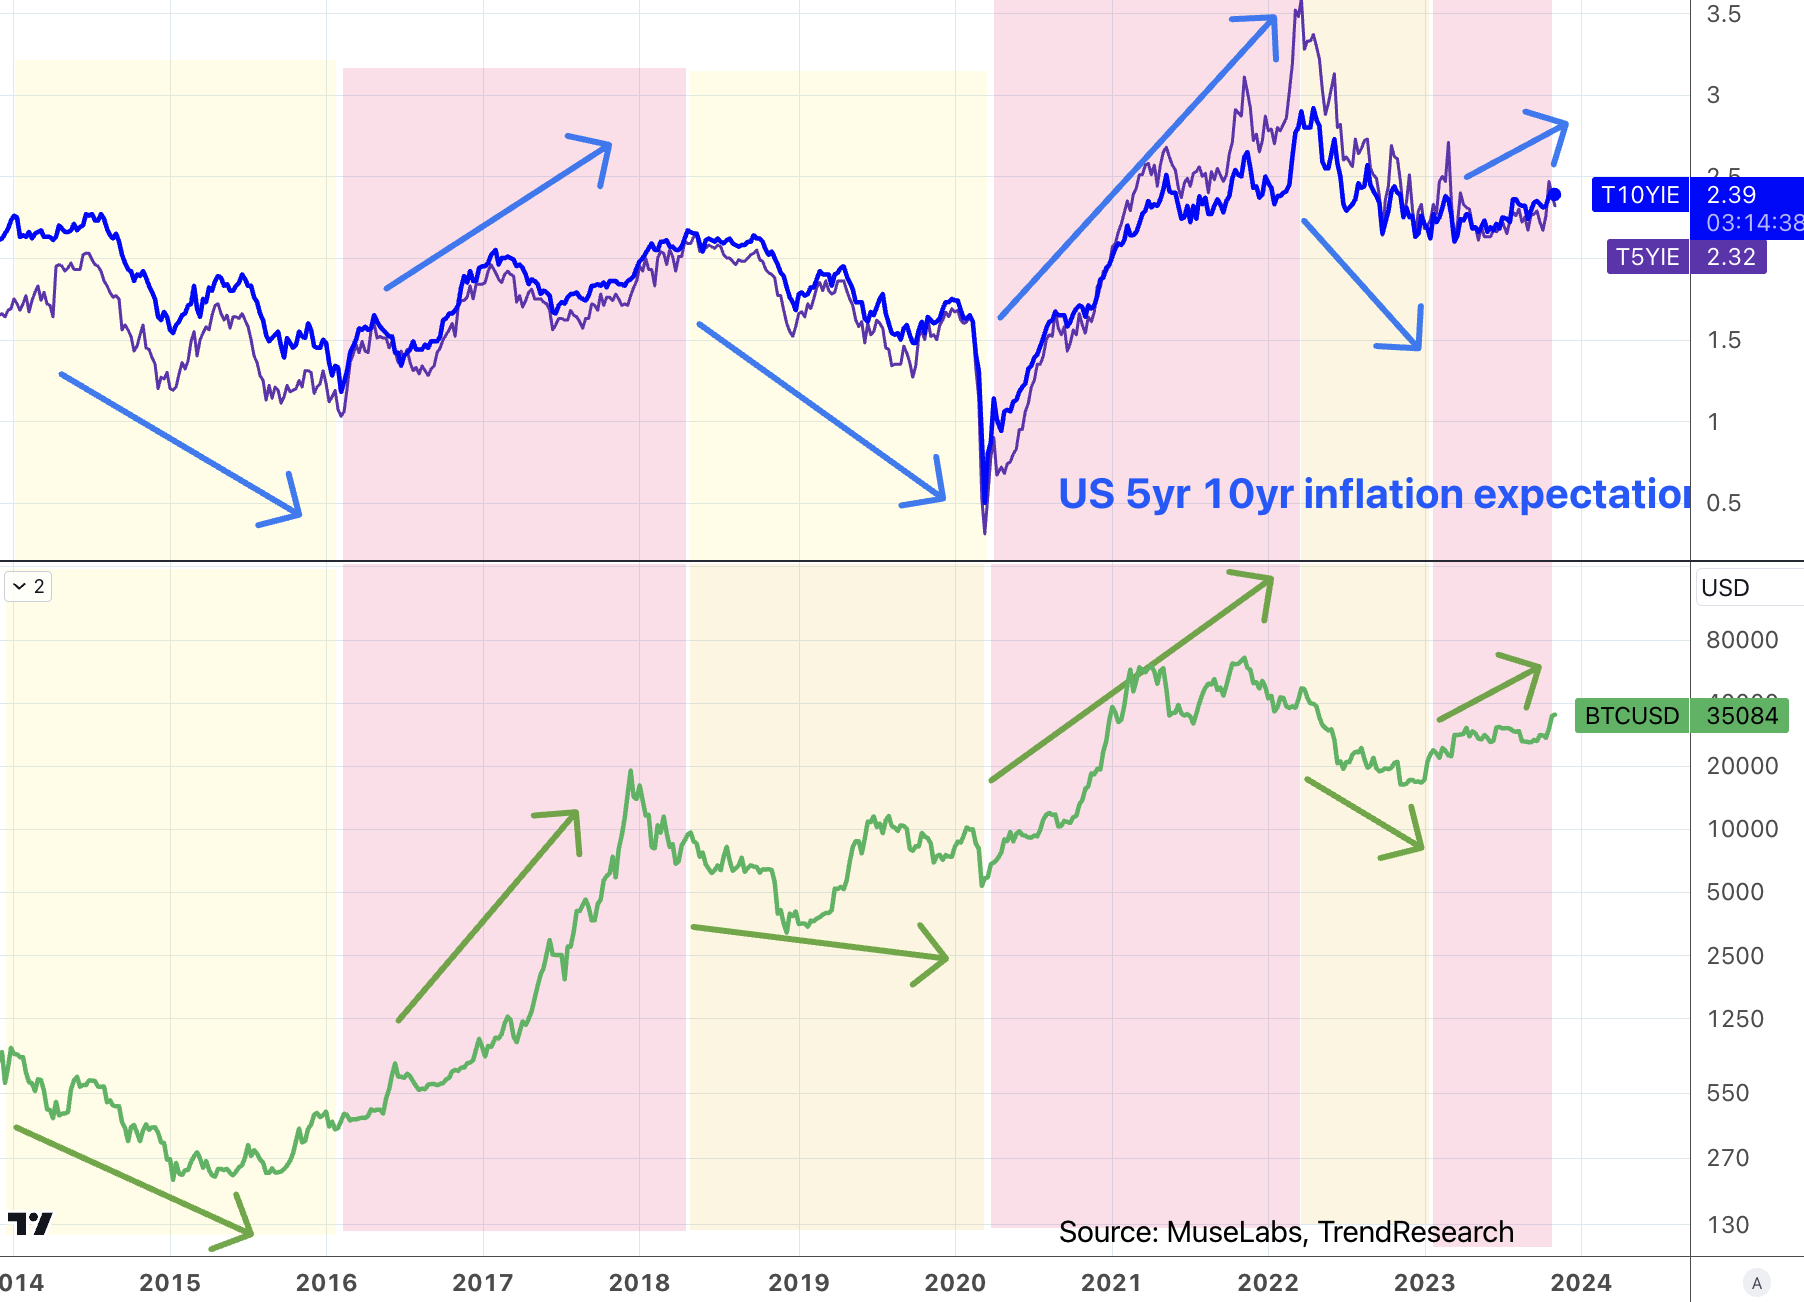
Historically, we believe that the allocation value of BTC as an alternative asset is largely supported by the shadow of inflation. Using the 5-year and 10-year breakeven rates commonly referenced in the secondary market as inflation expectations indicators, BTC’s bull market and Bear markets always correspond to rising and falling inflation expectations.
If the Fed policy interest rate peaks, will inflation expectations also cool down (in the past two weeks, the 5 yr has dropped by 20 bp, and the 10 yr has dropped by 10 bp). If Godiloc does not continue thereafter, then in turn, the demand for alternative allocations may also will weaken. Another good scenario is that the Fed policy interest rate has peaked, but the actual economic development continues to improve, leading to a sharp increase in inflation expectations. However, at least for now, the economic cooling expectations for the fourth quarter and the first quarter of next year are still very strong (excluding the third quarter subsidy). Inventory and one-time consumption support). So its somewhat contradictory to bet that falling interest rates coincide with rising alternative assets.
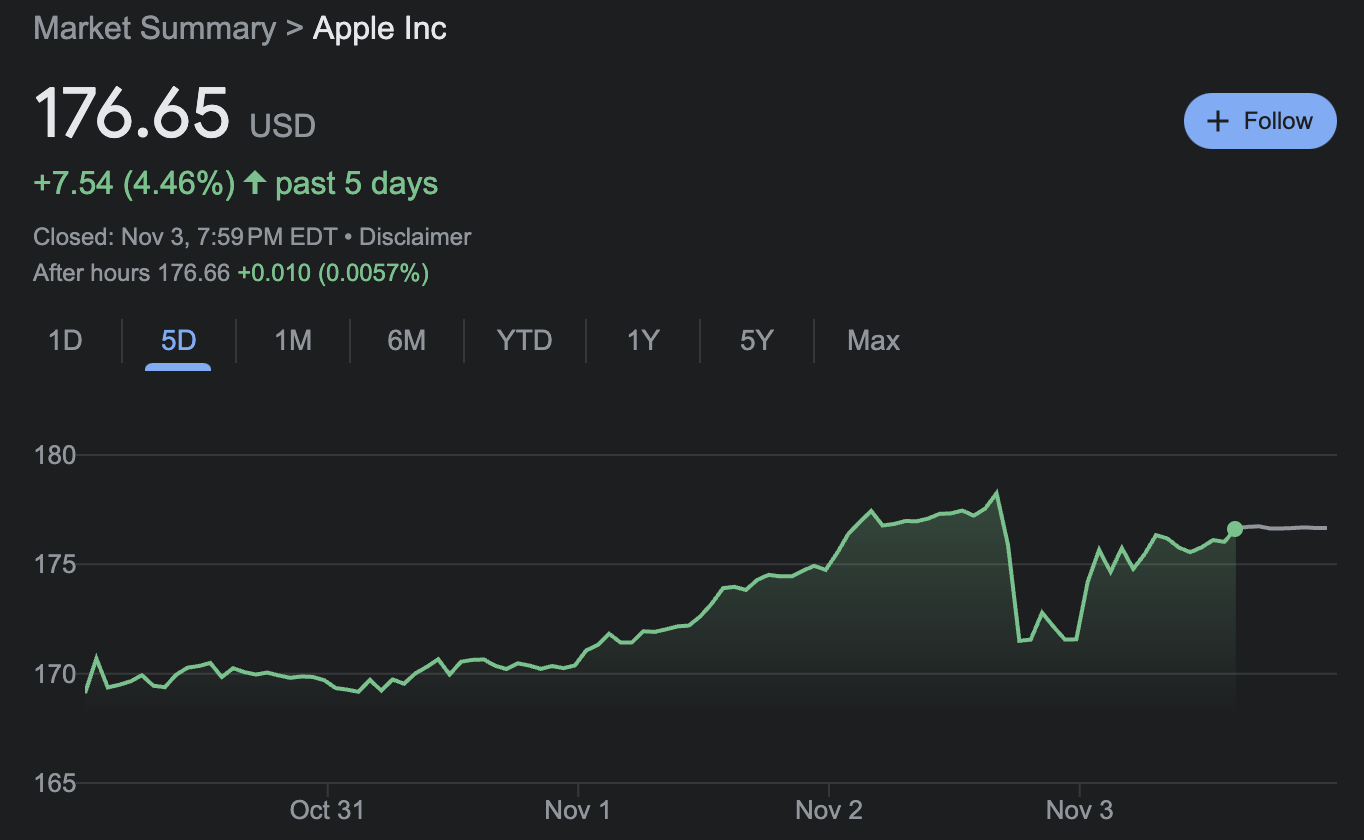
AAPLs Q3 revenue and EPS exceeded expectations, but many indicators fell short of expectations, especially weak sales in Greater China. The stock price once fell 3.4%, but eventually recovered, rising 4.5% for the whole week.
This weeks Israeli land incursion did not trigger a rapid escalation (i.e., further involvement of Hezbollah or Iran). Crude oil prices plunged $5 despite the US House of Representatives passing a bill to expand sanctions on Iranian oil.
Dovish FOMC
There was little new in the statement, but what was there suggested a dovish wait-and-see approach to see whether stronger economic activity would hinder progress toward the inflation target. Most importantly, Chairman Powell downplayed the recent rise in inflation expectations, again saying that while growth is above potential it is not enough to raise rates again, and acknowledging that the recent tightening of financial conditions is effectively a proxy for a rate hike. This is also something the market likes to hear. However, the Feds stance has not changed since July. However, the tightening of financial conditions in the United States is equivalent to an interest rate increase of about 75 basis points, which will drag down growth, which may be reflected in the fourth quarter at the earliest. It will not change much due to the correction of short-term market interest rates. many.
Judging from the September dot plot, there will be one more interest rate hike this year. Since the Fed never likes to surprise the market, if Powell is confident enough in the recent economic data, he should make it clear or at least hint at the press conference how to act at the next meeting. . The result still emphasizes being data-driven and reiterates that rising long-term interest rates will replace interest rate hikes. The market has reason to believe that this round of interest rate hike cycles is over, and inflation expectations may not be able to stop.
U.S. government Q4 financing scale declines
The U.S. Treasury Department lowered its fourth-quarter net borrowing target to $776 billion vs. $852 billion expected, with 58% short-term bonds, which suddenly eased market anxiety about long-term bond yields. The U.S. Treasury Department issued $1.01 trillion in debt in Q3. Official statements attributed the drop in borrowing demand to rising incomes. Separately, this weeks quarterly refinancing auction came in $2 billion less than expected, to $102 billion.
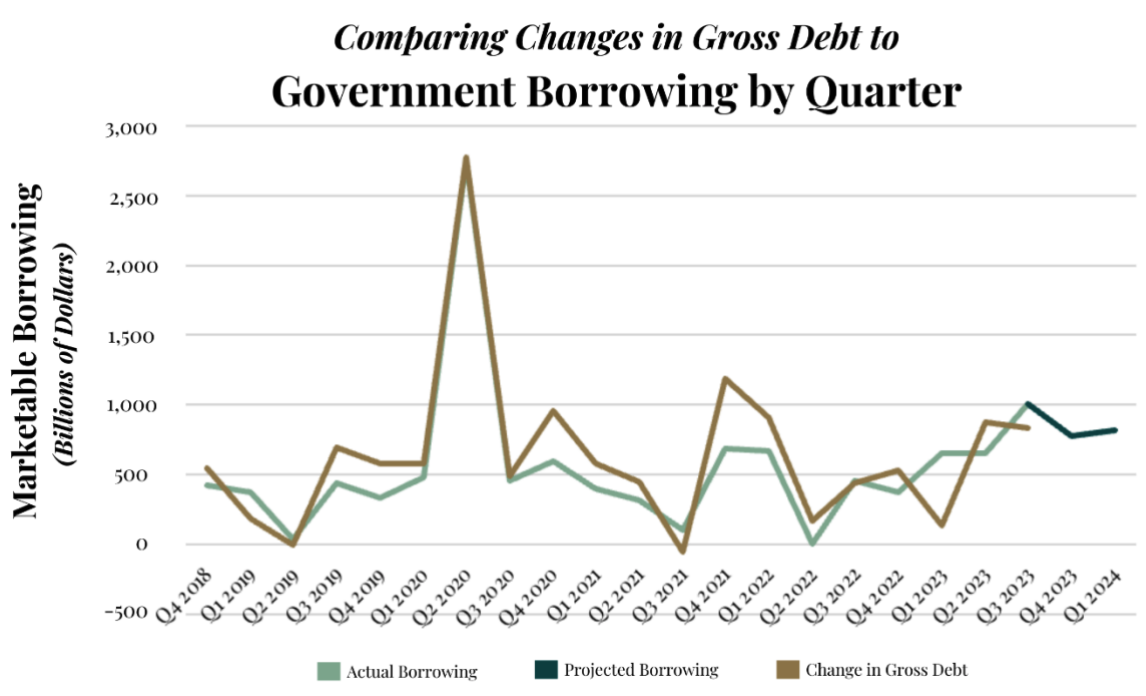
Such news made the market seem overly happy, with both 30 yr and 10 yr falling by nearly 40 bp. Considering that supply pressure is still there, such a decline may be an overshoot. Good news from the bond market rarely lasts long.
Bank of Japan + new government stimulus
As market rumors have it, the Bank of Japan has once again relaxed its control over the yield curve, but in an extremely ambiguous manner. In short, the Bank of Japan can now allow the 10-year Japanese government bond yield to be higher than 1%, but it will not let it go too far. Far. This caused the yen to fall sharply to 151.7 and Japanese stocks rose 7%. It seems that BOJ is determined to give up the exchange rate to protect debt. However, some analysts believe that this is just an ambiguity in language. In fact, BOJs cancellation of the JGB 10 yr fluctuation hard limit is equivalent to the cancellation of YCC. So we see that Japanese bond yields rise, but the stock market and usdjpy also rise together, and the markets understanding of this matter is actually divided. But in general, it is definitely not appropriate to bet on Japanese yields falling again. It may be a very good time to be long the yen.
In addition, last Friday’s financial news was ignored by many. The Japanese cabinet approved a 17 trillion yen (US$110 billion) economic stimulus package, which mainly includes tax rebates, energy price subsidies, and encourages companies to increase wages. measures to encourage domestic investment in semiconductors and promote population growth, up to 3.1% of GDP. If local government spending and state-backed loans are included, the scale of the plan totals 21.8 trillion yen, up to 3.1% of GDP. 4%.
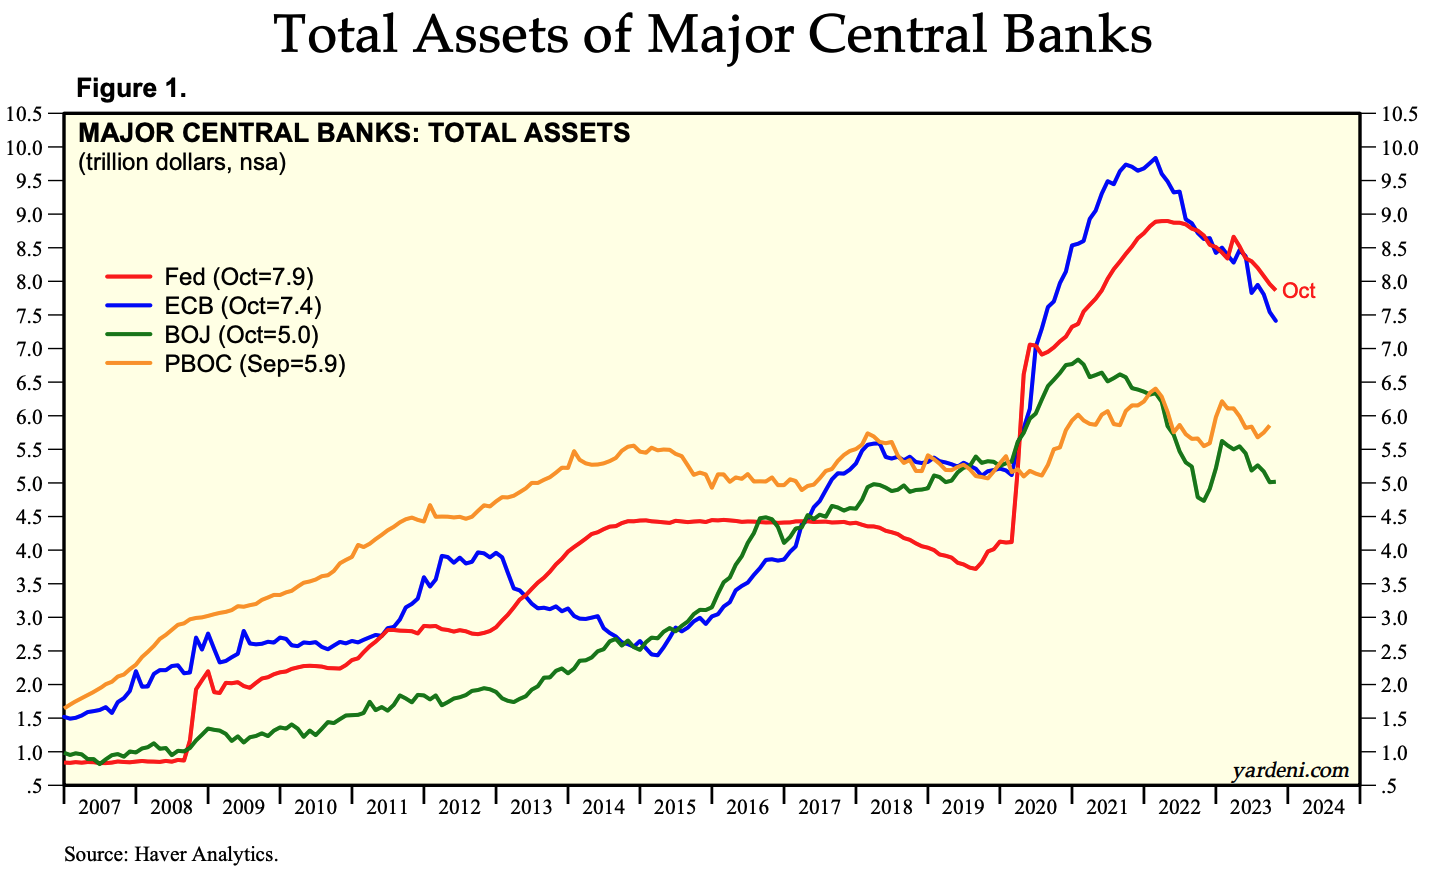
Japan has the highest debt-to-GDP ratio in the world (262%).
Following the Chinese government, the Japanese central governments increased leverage will export more cash from the East to the market, and the central banks balance sheet reduction may be hedged.
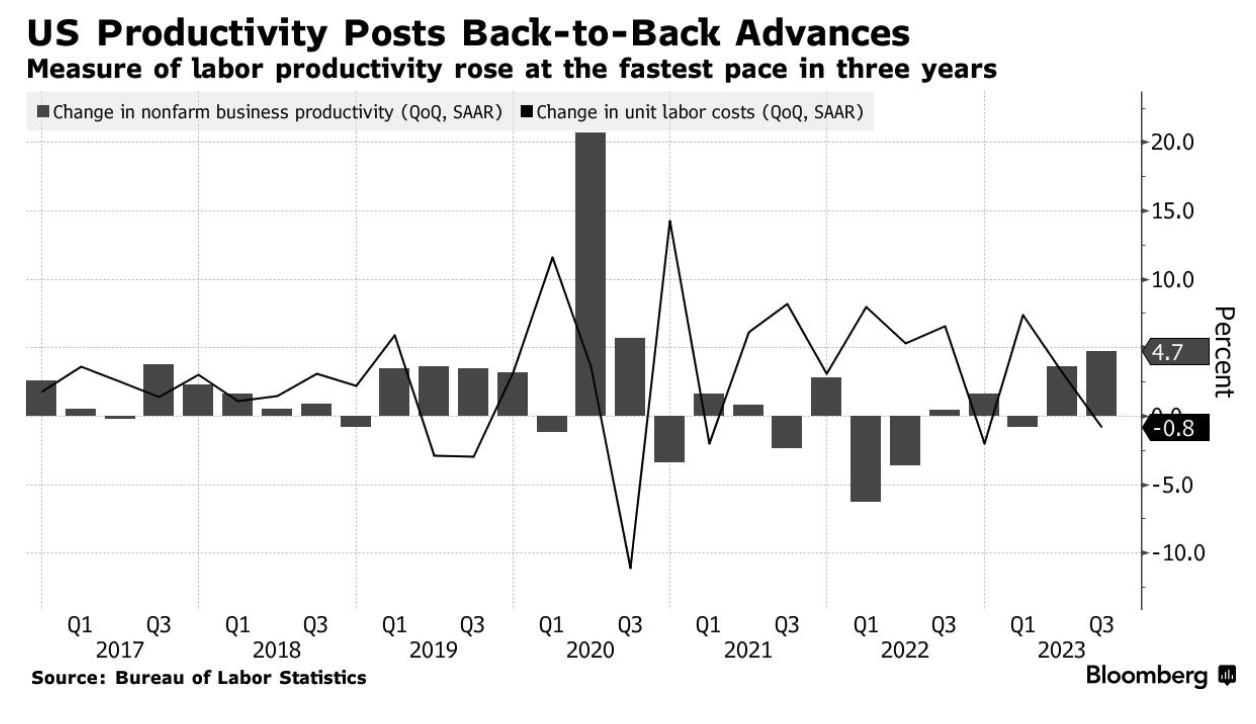
Labor costs and employment figures both fell
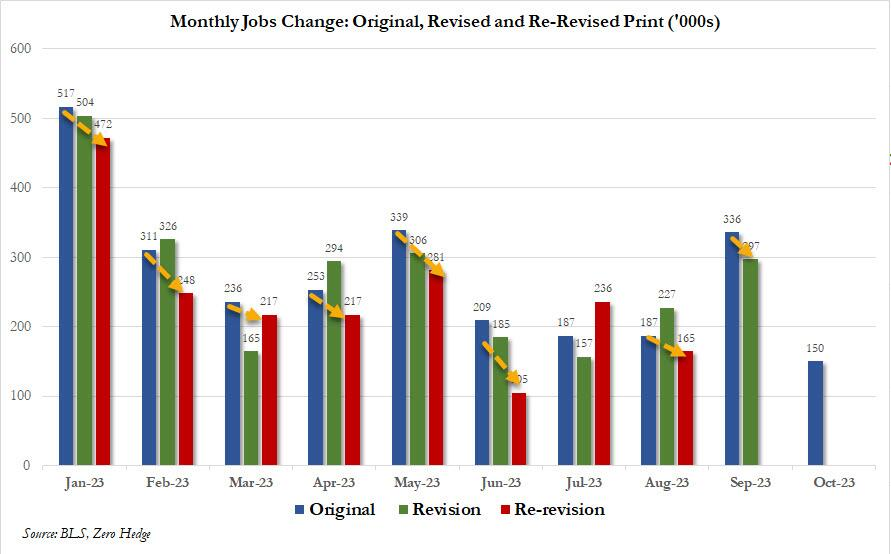
Productivity increased at an annualized rate of 4.7% in the third quarter, following a 3.6% increase in the previous quarter. Unit labor costs fell 0.8% after rising 3.2% in the second quarter. This is the first decline since late 2022. It can be said to be very unexpected. The market was originally expected to rise by 0.7%. Superimposed, the number of new non-farm jobs in the United States in October slowed more than expected to 150,000 vs. 180,000 expected, while the unemployment rate rose to 3.9%, the highest level since January 2022. Even without taking into account the more than 30,000 jobs created by the UAW strike, this number is relatively poor.
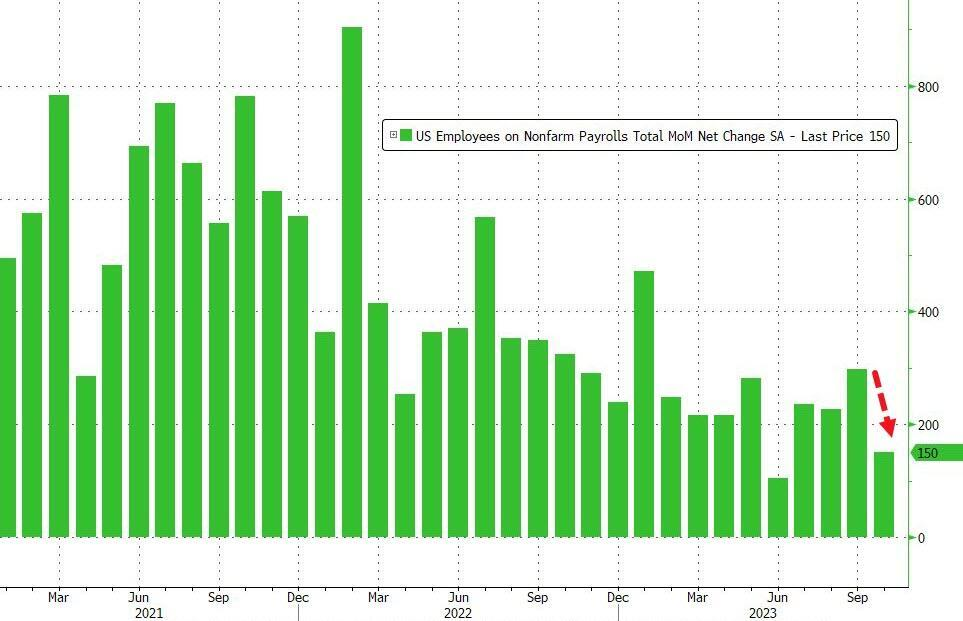
In addition, as expected, the employment figures in August and September were revised down sharply. In eight of the first nine months of this year, the data were revised lower than the initial values. The data continues to be unreliable, which makes all economists and economists who rely on data... Traders will feel the pain:
Stock market performance in an election year
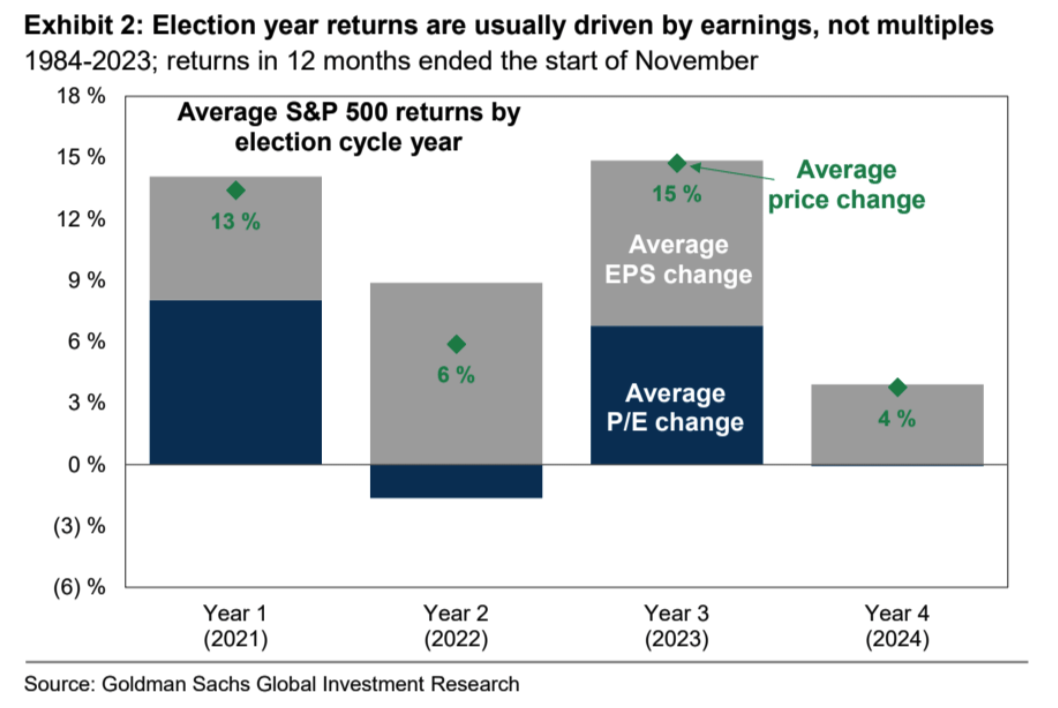
With just over 1 year to go until the general U.S. election, U.S. politics is entering a more complex year, with stock market returns tending to be below average in election years. Since 1932, the SP 500s 12-month return before an election has averaged 7%, compared with 9% in non-election years. Stock market performance has been even weaker before elections in recent history, with the SP 500s average return in the 12 months before 10 presidential elections of just 4%.
While earnings typically grow in election years, stock market valuations are typically flat:
Stock market volatility is typically above average. Since 1984, realized volatility has averaged 18% in the year before an election and 16% in non-election years.
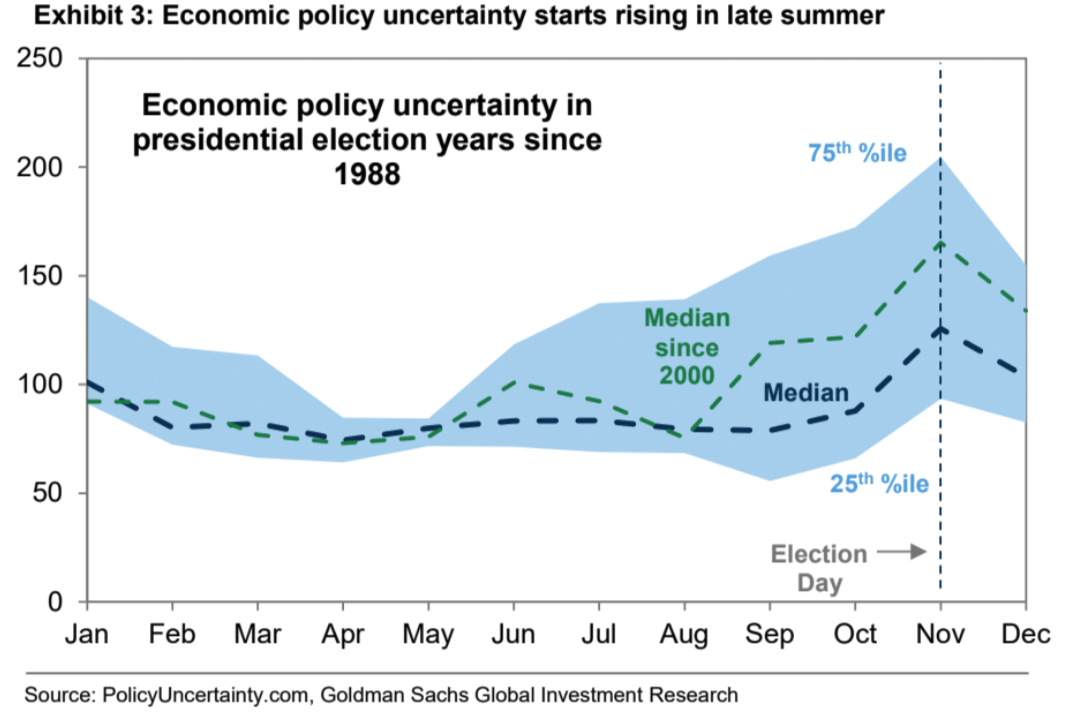
The Economic Policy Uncertainty Index typically rises before an election.
After a presidential election, stocks typically rebound strongly as uncertainty dissipates. The policy uncertainty index typically declines in the weeks after an election as investors gain more clarity on the policy implications of the outcome. The median since 1984 shows the SP 500 gained 5.0% in the eight weeks from election day to the end of the year, compared with 2.6% for the same period in non-election years.
Hartnett, chief executive of Bank of America Merrill Lynch, believes next years panic will be truly eye-catching: So much anger, so much hatred, but the unemployment rate is so low; can you imagine if the unemployment rate reaches 5%, society will be chaotic? That’s why policy panic is happening in early ’24.”
position
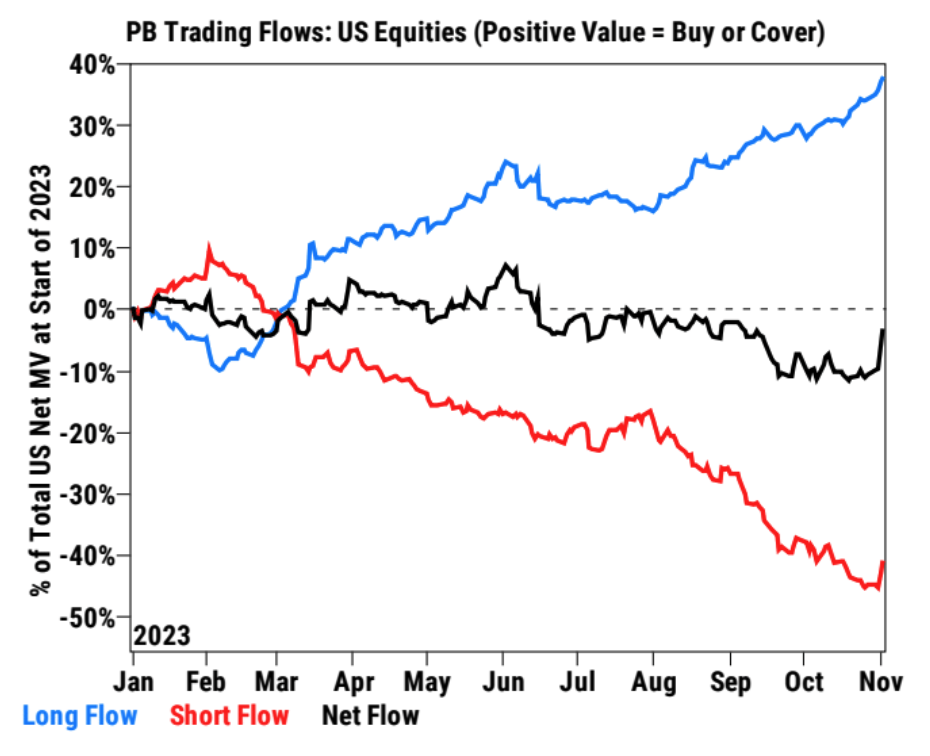
Goldman Sachs Prime Data: Hedge funds were actively net buying U.S. stocks following the FOMC meeting, the largest 5-day net buying since December 2021 (99th percentile over the last 5 years). Short cover and buying long are both obvious.
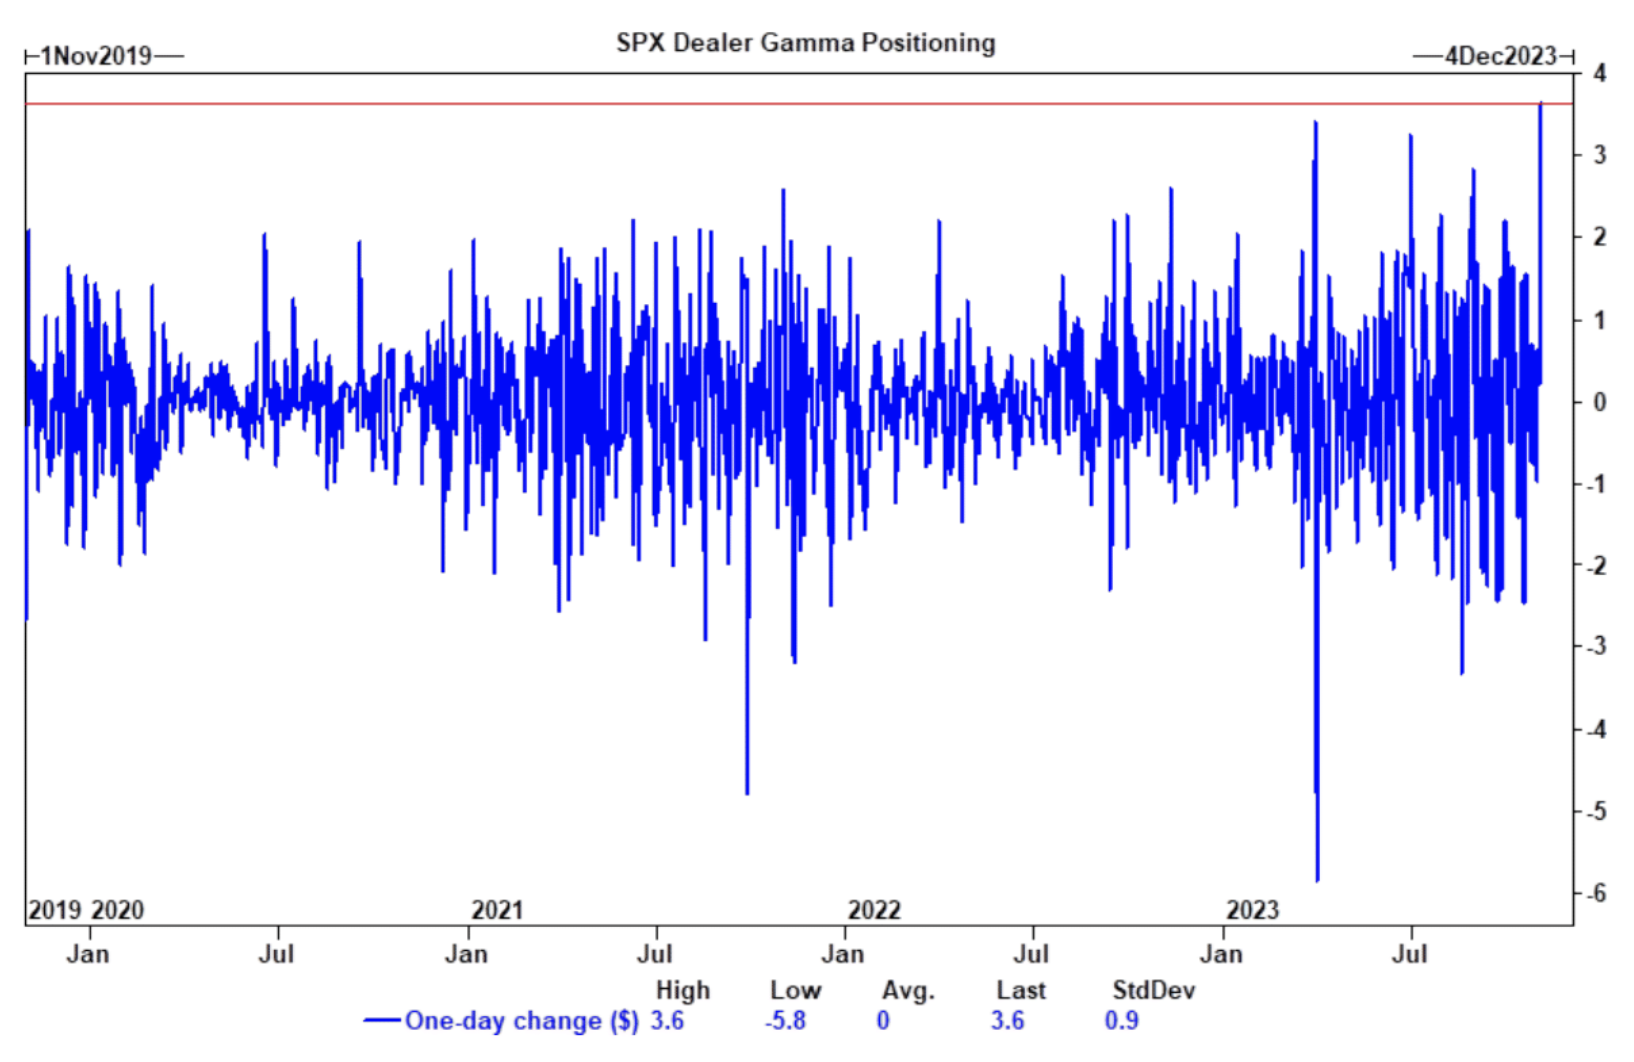
SPX Gamma saw its largest-ever single-day increase on Thursday, suggesting the market is rushing to increase portfolio exposure:
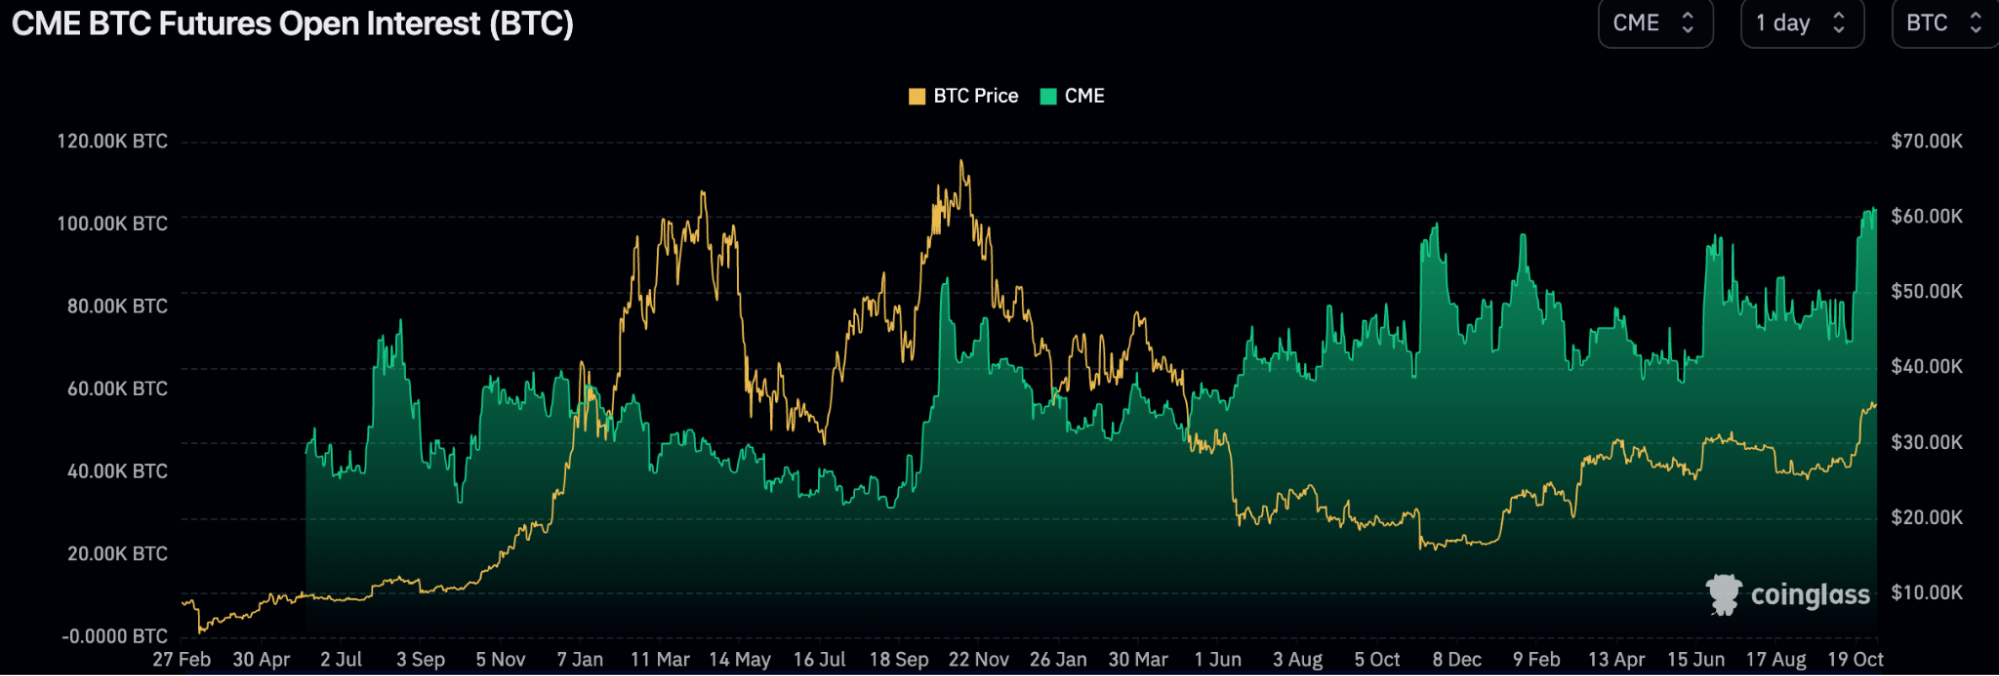
Open interest in CME’s BTC-margined futures contracts hit a new all-time high last week, even though BTC prices are only 53% of their all-time peak:
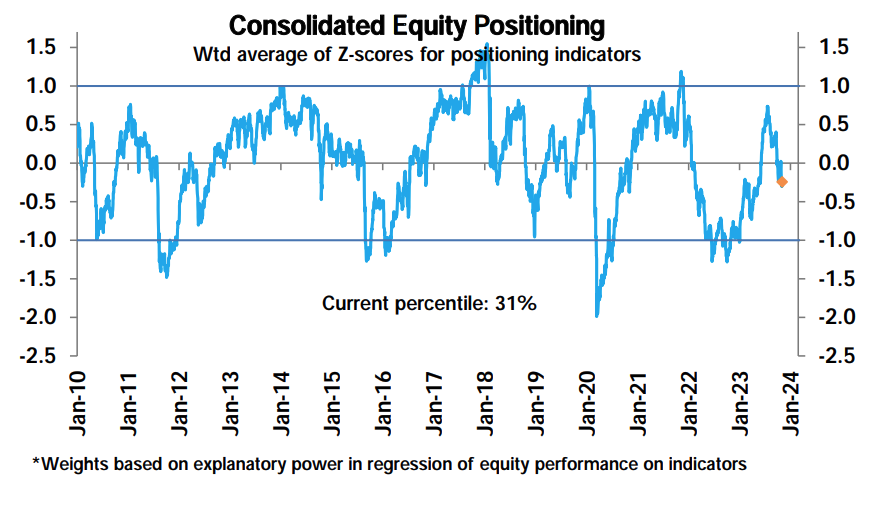
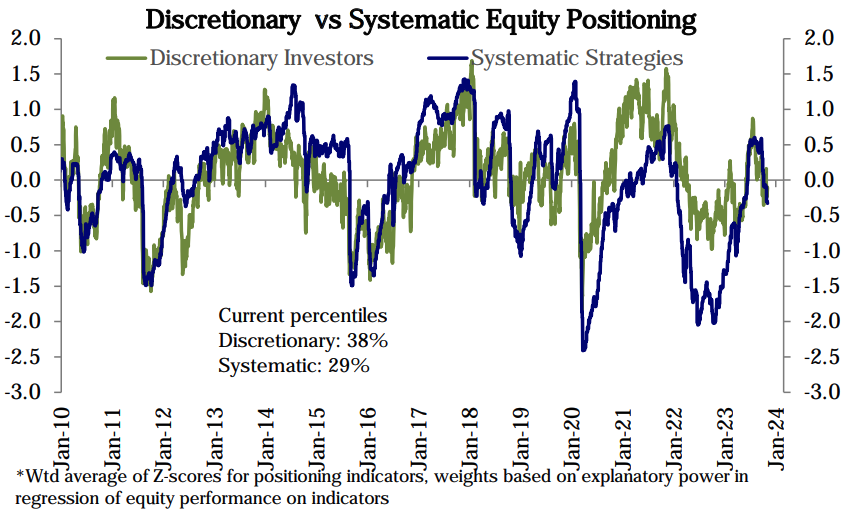
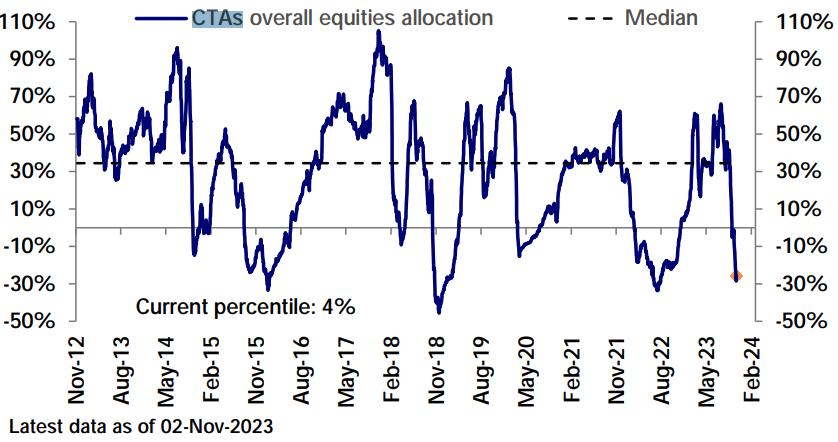
U.S. stock positions fell slightly last week. Despite the sharp rise in the market (it is suspected that many statistical factors are lagging), the comprehensive stock position fell from 33 percentile to 31 percentile, subjective investors 41-38 percentile, and systematic investors 31 percentile. – 29th percentile:
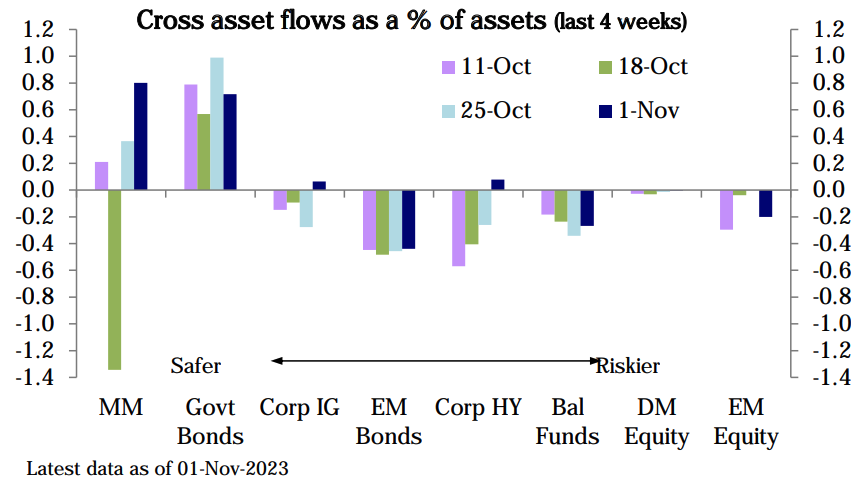
Equity funds (-$3.4 billion) saw outflows for the fourth consecutive week led by redemptions from emerging market equity funds (data through Wednesday) Bond funds ($2.2 billion) attracted inflows for the fourth consecutive week. Inflows to money market funds ($64.2 billion) accelerated, especially in the United States ($66.2 billion)
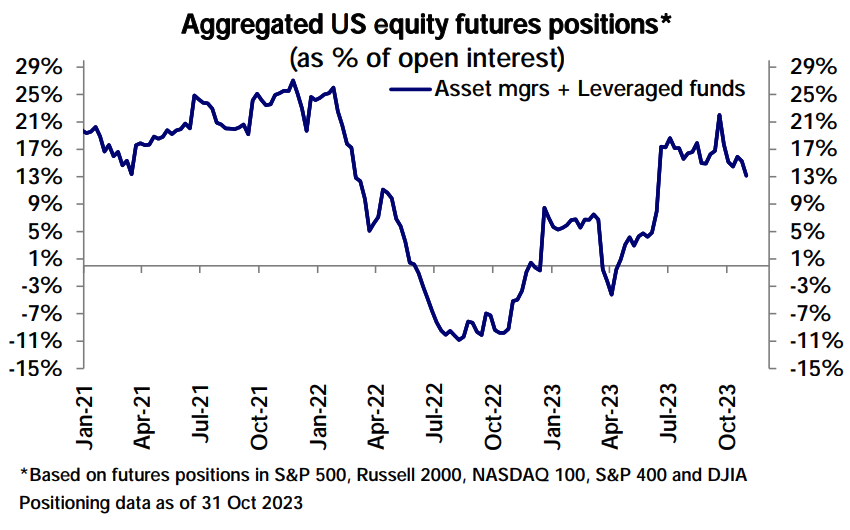
CFTC futures data (as of Tuesday) showed net long positions in U.S. stocks fell, with net long positions on the SP 500 and Nasdaq 100 declining and net shorts on the Russell 2000 declining for a fourth straight week. Net short positions on the U.S. dollar decreased. Net long positions in oil fell slightly. Net long positions in gold increased.
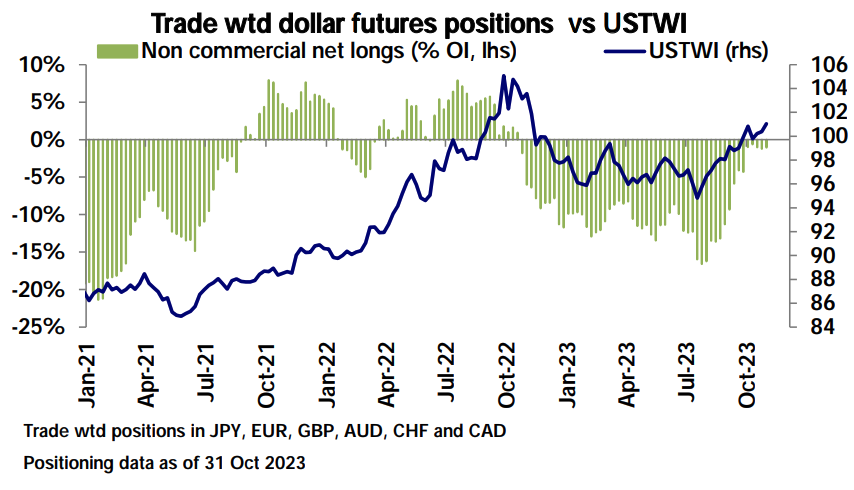
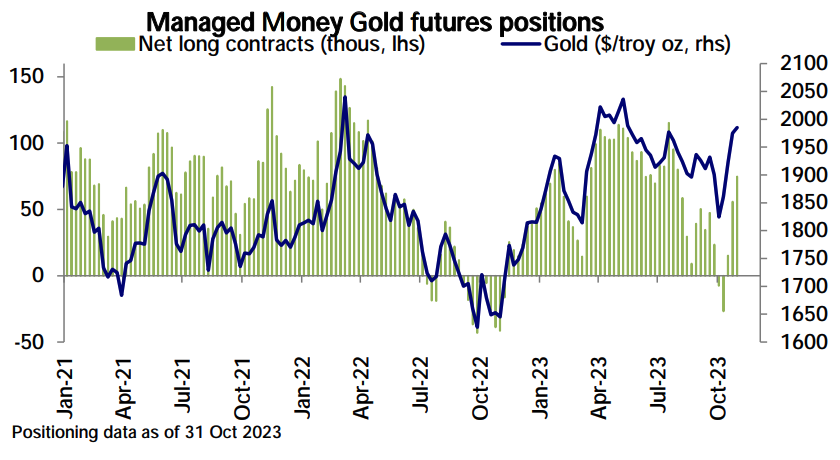
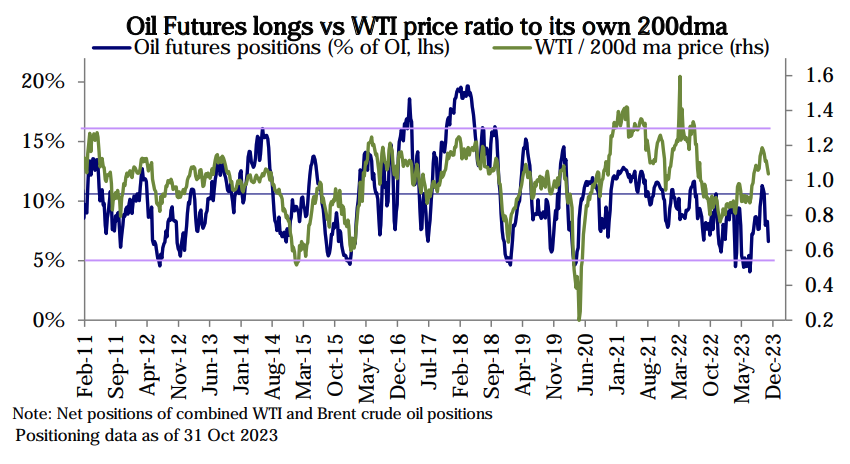
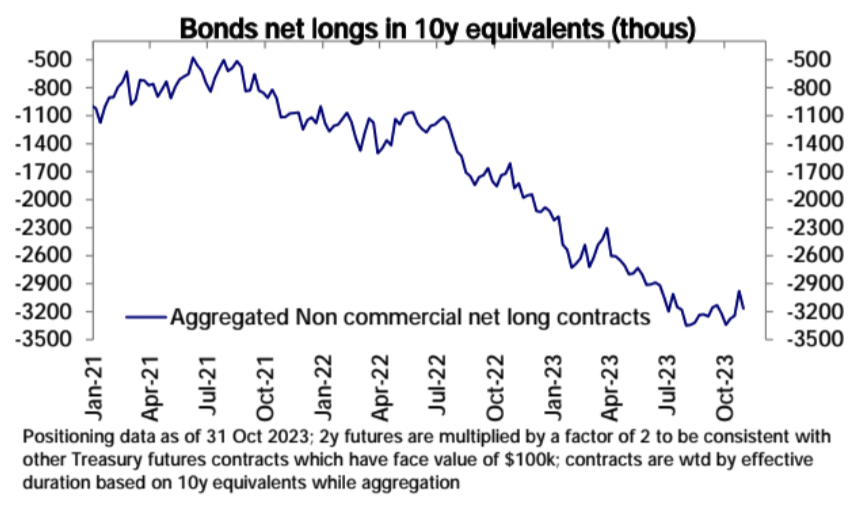
Bond shorts have re-accumulated (but market yields only started to fall sharply on Wednesday):
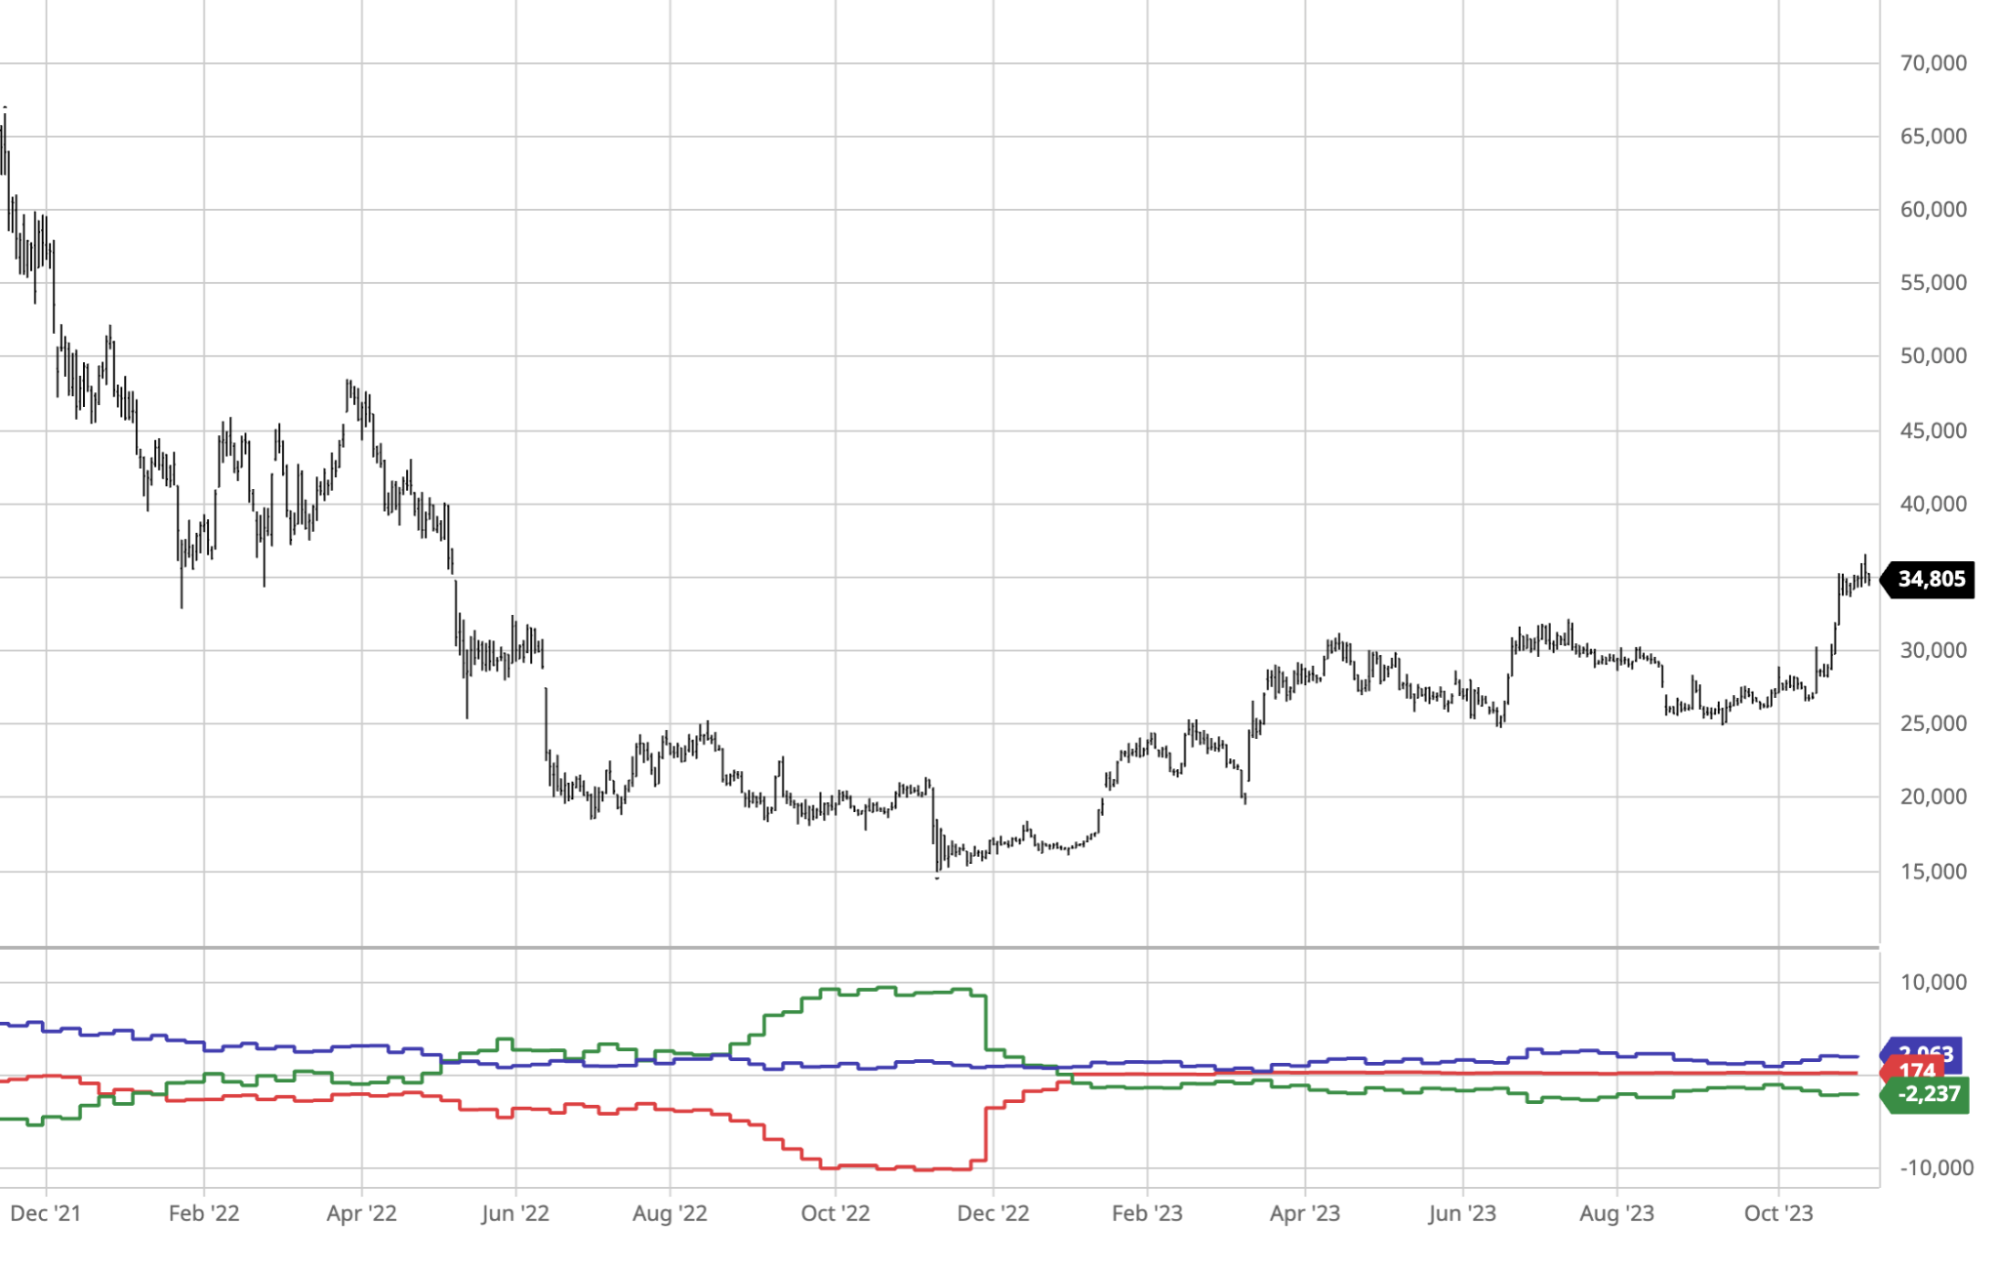
CME Bitcoin speculative net short positions have decreased slightly, as shown by the green line in the figure below. Except for last week, speculative net short positions have been rising in the previous three weeks, despite the sharp rise in BTC prices:
mood
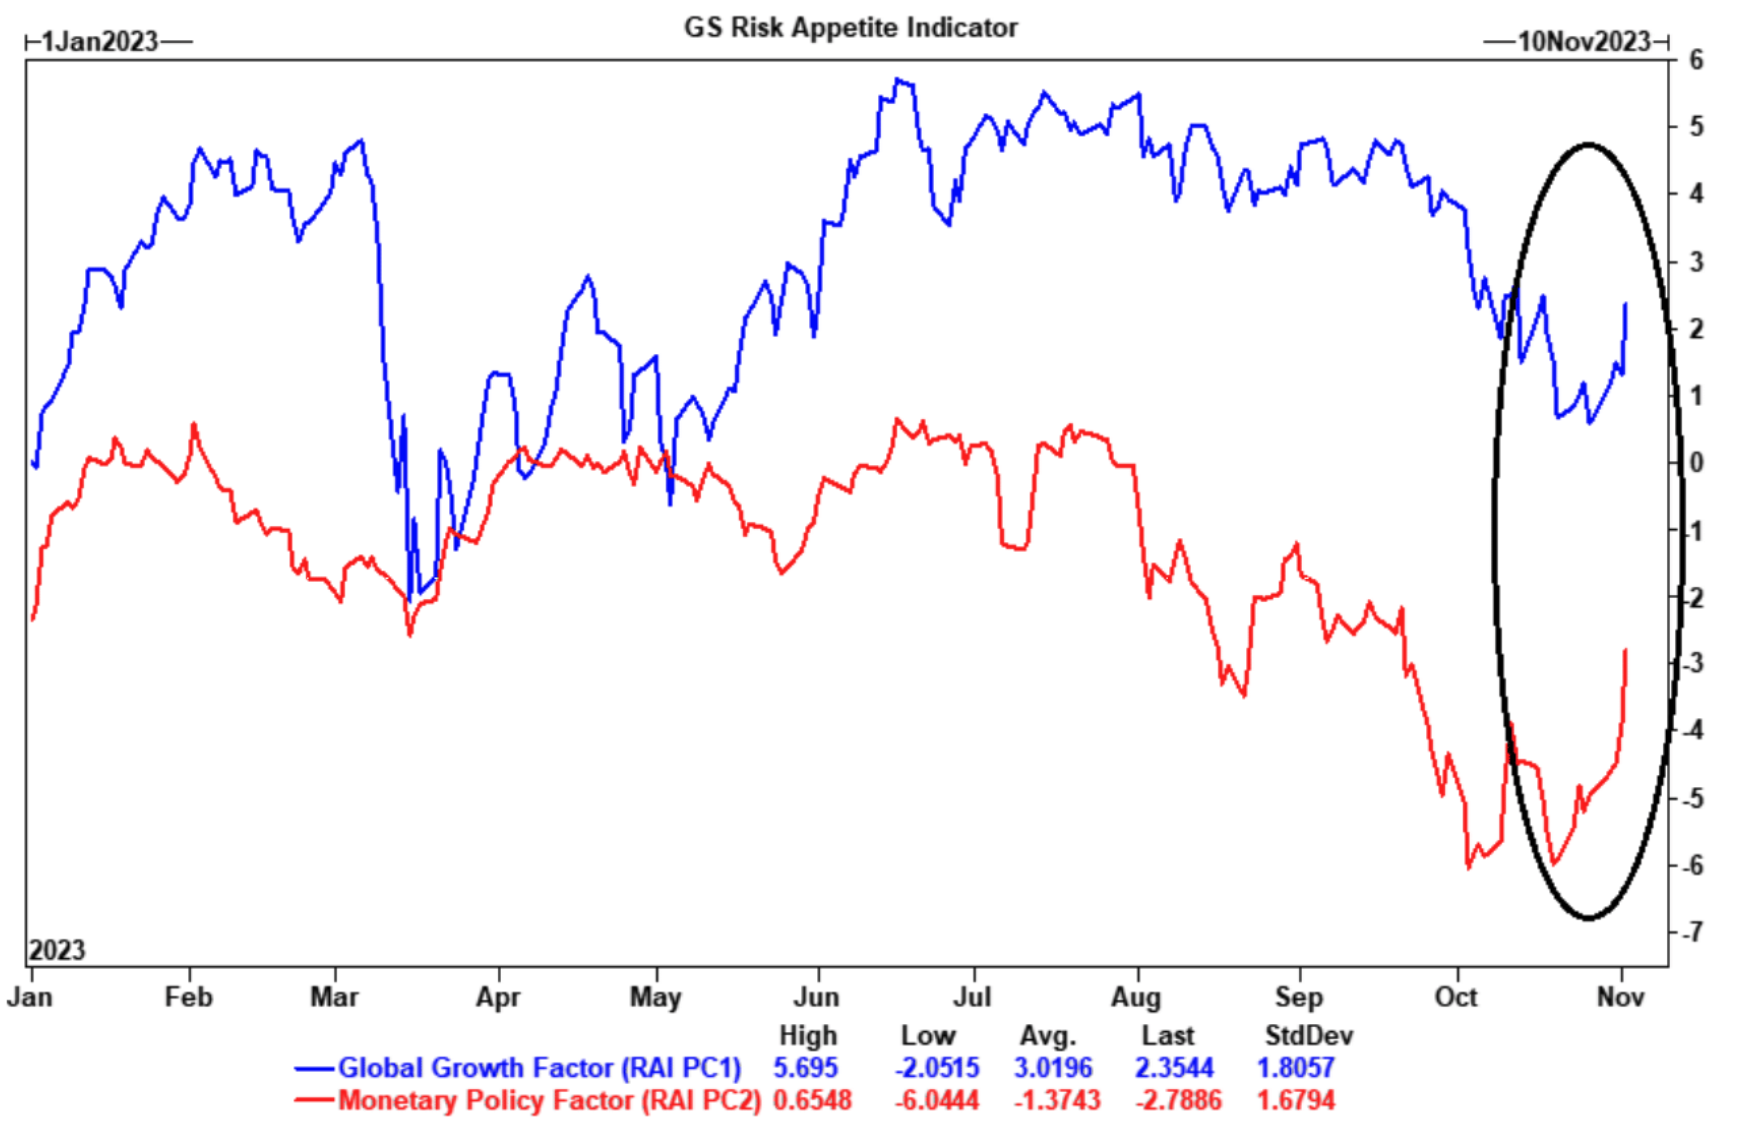
Goldman Sachs’ internal risk appetite indicator jumped, with monetary policy expectations and global growth expectations both rising, a backdrop similar to what we saw early in the summer:
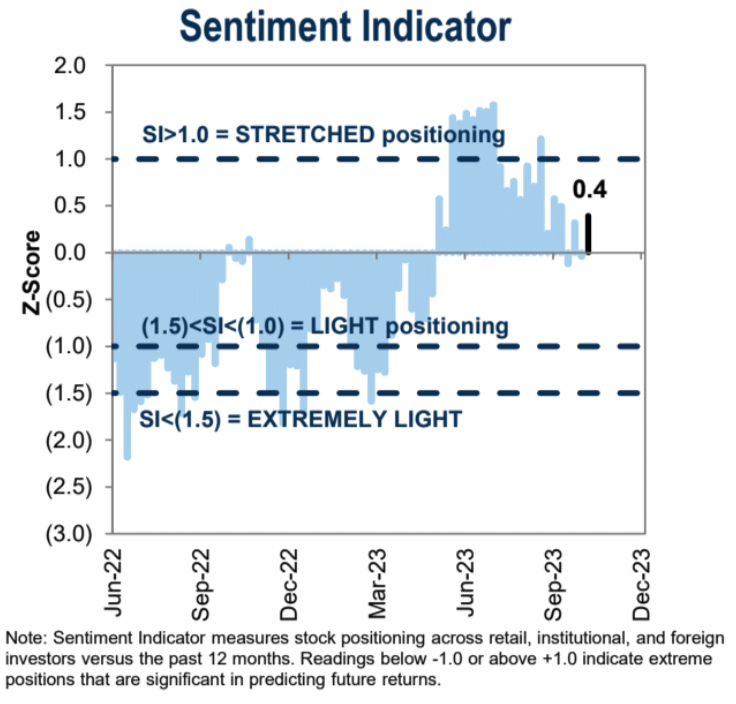
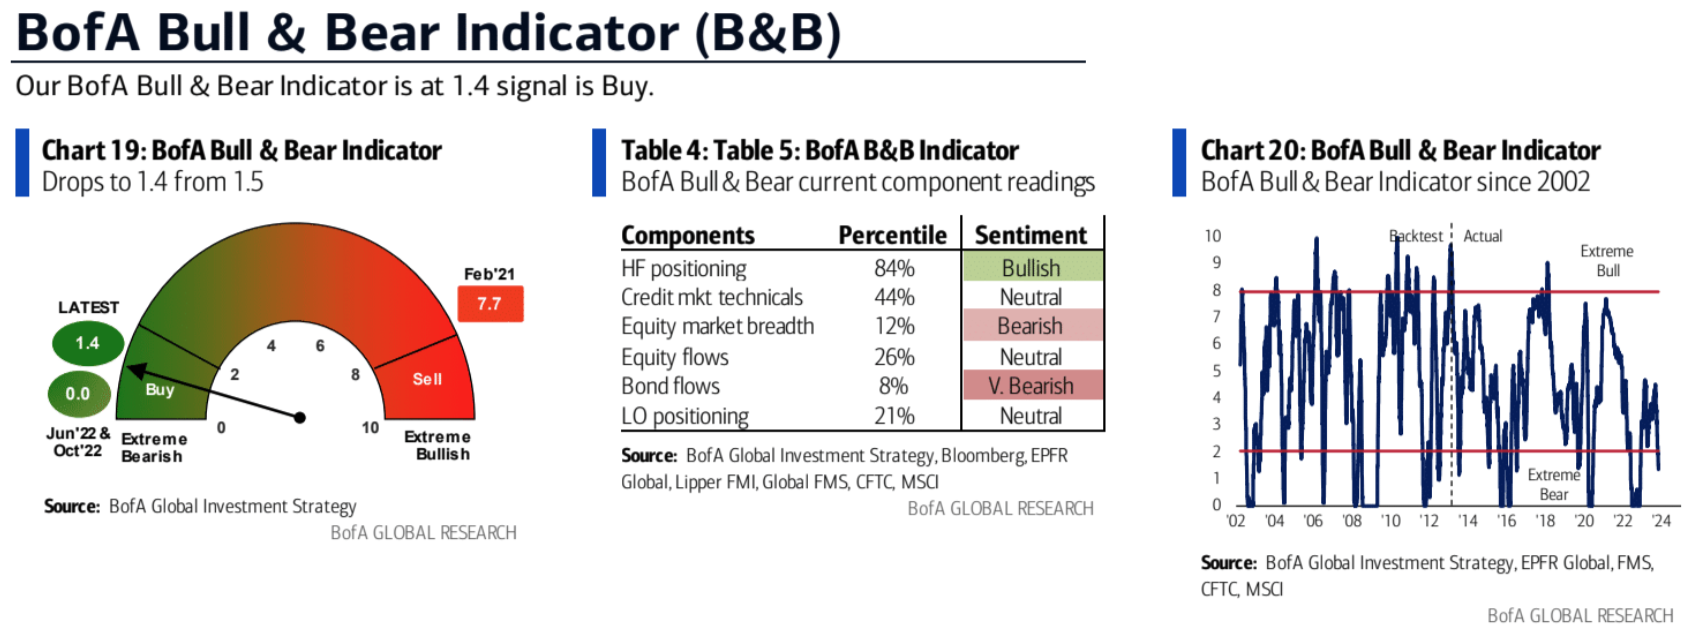
The BofA Bull Bear Index indicator fell to 1.4 last week, its lowest level since November 2022, and issued a reverse buy signal for the third consecutive week. Historically, in the 12 weeks after its trigger, The stock market rose an average of 6%.
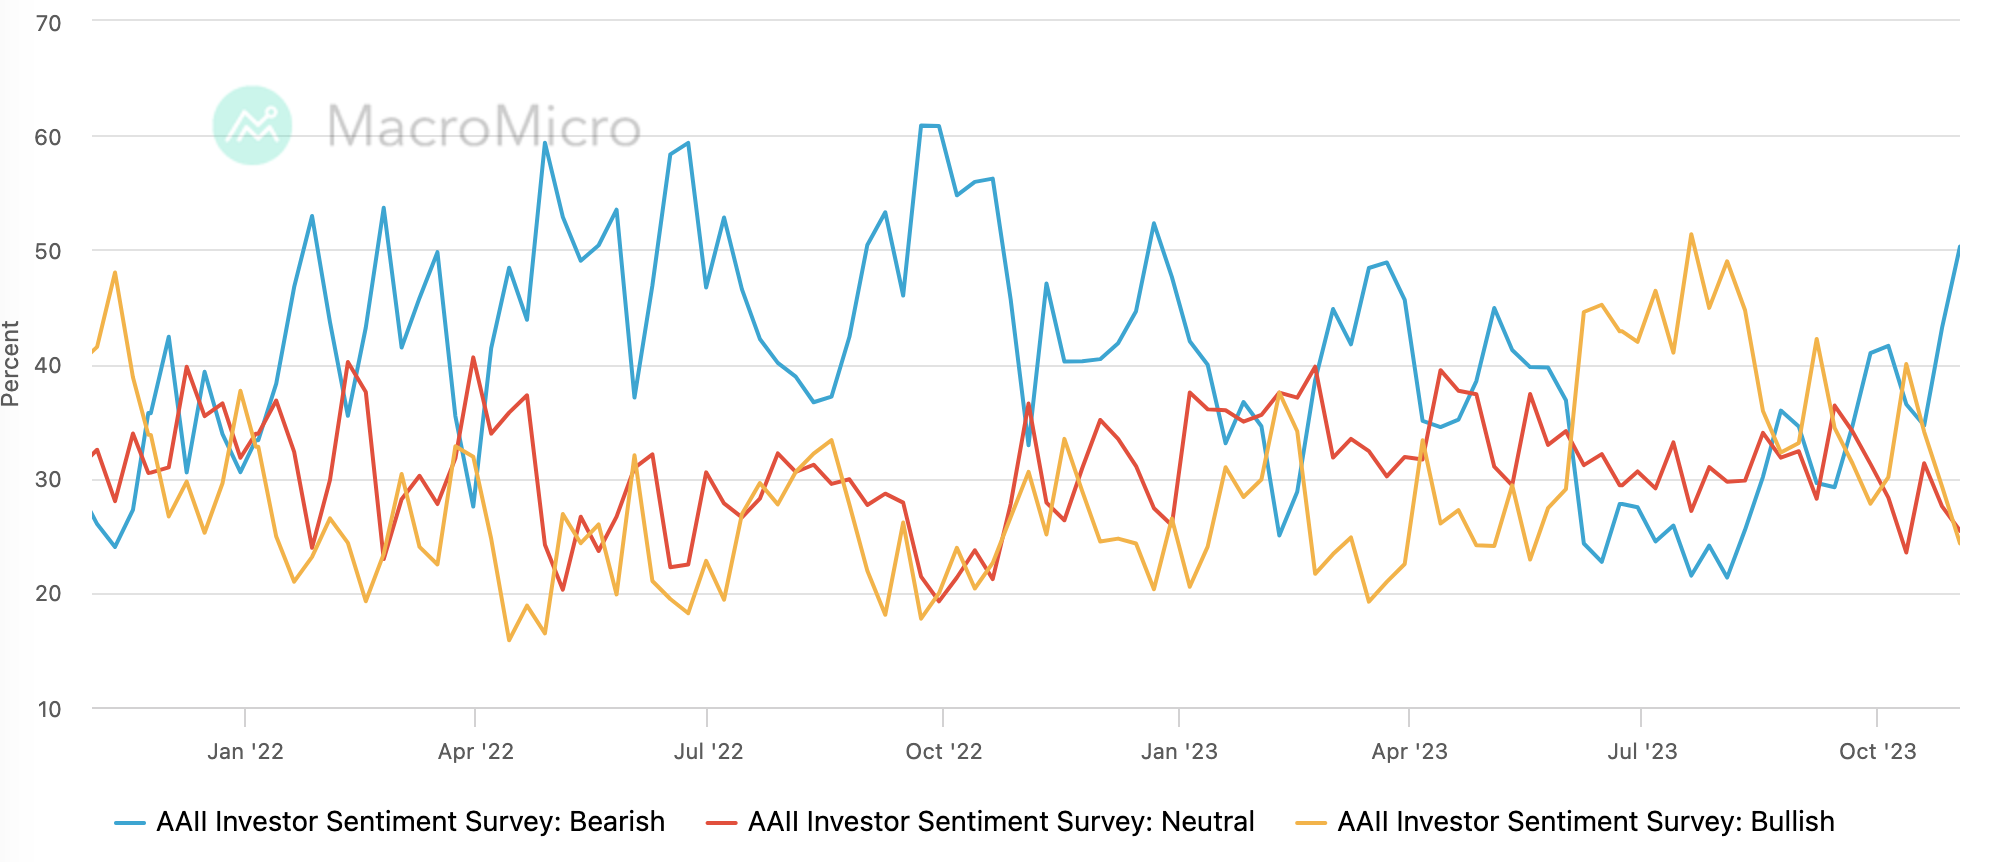
AAIIs sentiment survey and market conditions rarely deviated significantly, with the bearish ratio rising to the highest level of the year, 43.18 – 50.28%:
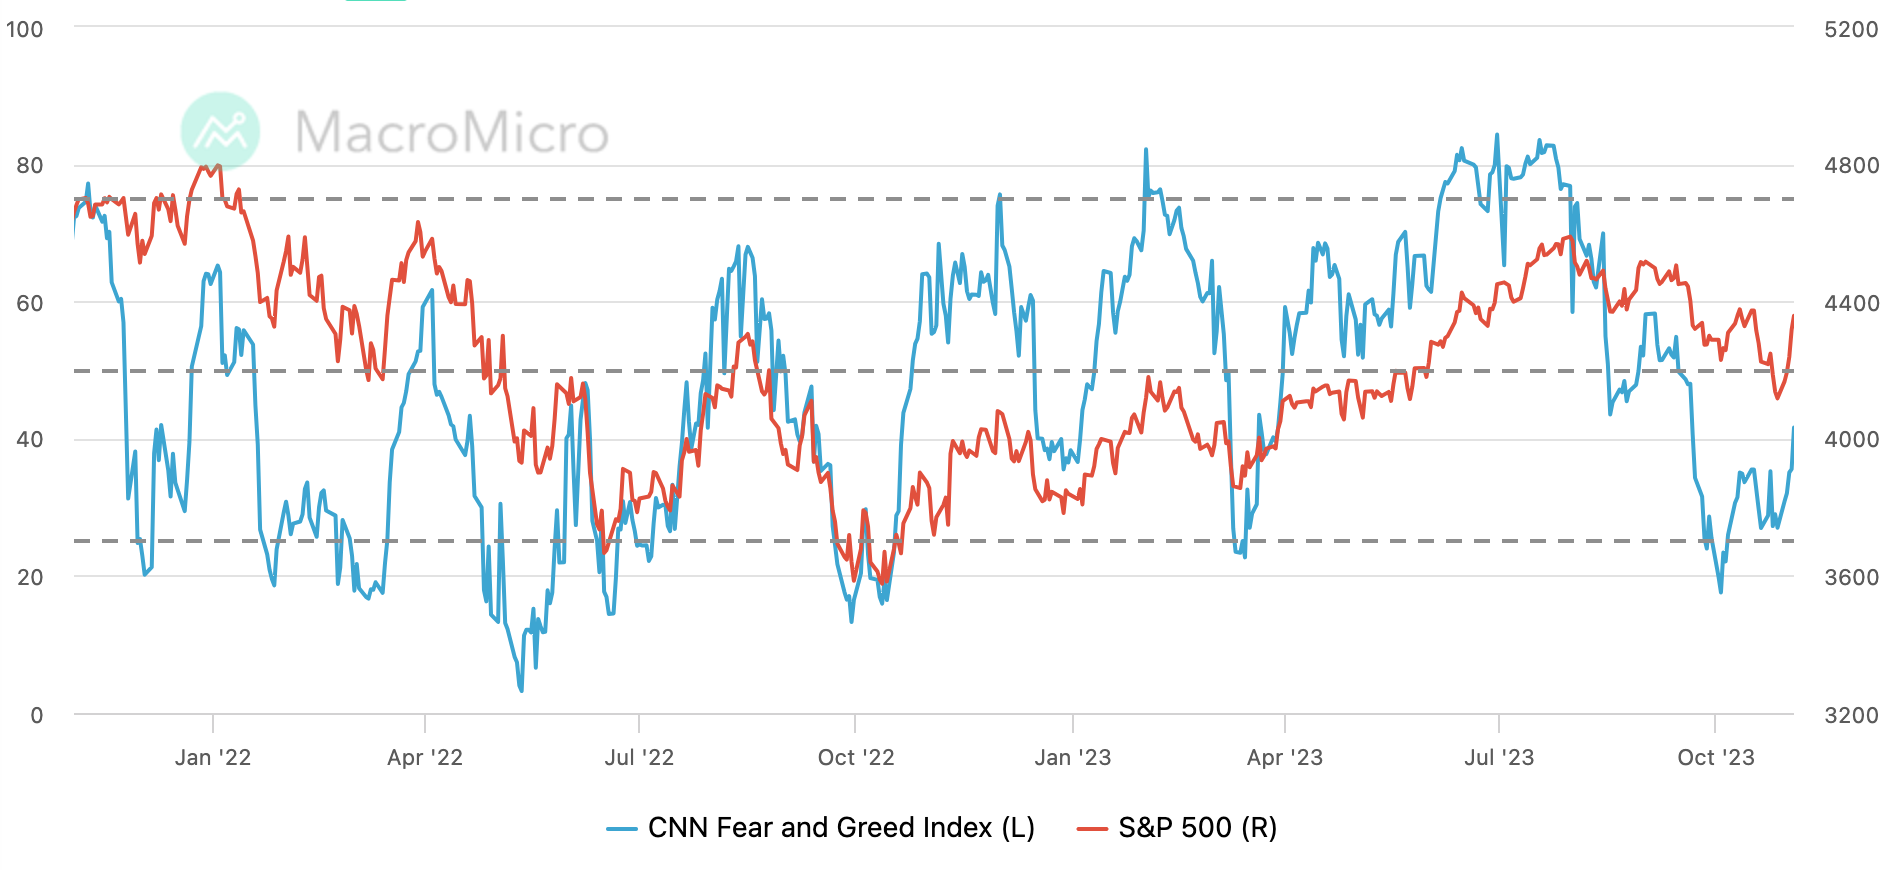
The CNN Fear and Greed Index rebounded above 40, still below neutral:
Outlook for this week
Since we called the U.S. stock market to rebound based on position and sentiment data last week, in line with changes in fundamentals and policy expectations, the market has seen aggressive short cover, as well as hyping up previously oversold targets. This sentiment is expected to continue for some time. At least not expected to reverse this week (no big event). However, judging from the general trend of overshooting in the interest rate market and economic slowdown, the upper limit of this round of rebound is not high.