LD Capital: A 10,000-word long article analyzing the king of commodities - crude oil


Original author: Lisa, LD Capital

International crude oil has continued to strengthen recently, with crude oil prices rising nearly 30% from the beginning of July, and Brent oil prices hitting the US$100 mark. As the king of commodities and the mother of industry, crude oil has three major attributes: commodity, finance, and politics. The factors that affect prices are complicated. This article will try to analyze the crude oil market from the aspects of development history, supply and demand relations, and geopolitics.
1. Development history of crude oil market
1. Rockefeller Era
In 1870, Rockefeller founded Standard Oil Company and became the famous Oil King, monopolizing more than 90% of the United States refining capacity. Then in 1911, the U.S. Supreme Court ordered the dissolution of the Standard Oil Company, which became the first antitrust case in the history of world business. Standard Oil was broken up into 34 companies, the most important of which were the following 7 companies. In the years after the breakup of Standard Oil, major oil companies exploited large amounts of oil while engaging in price wars, and prices remained relatively stable.
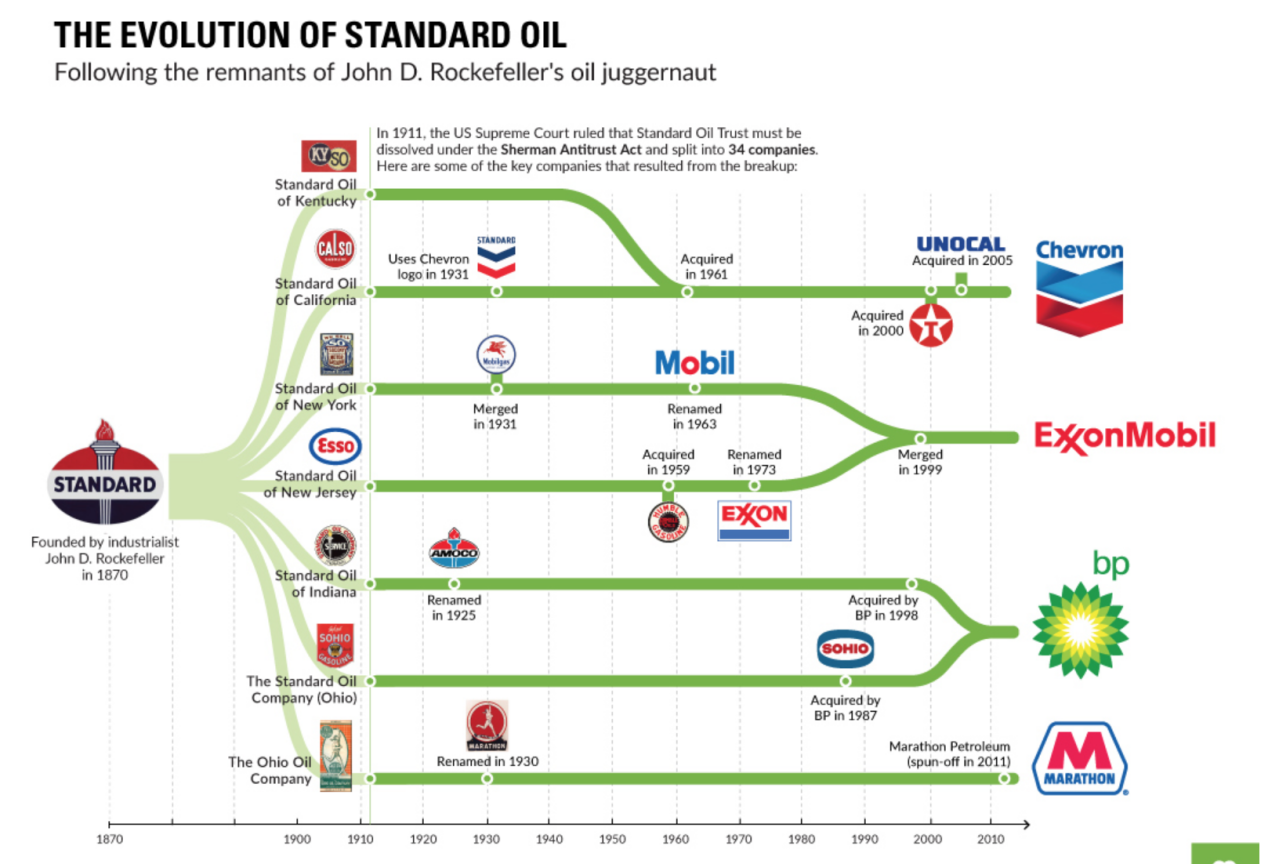
Source: visualcapitalist.com
2. The Era of the Seven Sisters
After the end of World War I (1914 – 1918), Britain and France signed the Saint-Moray Agreement on April 25, 1920 to carve up the oil resources in the Middle East. The two parties decided to jointly monopolize oil exploration in the region and restrict the United States from entering. Mesopotamian oil fields. This undoubtedly aroused dissatisfaction in the United States. With the efforts of the United States, in 1928 Britain, France, the Netherlands and the United States signed a new Red Line Agreement to replace the Saint Morey Agreement, which stipulated that the United States, Britain, France, and the Netherlands would use Egypt within the scope of the agreement to The Gulf region has equal rights to oil extraction. Since the signing of the Red Line Agreement, the United States has made great progress in expanding its oil footprint in the Middle East.
In order to control prices, major oil companies formed a cartel known as the Seven Sisters after 1928, including Exxon, Mobil, Chevron, Texaco ), Gulf, BP and Royal Dutch Shell, the first three of which are the successor companies to Standard Oil. The Seven Sisters monopolized the oil and gas resources in the Middle East. At that time, they owned almost all the oil exploration rights in the Gulf countries, and controlled international oil prices as well as oil production and trade. The country where the oil resources are located has neither production technology nor trade channels, so it can only be firmly controlled by Europe and the United States.
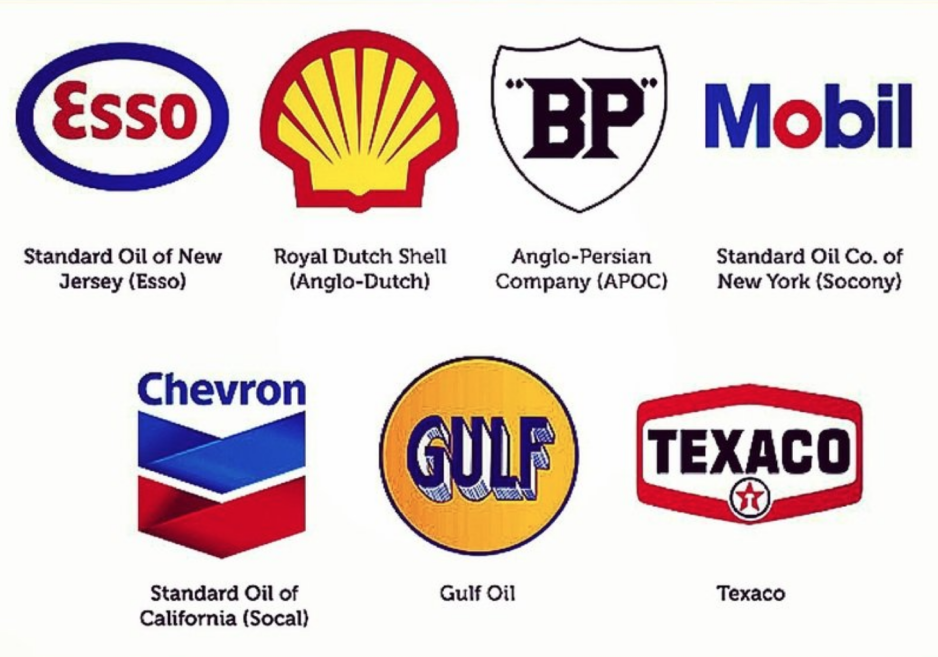
Source: twitter @Kah 11 Hau 11
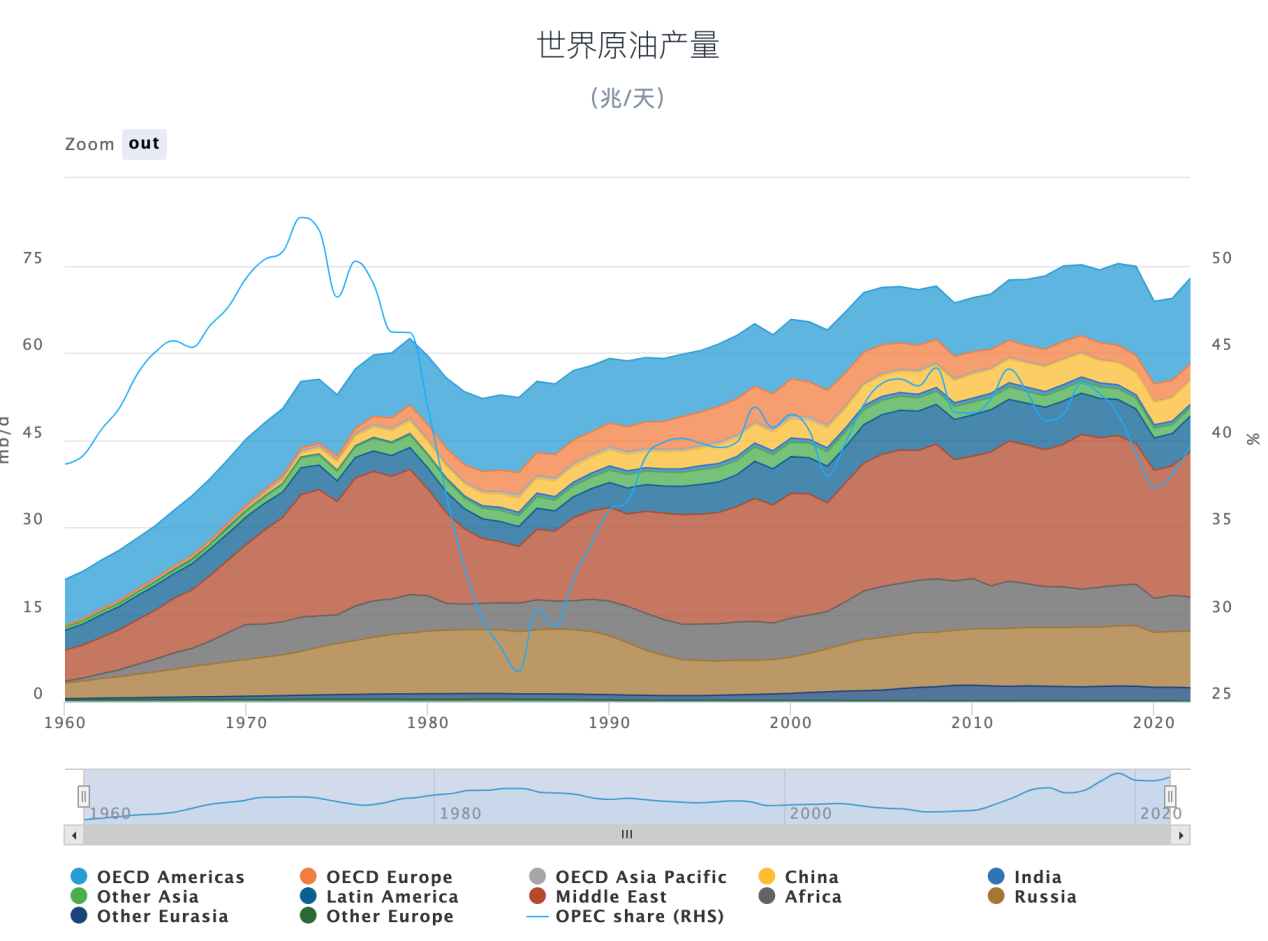
From 1939 to 1945, with the outbreak of World War II, demand for oil increased dramatically and it became the most important strategic energy source. After World War II, countries generally realized the importance of oil extraction. A large number of countries and companies joined the competition in the oil market. In the 1950s, oil extraction volume began to grow exponentially.
total world oil production
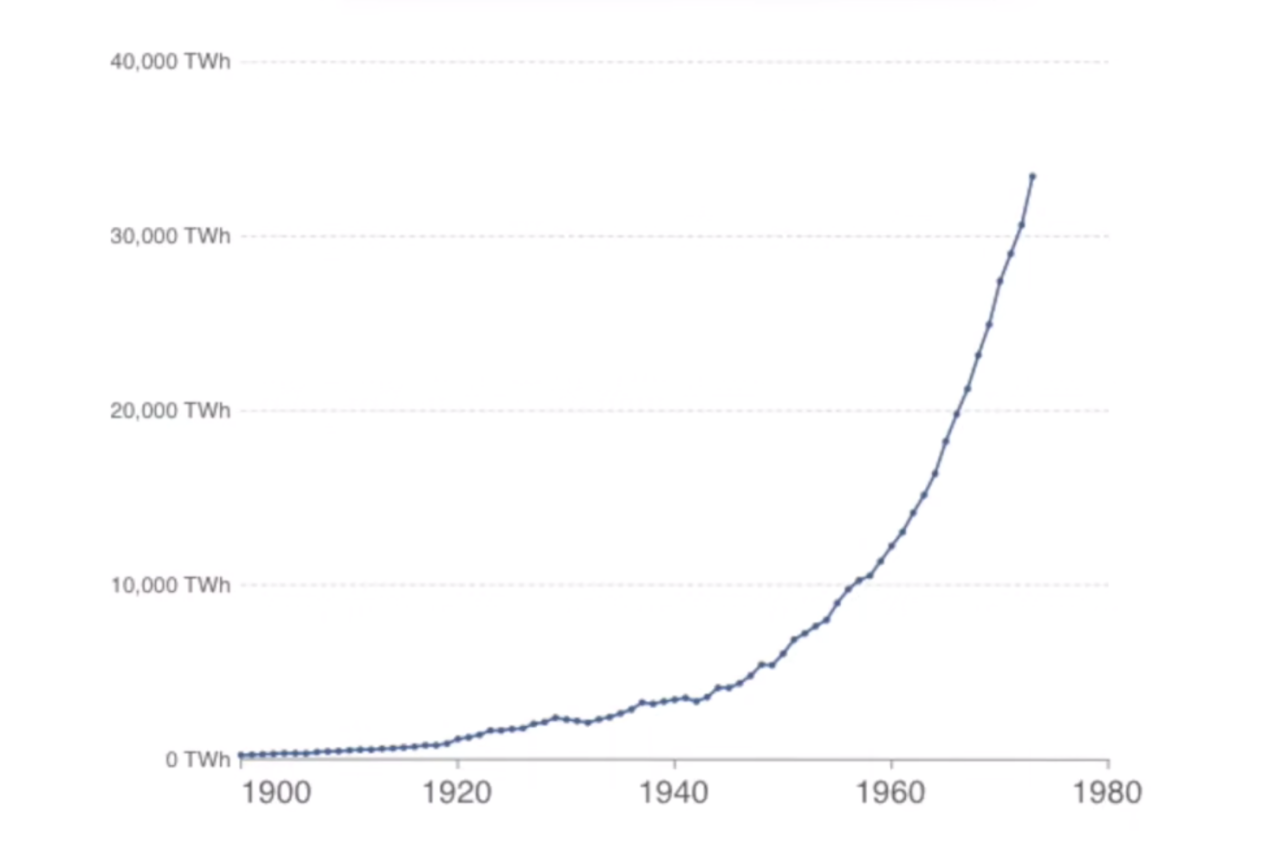
Source: Xiaolin said
3. OPEC Era
After being suppressed by Western countries for more than 20 years, in order to oppose the control and exploitation of Western oil monopoly capital, oil-producing countries established the Organization of the Petroleum Exporting Countries (OPEC) in Baghdad, the capital of Iraq, in 1960. Its purpose is to coordinate and unify the oil policies of member countries, maintain price stability in the international oil market, and ensure that oil-producing countries receive stable income. From 1961 to 1975, OPECs membership expanded from the original five (Iran, Iraq, Kuwait, Saudi Arabia and Venezuela) to the current 13, including Algeria, Angola, the Republic of Congo, Equatorial Guinea, Gabon, Iran, Iraq, Kuwait, Libya, Nigeria, Saudi Arabia, United Arab Emirates, Venezuela. During this period, Middle Eastern countries also launched a wave of nationalizing oil field assets, regaining control of oil production to a large extent.
The Bretton Woods system ended in 1971, and the United States and Saudi Arabia signed an agreement in 1974. Since then, the U.S. dollar has been tied to oil, and a global petrodollar settlement system has been formed.
4. Three oil crises
Most of the worlds most important oil resources are located in politically sensitive areas, so oil prices are greatly affected by geopolitics. Once a war breaks out in these areas and supply disruptions occur, it is easy to cause crude oil prices to surge.
The first oil crisis (1973 ~ 1975)
When the Fourth Middle East War broke out in October 1973, the United States openly airlifted weapons and provided large amounts of military assistance to Israel. In order to attack Israel and its supporters, OPEC decided to use oil weapons, announced an increase in oil prices, reduced oil production, and imposed an oil embargo on Western developed capitalist countries. Oil prices rose sharply, and the first oil crisis broke out.
At that time, the price of crude oil increased nearly 4 times, and the economies of Western countries were in chaos, eventually triggering an economic crisis.
Second oil crisis (1979 – 1980)
At the end of 1978, the Islamic Revolution broke out in Iran, which finally overthrew the pro-American Pahlavi dynasty and caused violent social and economic turmoil. From the end of 1978 to the beginning of March 1979, Iran stopped exporting oil for 60 days. The oil market was short of 5 million barrels of oil per day, accounting for about 1/10 of the worlds total consumption. The following year in 1980, the Iran-Iraq War caused a sharp decline in oil production, triggering yet another global recession.
The Third Oil Crisis (1990 – 1992)
In 1990, Iraq launched the Gulf War against Kuwait. Oil facilities in both countries were severely damaged and oil production plummeted. The international oil price climbed from US$14/barrel to US$42/barrel, and the oil crisis broke out. Compared with the previous two oil crises, this time the oil crisis was shorter and its impact was relatively small.
5. Since the 21st century
China joined the World Trade Organization in 2001. Emerging economies represented by China have entered a period of rapid growth in the 21st century, and the demand for crude oil and other bulk commodities has expanded rapidly. Coupled with the impact of the Iraq War, crude oil started a super bull market at the beginning of the 21st century. From 2000 to 2008, oil prices increased nearly five times. In 2008, oil prices exceeded US$100. In the same year, the global financial crisis broke out, and oil prices fell to US$40 in a waterfall. nearby.
From 2009 to 2014, the global floods following the financial crisis, coupled with the large-scale social unrest in the Arab Spring, seriously affected crude oil exports in the Middle East, and international crude oil prices once again entered an upward trend.
At this time, there is a new force changing the global energy supply pattern - shale oil. The development of shale oil in the United States began in the 1990s. With the development of hydraulic fracturing and horizontal well technology, it entered the stage of large-scale commercial development around 2007. The development cycle of shale oil is much shorter than that of traditional oil wells. In 2010 Entering a stage of rapid growth later this year, the U.S. shale revolution increased global oil supply and broke OPECs dominance of the global oil market. Crude oil prices began to fall sharply in 2014.
In early 2016, international oil prices fell to around US$30 per barrel. In order to increase oil prices, OPEC members and 10 non-OPEC oil-producing countries, led by Russia, reached an agreement to limit production in Vienna, the Austrian capital, in December. On July 2, 2019, OPEC and non-OPEC oil-producing countries signed the Charter of Cooperation, and the OPEC+ cooperation mechanism became long-term, mainly through convening meetings to discuss and agree on output to affect oil prices. Crude oil prices have recovered due to production cuts.
With the outbreak of the COVID-19 epidemic in 2020, global production and consumption demand plummeted, and the crude oil market plunged again, reaching a low of only about US$20. Later, oil prices gradually rebounded due to OPEC+ production cuts, the improvement of the epidemic, and recovery in demand.
Energy crisis concerns emerged in the market in September and October 2021, and oil prices rose further. In November, the Biden administration announced the release of 50 million barrels of U.S. strategic petroleum reserves (actual legal sales were 18 million barrels, and 32 million barrels were needed to return strategic petroleum reserves to help relevant refiners solve crude oil supply problems). Coupled with the rebound of the epidemic in Europe, suppressed oil prices.
*On March 20, 2003, a joint force composed mainly of British and American troops attackedIraqactivatedMilitary action,USAIraq harbors weapons of mass destruction and secretly supports themterroristto carry out military strikes against Iraq. It took more than seven years until U.S. combat troops withdrew from Iraq in August 2010.
Referring to a revolutionary wave in the Arab world in 2010, people in Arab countries took to the streets to demand the overthrow of authoritarian regimes and the establishment of democratic systems, triggering civil wars in many countries.
The overall oil price will show an inverted V trend in 2022. The outbreak of the Russia-Ukraine conflict in the first half of the year and economic sanctions such as Western countries oil embargo on Russia drove oil prices to soar. The main contract of Brent oil rose to a maximum of US$137/barrel, breaking the 2008 financial crisis. highest price in history. In the second half of the year, the Federal Reserve continued to raise interest rates, expectations of economic recession increased, macroeconomic negative factors suppressed demand expectations, commodities fell in resonance, and crude oil prices fell.
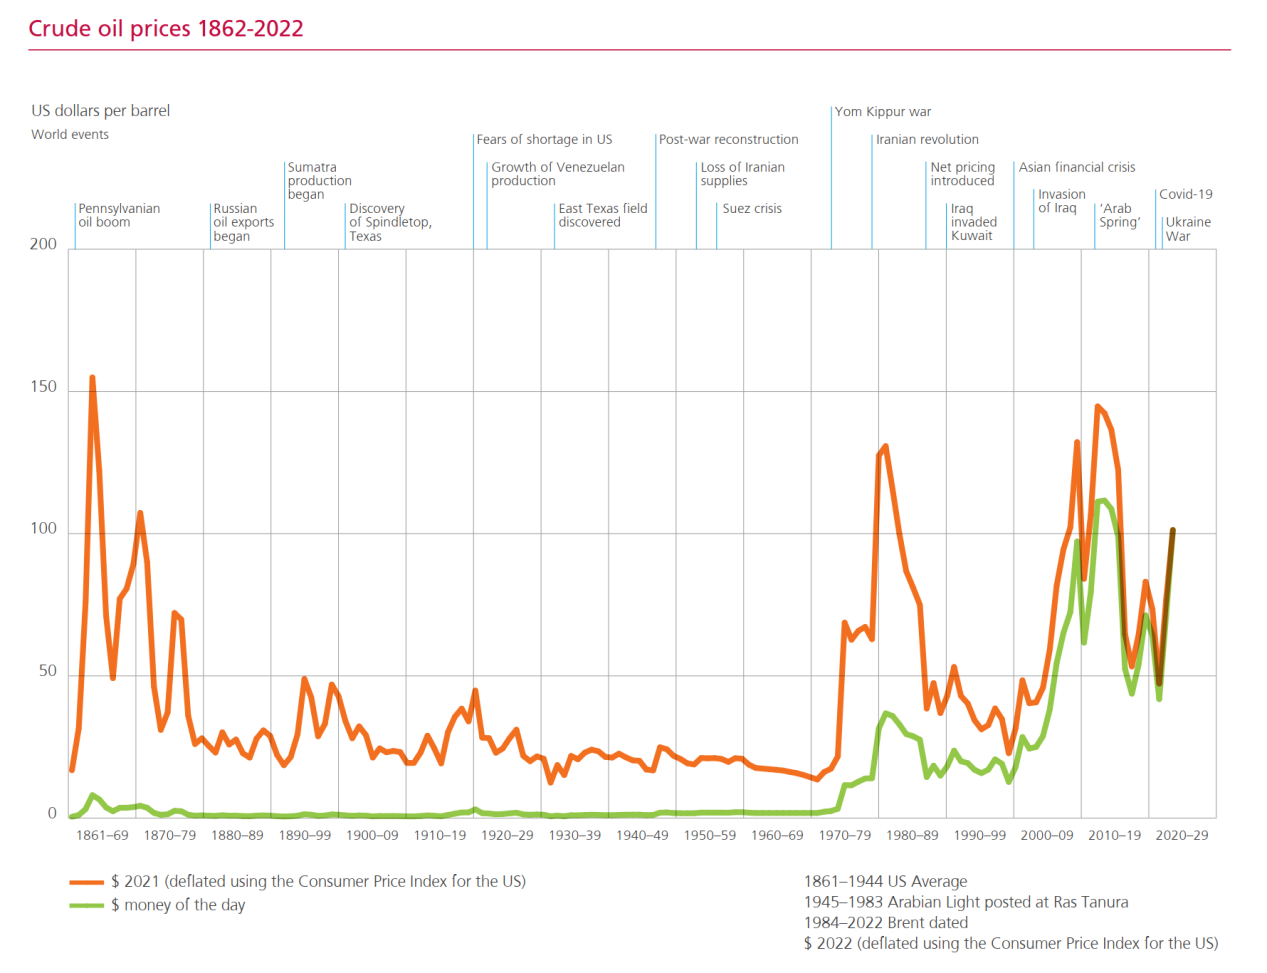
Source: World Energy Statistical Yearbook 2023
2. Overview of crude oil
1. Definition of crude oil
Unprocessed petroleum (petroleum) is called crude oil, which is a mixture of various liquid hydrocarbons such as alkanes, naphthenes, aromatic hydrocarbons and olefins. Crude oil can be refined and processed to obtain fuel, lubricants, asphalt, petroleum wax, petroleum coke, solvents and other chemical raw materials. Among them, fuel production is the largest, mainly including engine fuels such as gasoline, diesel and aviation kerosene, as well as lamp kerosene, fuel oil, etc.
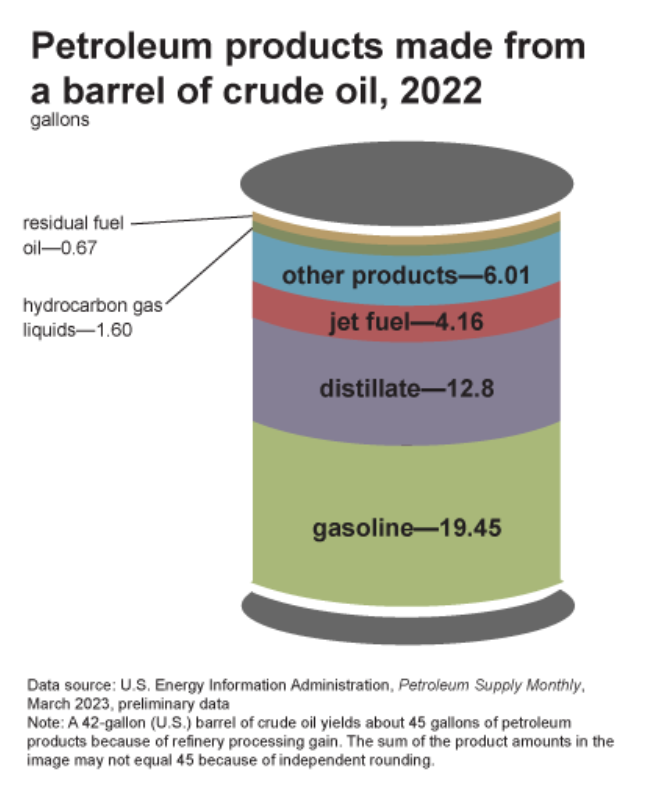
From a barrel of crude oil, U.S. refineries produce roughly 19.45 gallons of gasoline, 12.8 gallons of distillate (most of which is sold as diesel), 4.16 gallons of jet fuel, and others.
Source: EIA
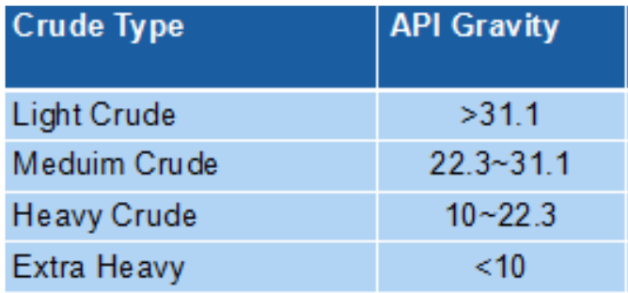
Crude oil can be divided into paraffin-based crude oil, naphthenic crude oil and intermediate-based crude oil according to different compositions; according to the sulfur content, it can be divided into ultra-low sulfur crude oil, low-sulfur crude oil, sulfur-containing crude oil and high-sulfur crude oil; according to the relative density, it can be divided into There are three categories: light crude oil, medium crude oil and heavy crude oil. API degree is a measure developed by the American Petroleum Institute to express the density of petroleum and petroleum products. API degree is internationally regarded as one of the main criteria for determining crude oil prices. Contrary to the usual concept of density, the larger the API degree value, the smaller the density.
Source: thepetrosolutions.com
2. Global energy consumption pattern
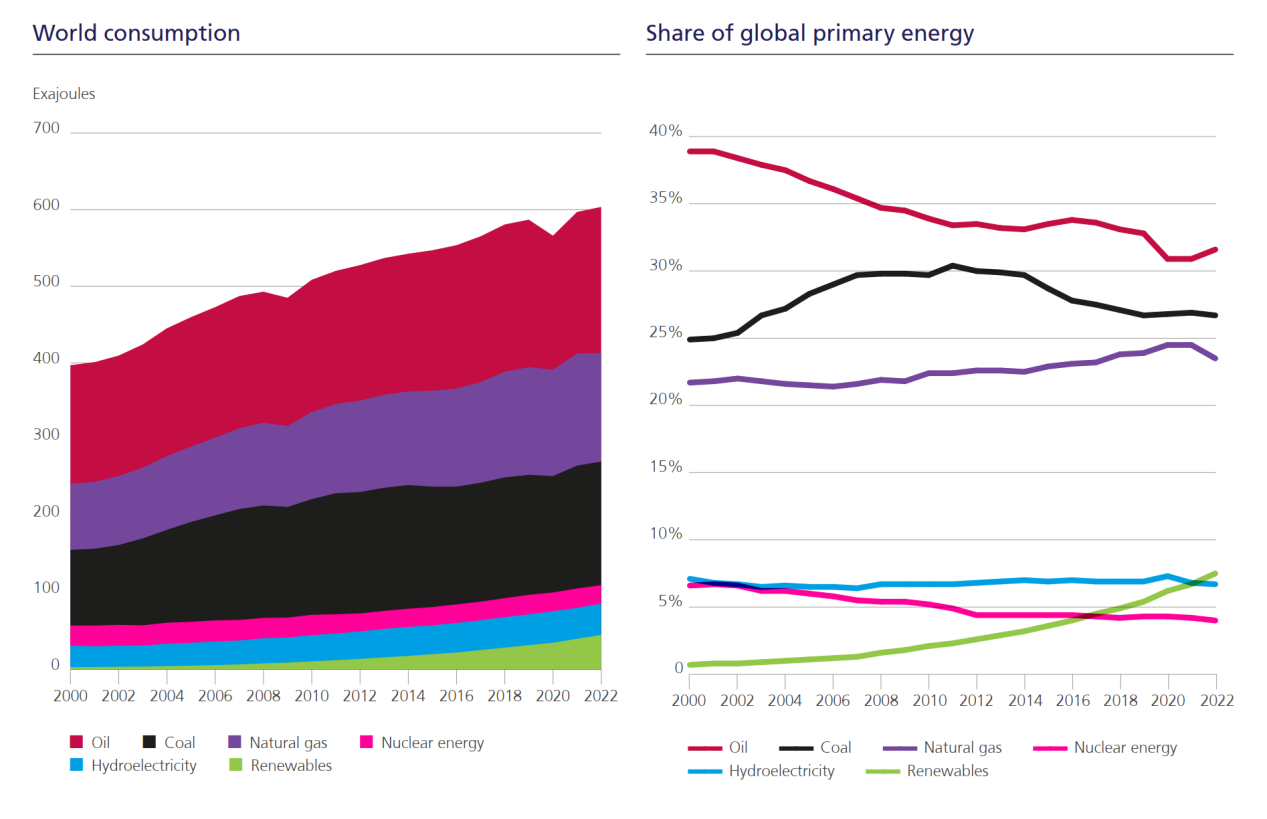
Global energy is mainly divided into two categories: fossil energy (such as oil, natural gas, coal) and renewable energy. According to the Statistical Review of World Energy, the proportion of oil in the entire energy consumption structure has been on a downward trend since 2000, from nearly 40% in the initial stage to more than 30%, while renewable energy and natural gas have been on an upward trend, in line with The general trend of global energy structure adjustment.
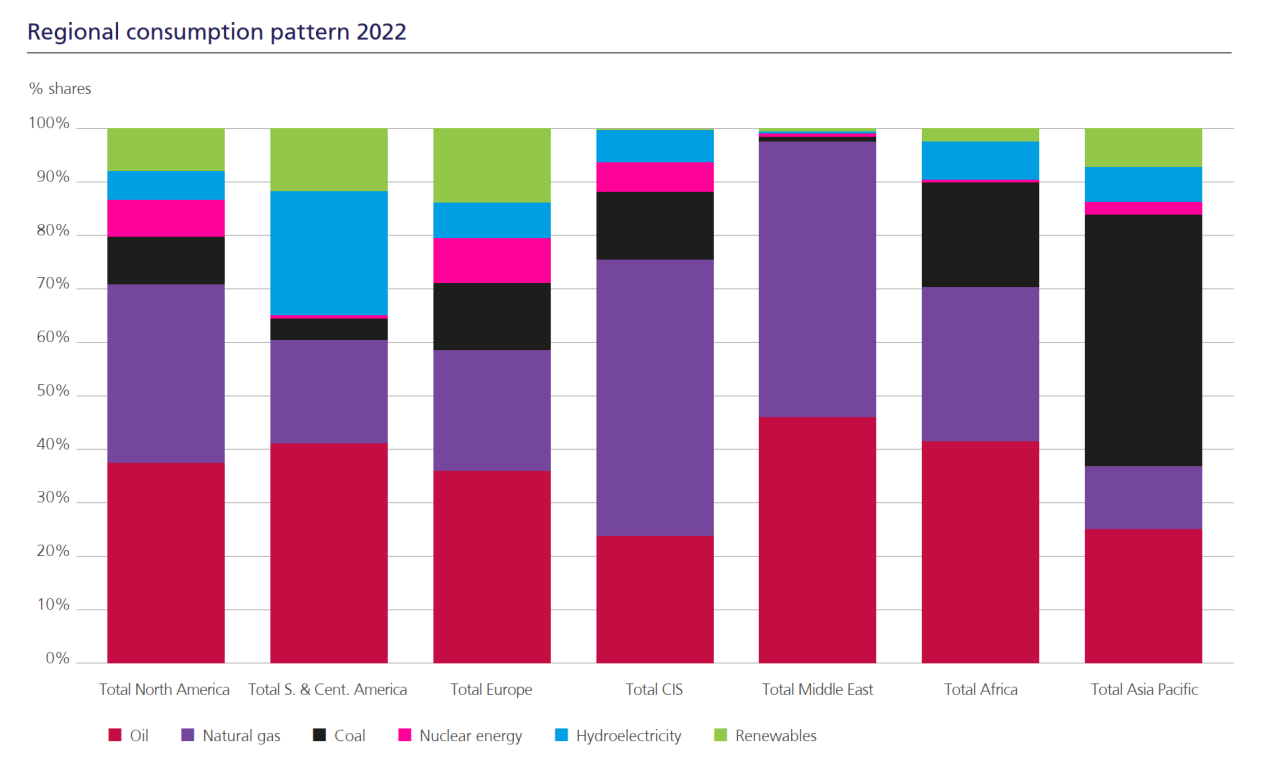
In terms of regions, the consumption of natural gas and oil in the Middle East accounts for nearly 100%; the consumption of natural gas and oil in North America accounts for about 70% of the total energy consumption; the consumption of natural gas and oil in Europe accounts for about 60% of the total energy consumption; Oil consumption in the Asia-Pacific region accounts for about a quarter of the overall consumption, coal demand accounts for the highest proportion, about 50% (black part), and natural gas consumption accounts for a smaller proportion.
3. Main indicators of international crude oil pricing
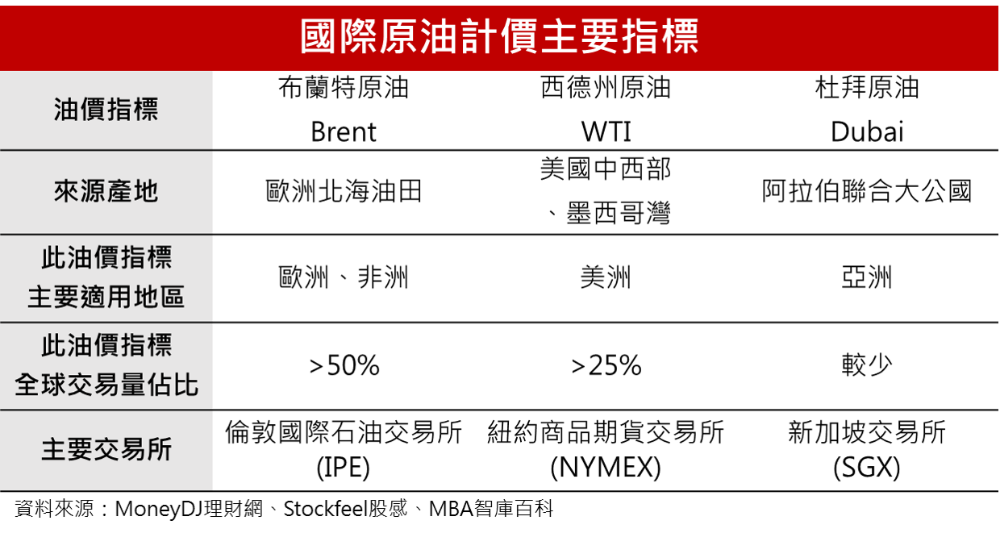
Oil is usually priced differently due to differences in extraction costs, output quality, etc. In order to facilitate transactions, several benchmark prices have been formed for crude oil transactions in the international market. Crude oil is usually measured in dollars per barrel, with a barrel being 42 gallons, or about 159 liters.
The light sweet crude oil of the New York Mercantile Exchange is of better quality and is also known as West Texas Intermediate Oil or Texas Light Sweet Oil. It is the benchmark price of crude oil in North America; the North Sea crude oil of the London International Petroleum Exchange Lrent crude oil is also a light oil, with lower quality than the New York Mercantile Exchange light sweet crude oil; Dubai crude oil is a light sour crude oil produced in Dubai, United Arab Emirates, and is less widely used than the former two.
3. Oil supply and demand relationship
1. Supply
(1) Proven reserves
Source: OPEC
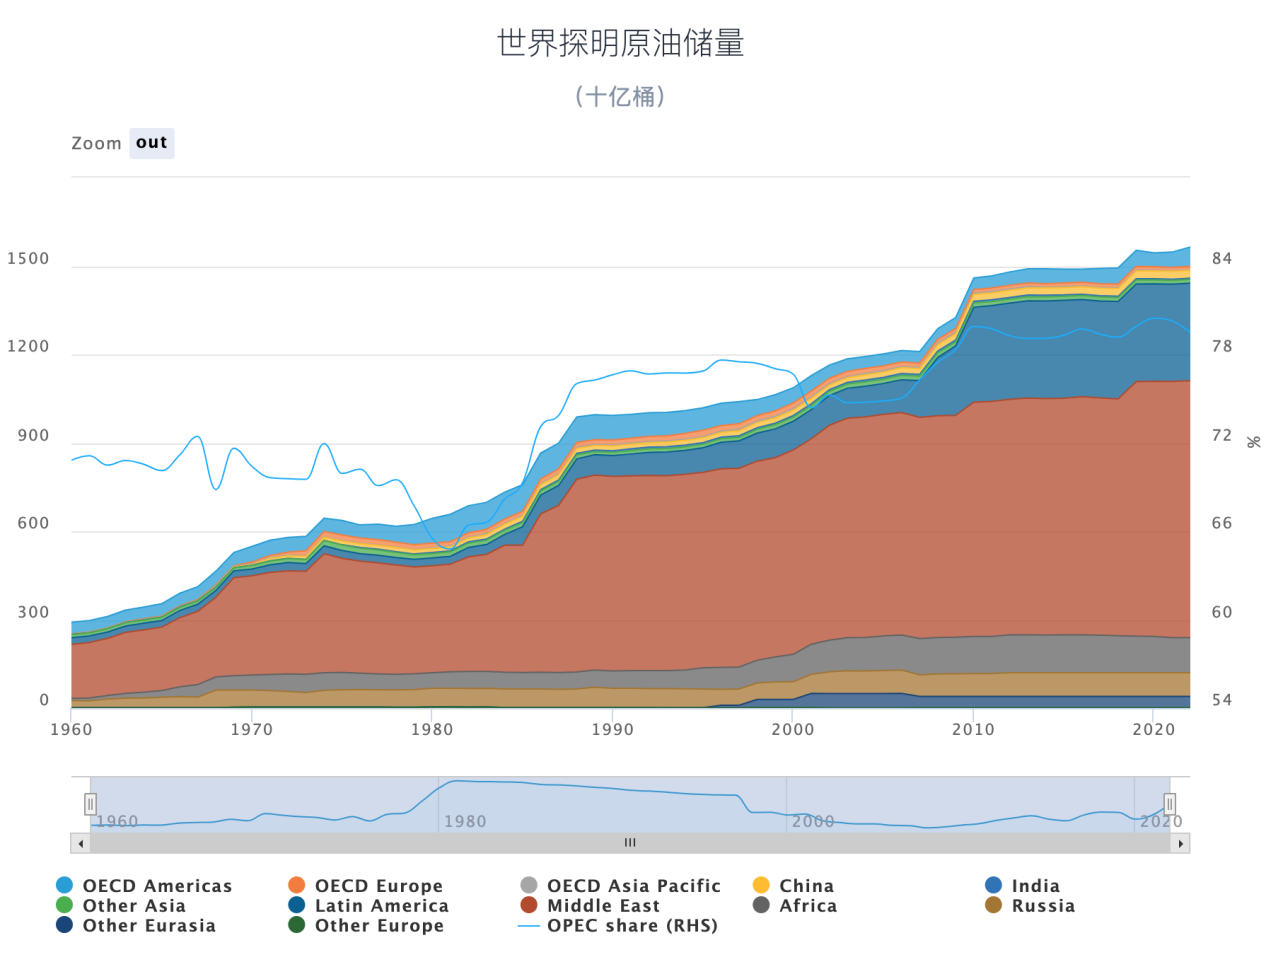
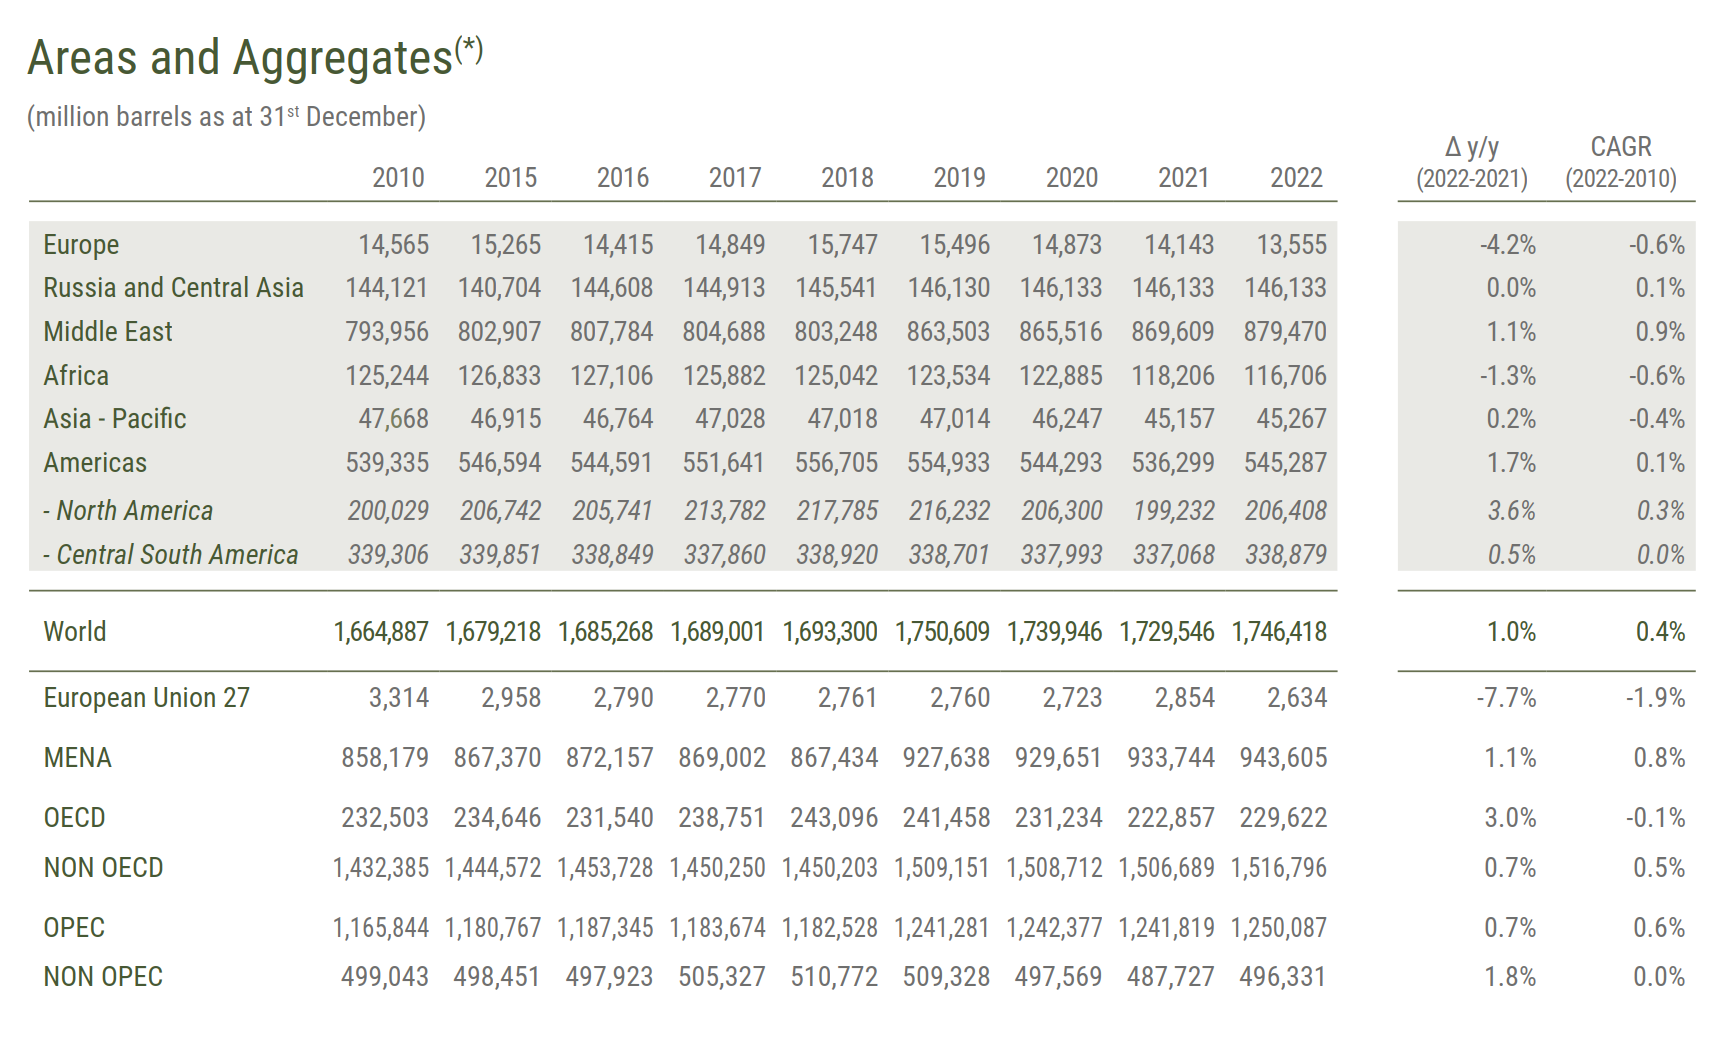
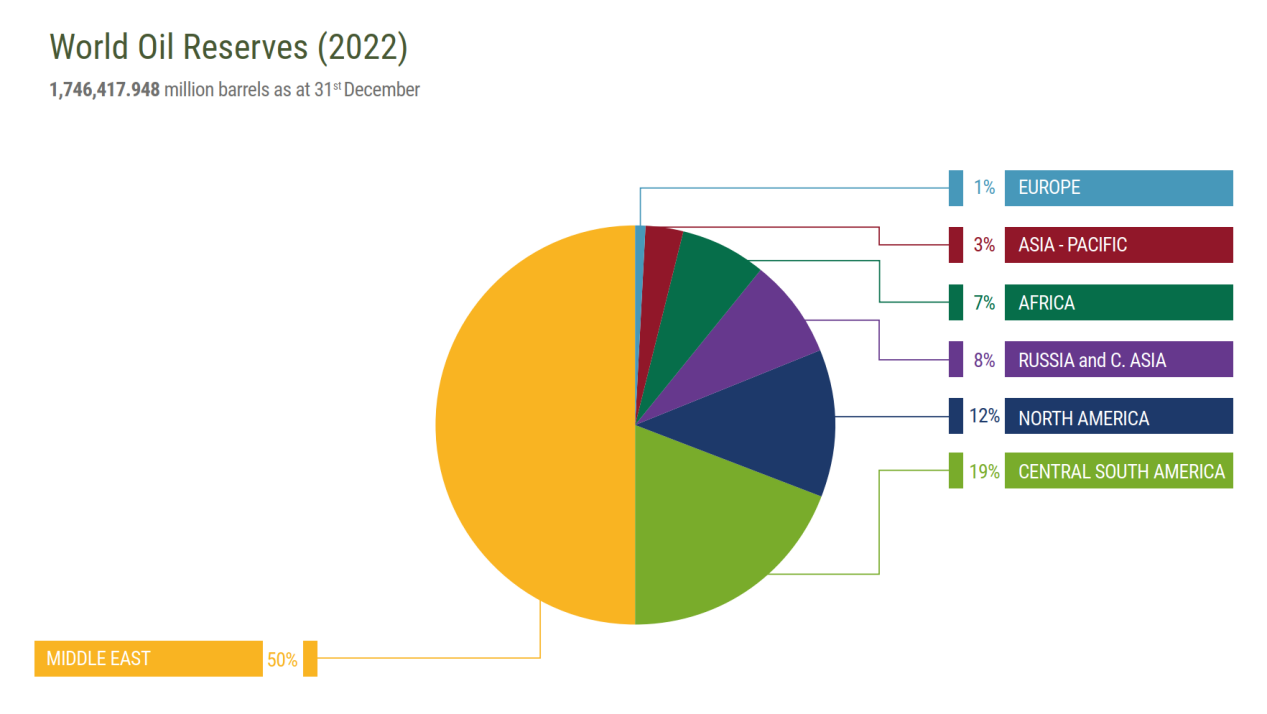
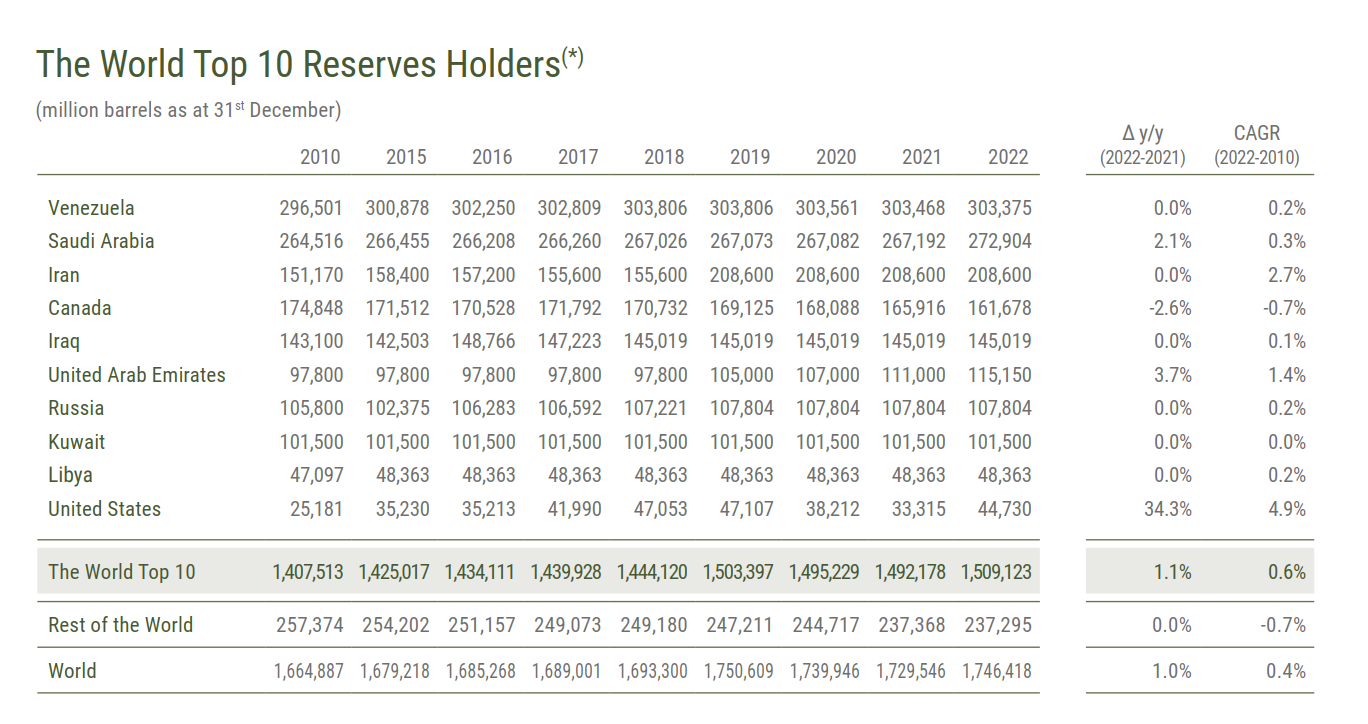
The worlds proven crude oil reserves are increasing year by year. As of the end of 2022, global proven crude oil reserves reached 1.74 trillion barrels, with an annual growth rate of 1%. In terms of regions, the largest proportion is about 50% in the Middle East countries, with a total volume of 87.95 billion barrels, and the smallest proportion is about 1% in Europe, with a total volume of 13.56 billion barrels. OPEC has more than 70% of the worlds proven oil reserves, and its production and price policies have a significant impact on world oil supply and prices. Looking at countries, the three countries with the richest crude oil reserves in the world are Venezuela, Saudi Arabia and Iran, with reserves respectively. They were 303.3 billion barrels, 272.9 billion barrels and 208.6 billion barrels, accounting for 17.4%, 15.6% and 11.9% of global crude oil reserves respectively.
Proven crude oil reserves in various regions and some countries around the world
Source: eni world oild review
(2) Reserve-to-production ratio
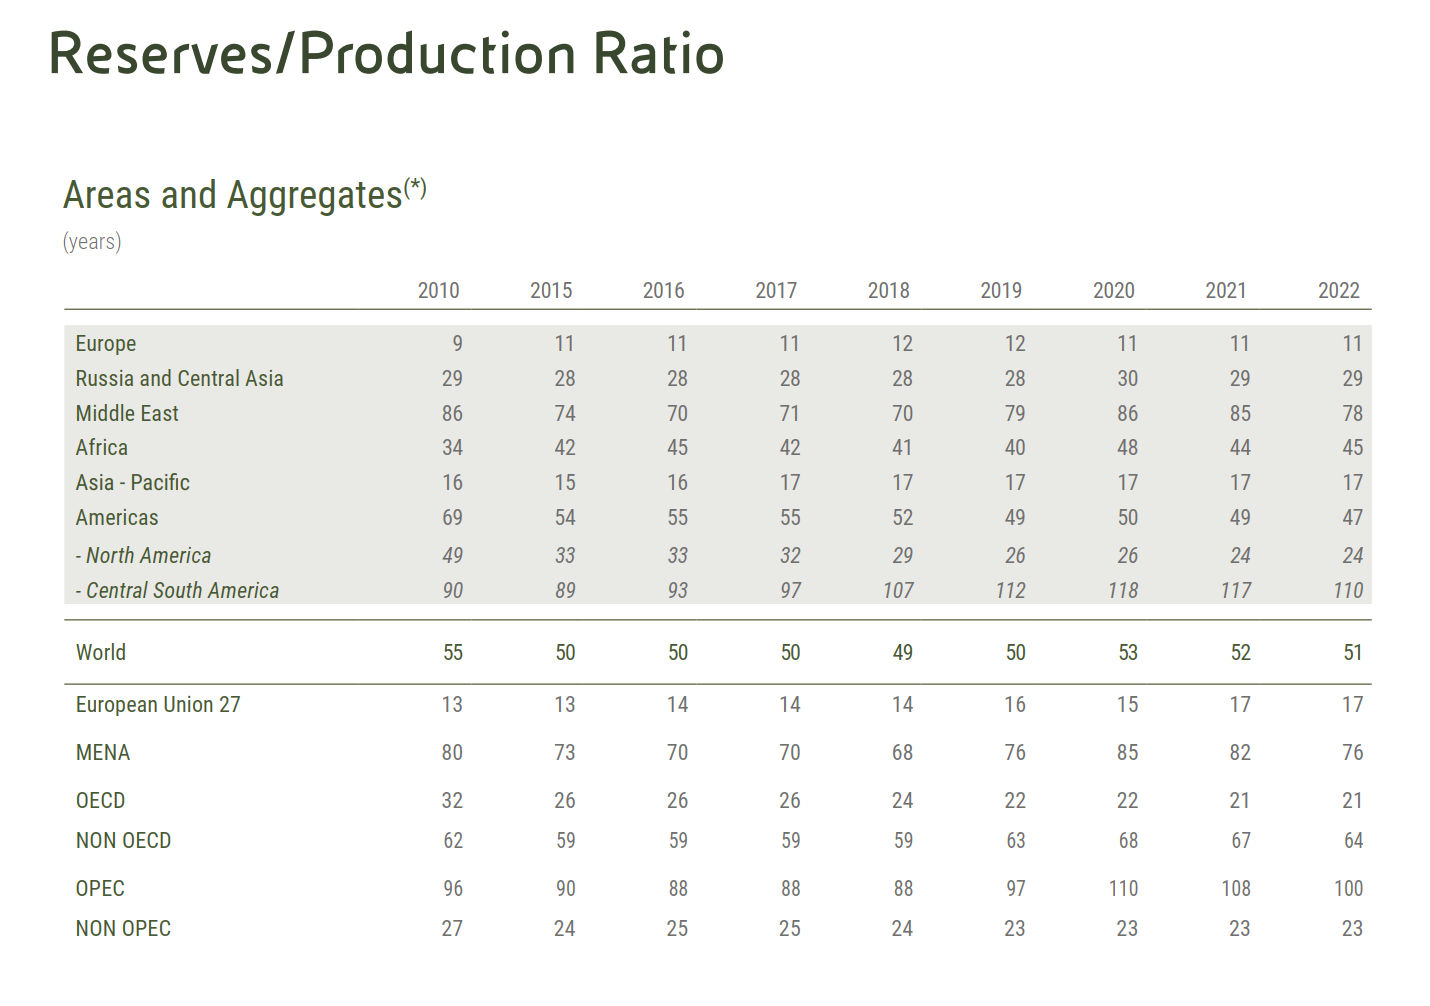
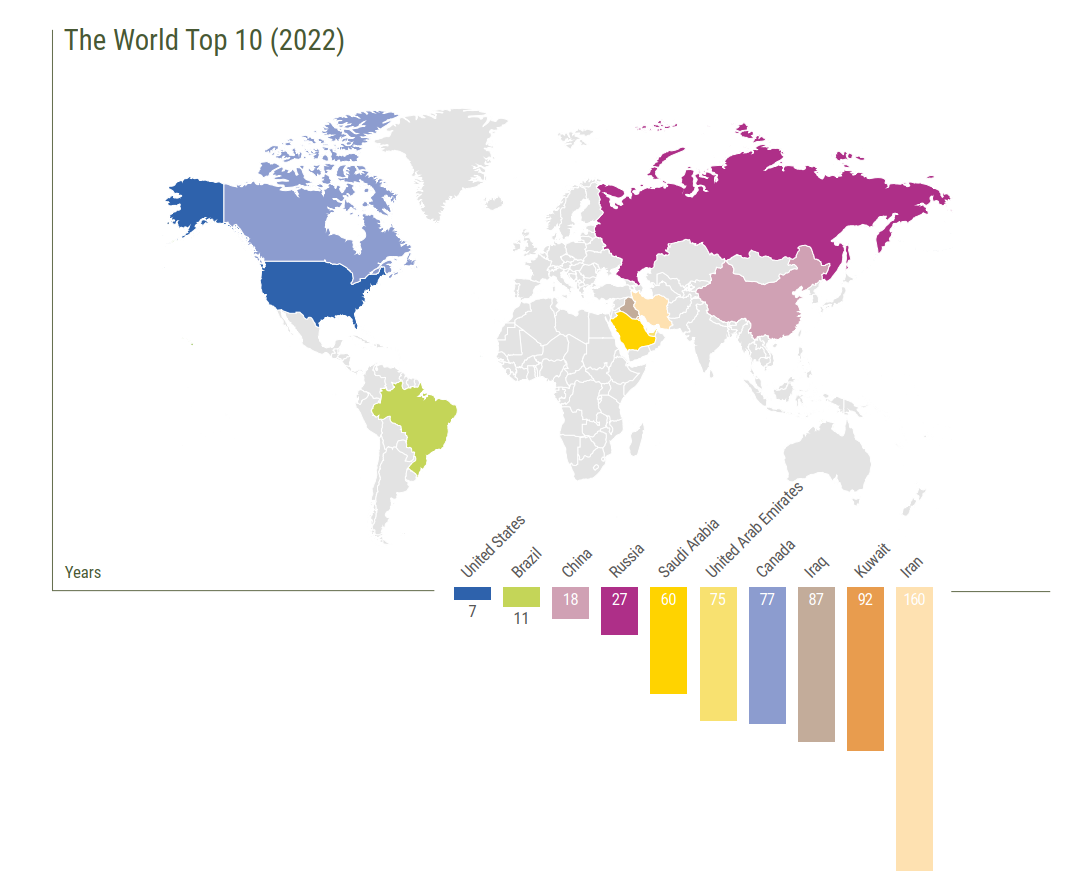
Reserves-to-production ratio = reserves/production, which represents the ratio of proven reserves to production in that year. It represents how many years it will take to complete oil extraction under the condition that proven reserves and production remain unchanged. Since proven reserves and production volumes will change over time, the reserve-to-production ratio is not fixed. In the past few years, the global reserve-to-production ratio has been basically stable at around 50 years, and the global reserve-to-production ratio in 2022 will be 51 years. In terms of regions, the reserve-production ratio in Central and South America is as high as 110 years, in North America it is 24 years, in Europe it is only 11 years, and in OPEC it is 100 years. In terms of countries, the reserve-production ratio is the highest. Iran has 160 years, followed by Kuwait, Iran and Canada, with 160, 92 and 87 years respectively. The production ratios of China and the United States are 18 and 7 years respectively.
Crude oil reserve and production ratios in various regions and some countries around the world
Source: eni world oild review
(3)Output
Source: OPEC
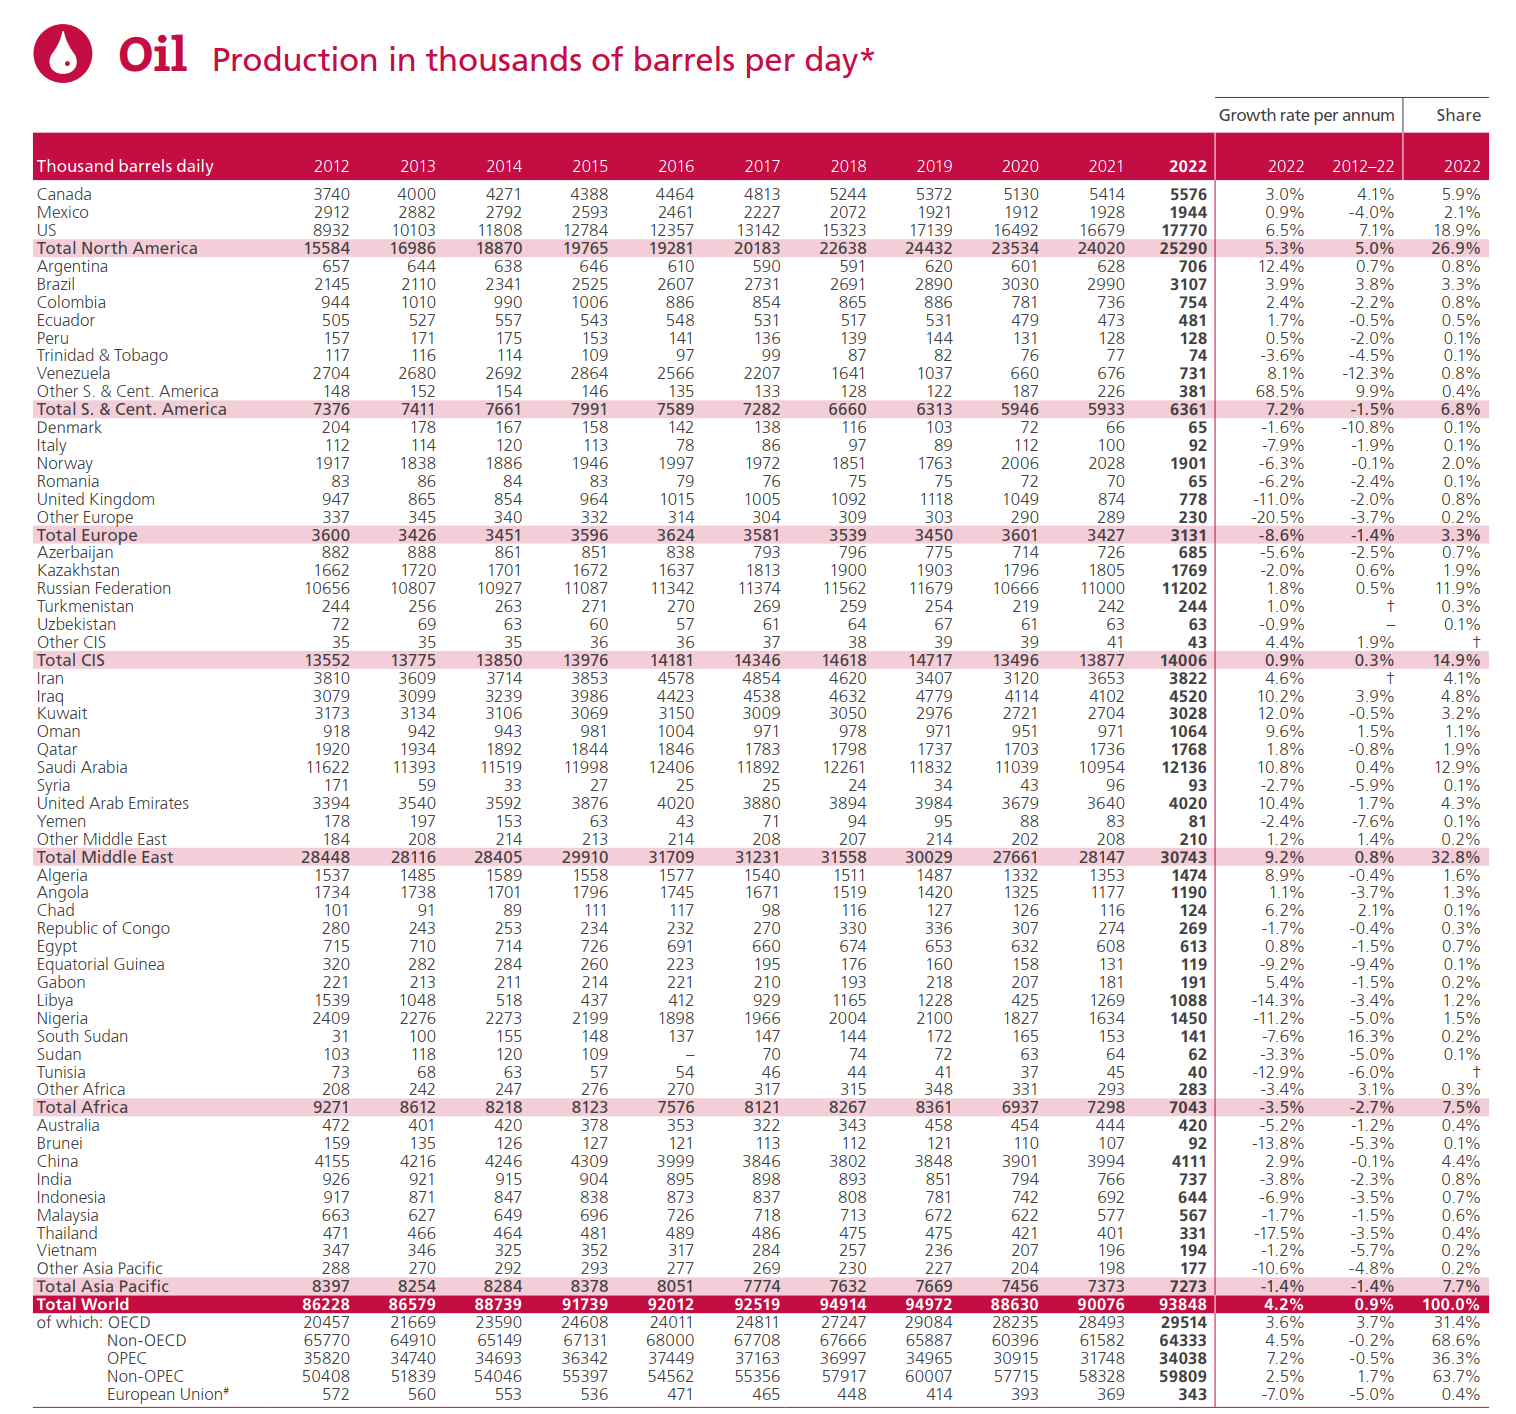
According to the World Energy Statistical Yearbook 2023, global oil production in 2022 is 93.848 million barrels/day, with a total annual volume of 4.407 billion tons. Among them, the top three United States produces 17.770 million barrels/day, with a total annual volume of 760 million tons, Saudi Arabia Arabia has 12.136 million barrels per day, with an annual total of 573 million tons, and Russia has 11.202 million barrels per day, with an annual total of 546 million tons. These three countries will account for 42.68% of world oil production in 2022. OPEC members accounted for 36.4% of global oil supply in 2022. Among European countries (excluding Russia), only Norway has a slightly larger output, with an annual output of 89 million tons in 2022, accounting for 2% of global production. China, with a daily output of 4.111 million barrels per day in 2022 and a total annual output of 204 million tons, is the worlds sixth largest oil producer.
Source: Statistical Review of World Energy
Note: The above data include crude oil, shale oil, oil sands, condensate (associated gas condensate or condensate that needs further refining) and natural gas condensate (ethane separated from natural gas products, liquefied petroleum gas and naphtha).
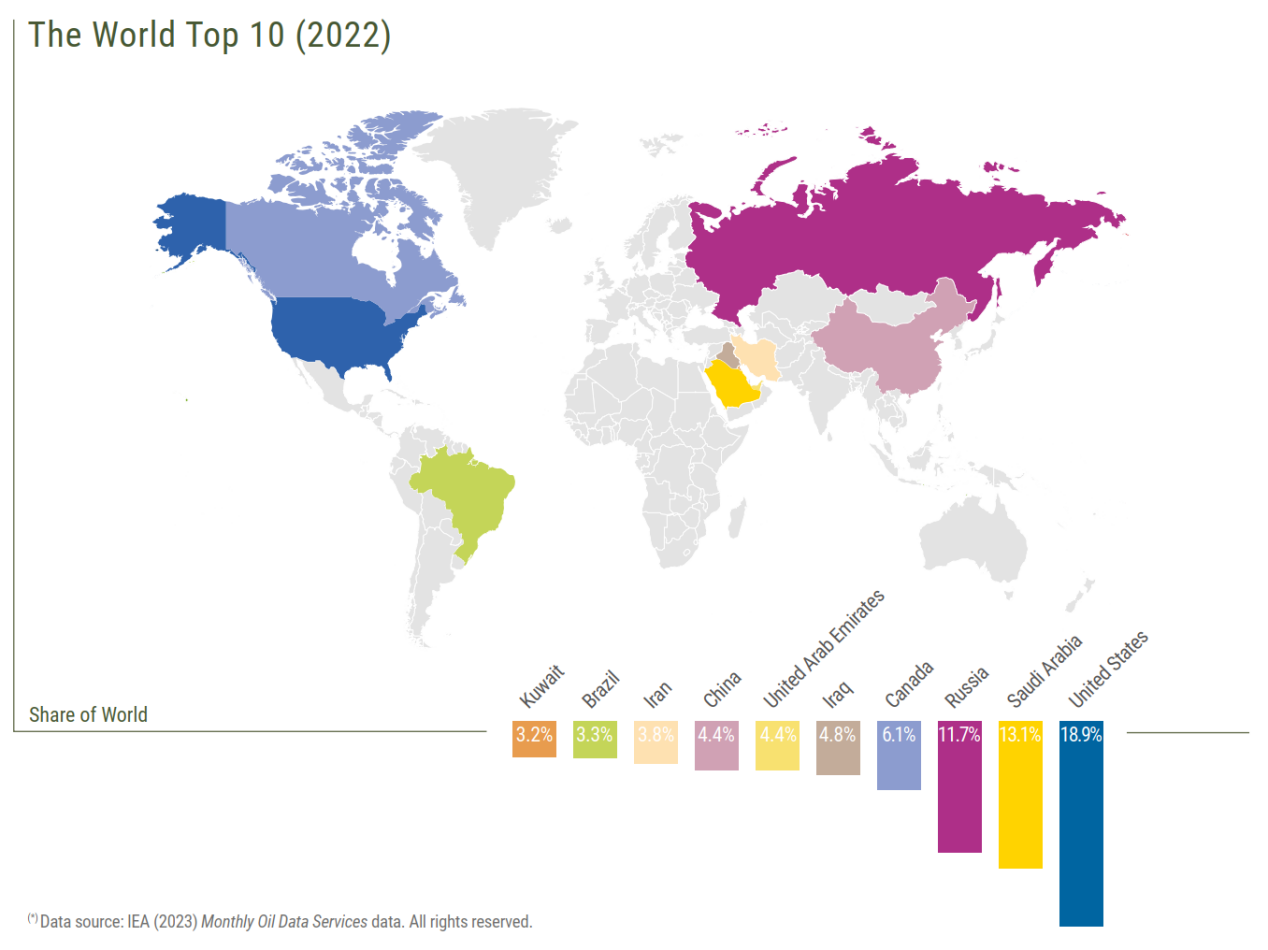
Source: eni world oild review
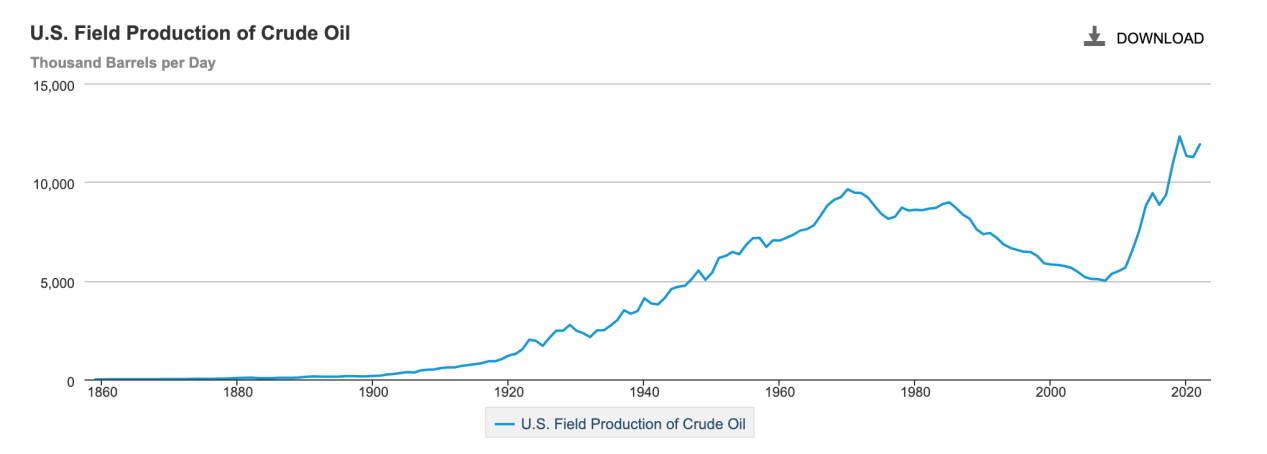
Through the shale revolution, U.S. crude oil production has surpassed Saudi Arabia and Russia since 2014, becoming the worlds largest crude oil producer. In 2018, the United States became an energy exporter from being the worlds largest energy importer. According to EIA data, the United States currently remains a net importer of crude oil (brown), a net exporter of petroleum products (green), and combined (blue) will remain a net exporter since 2022.
U.S. historical crude oil production
*EIA Official Definition: Petroleum products are obtained from the processing of crude oil (including lease condensate), natural gas, and other hydrocarbons. Petroleum products include unfinished oil, liquefied petroleum gas, pentane plus, aviation gasoline, automotive gasoline, naphtha-based aviation fuel, kerosene-based aviation fuel, kerosene, distillate fuel oil, residual fuel oil, petrochemical raw materials, special petroleum Brain oils, lubricants, waxes, petroleum coke, bitumen, road oils, distillates and other products.
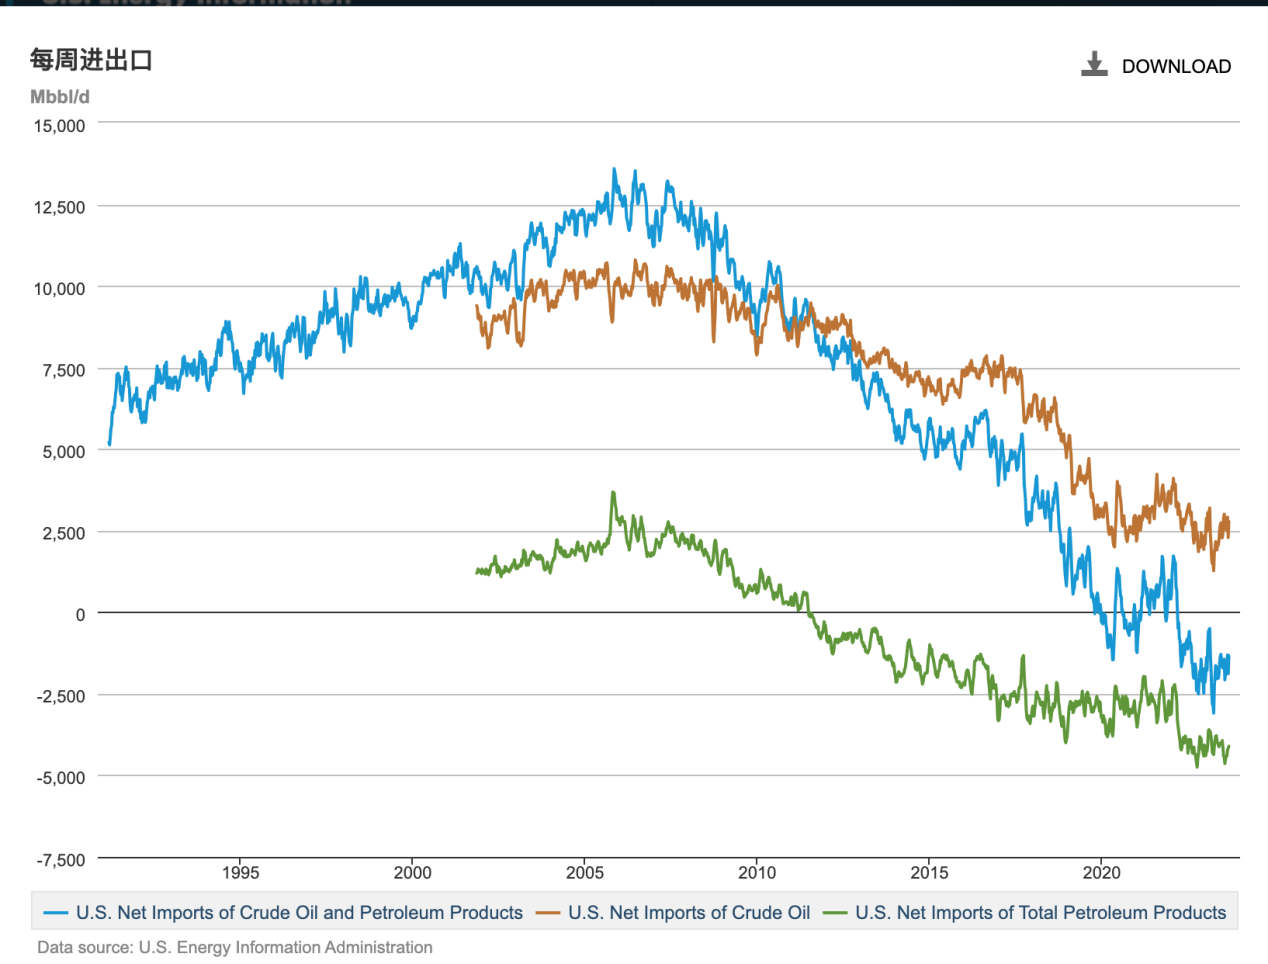
Source: EIA
(4) Refinery capacity
The refinery produces diesel, gasoline, kerosene, lubricating oil, petroleum coke, asphalt, ethylene and other products through distillation, catalysis, cracking, cracking, hydrorefining and other processes. The Nelson Complexity Index (NCI) is an important indicator in the petrochemical industry to measure the complexity of refinery units. The higher the Nelson Complexity Index, the more competitive the refinery is. In 2022, North America has the highest NCI value of 11.7, Africa has the lowest NCI value of 6.3, Europe has the NCI of 9.4, and Asia has the NCI of 8.2. North American refineries, especially those in the U.S. Gulf Coast region, generally have a high NCI range, with a median around 10, making it the most complex refining center in the world.
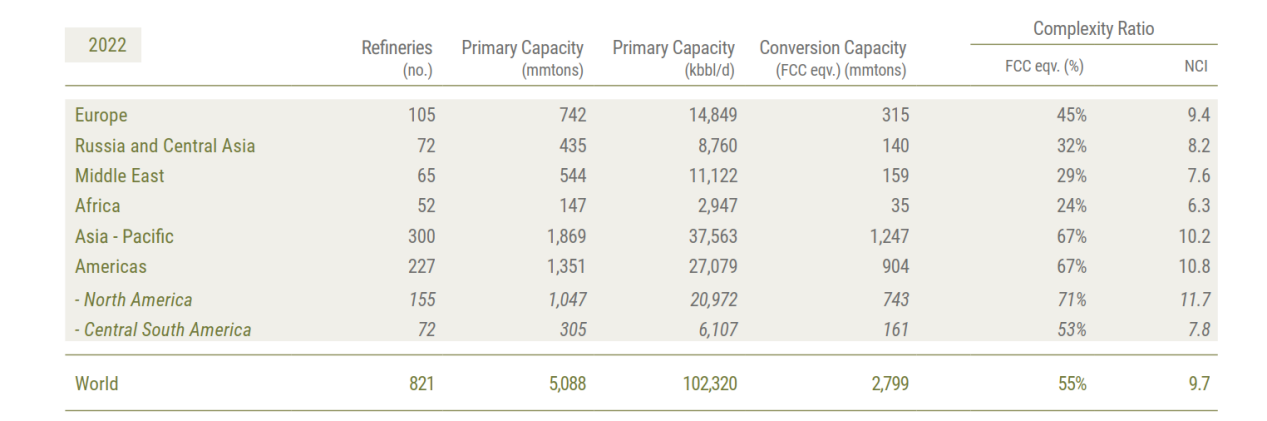
Source: eni world oild review
From a numerical point of view, the global production capacity reaches 100 million barrels/day. The United States has the highest refinery capacity of 18.06 million barrels/day, accounting for 18% of the world’s total production capacity, followed by China with 17.26 million barrels/day. Crude oil production The production capacity of Saudi Arabias refinery, ranked second in the world, is 3.312 million barrels per day.
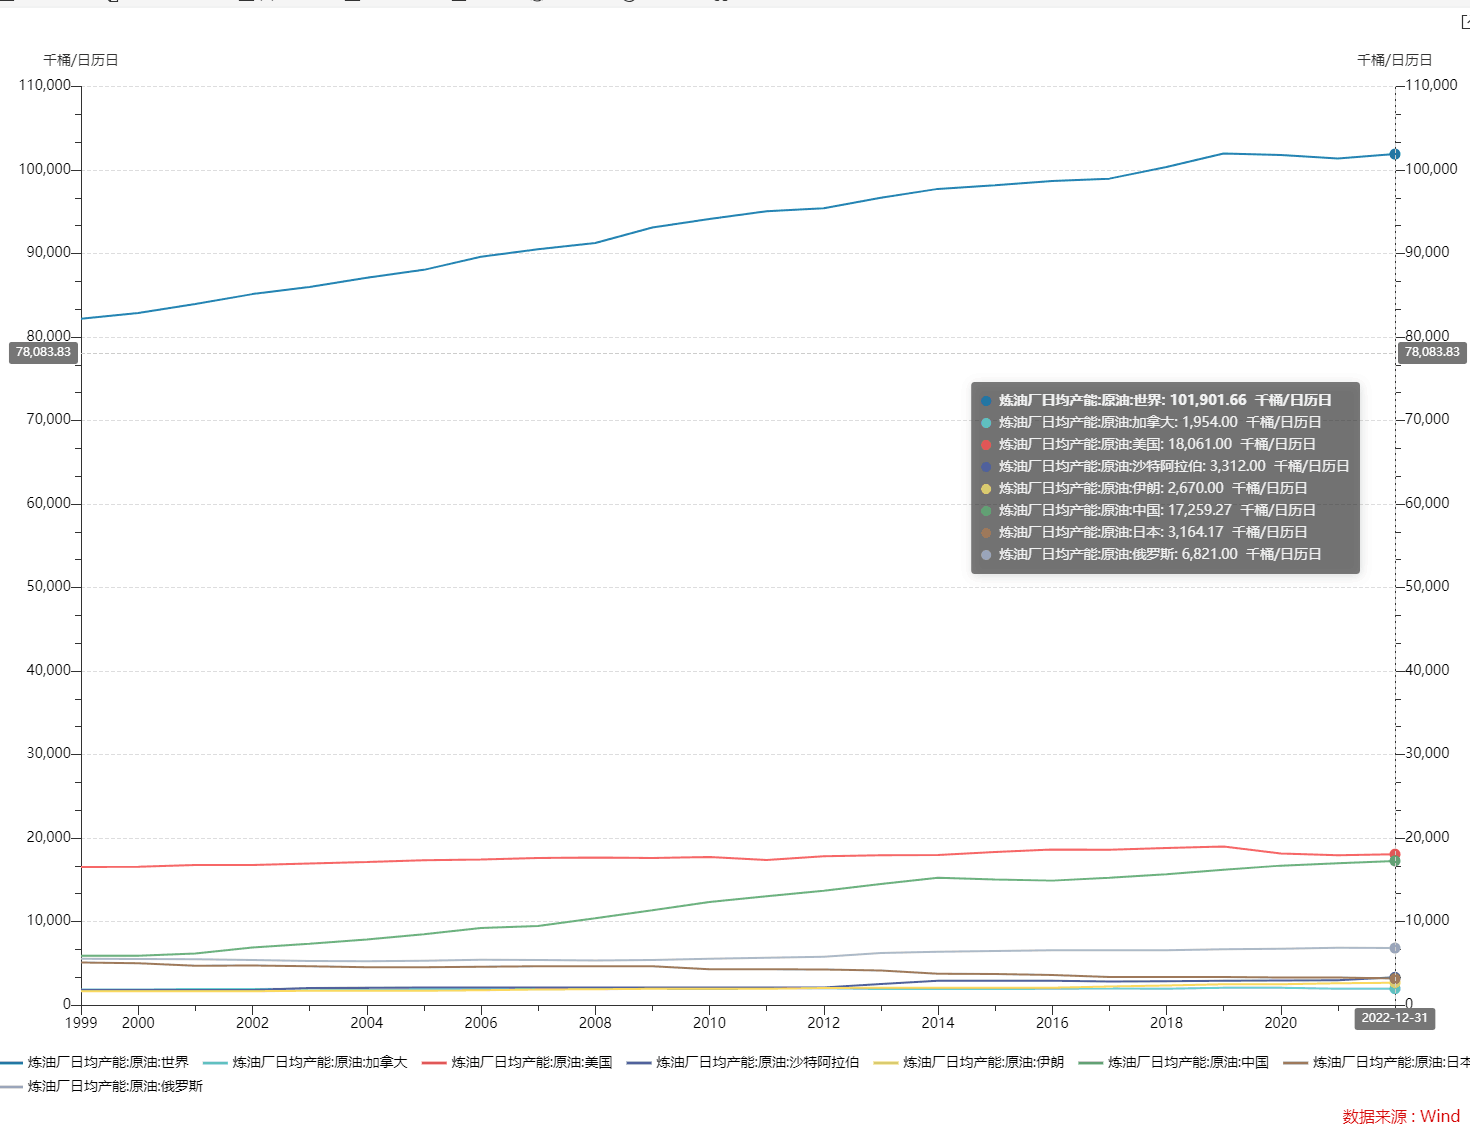
(5) Oil production costs in different countries
There are obvious regional differences in global crude oil production costs. In addition to production costs, there are also transportation costs, taxes and fees. From the following table, we can find that based on the cost of a barrel of oil, the countries with the lowest crude oil production costs are Iran and Iraq, which are less than 3 USD/barrel, and in terms of total cost, Saudi Arabia’s cost is the most advantageous, only USD 3.
Cost of oil production by country (2016 data)
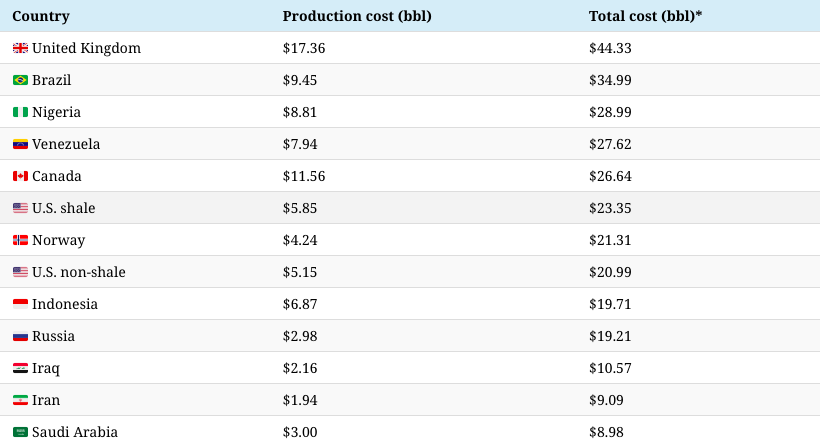
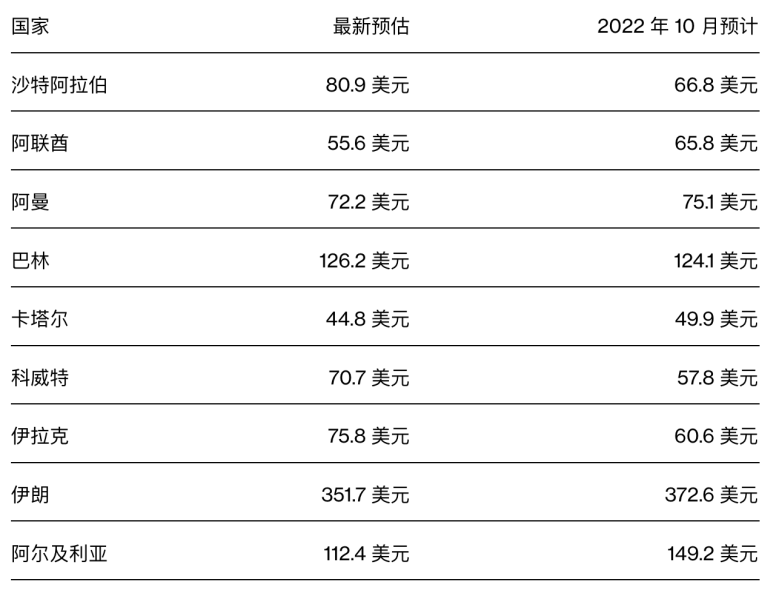
Although the complete cost of a barrel of oil in Middle Eastern countries is relatively low, since the government lacks other sources of fiscal revenue, it still needs to be considered from the perspective of fiscal balance of oil prices. Fiscal breakeven oil price refers to the crude oil price at which the governments of oil-producing countries, with oil as a pillar industry and highly dependent on oil revenue, can achieve a balanced fiscal budget. If the international oil price is higher than the fiscal balance oil price, the countrys government may have a fiscal surplus; when the international oil price is lower than the fiscal balance oil price, the countrys government may have a fiscal deficit.
IMFs estimate of crude oil fiscal equilibrium price for oil prices in Gulf region countries
2. Demand
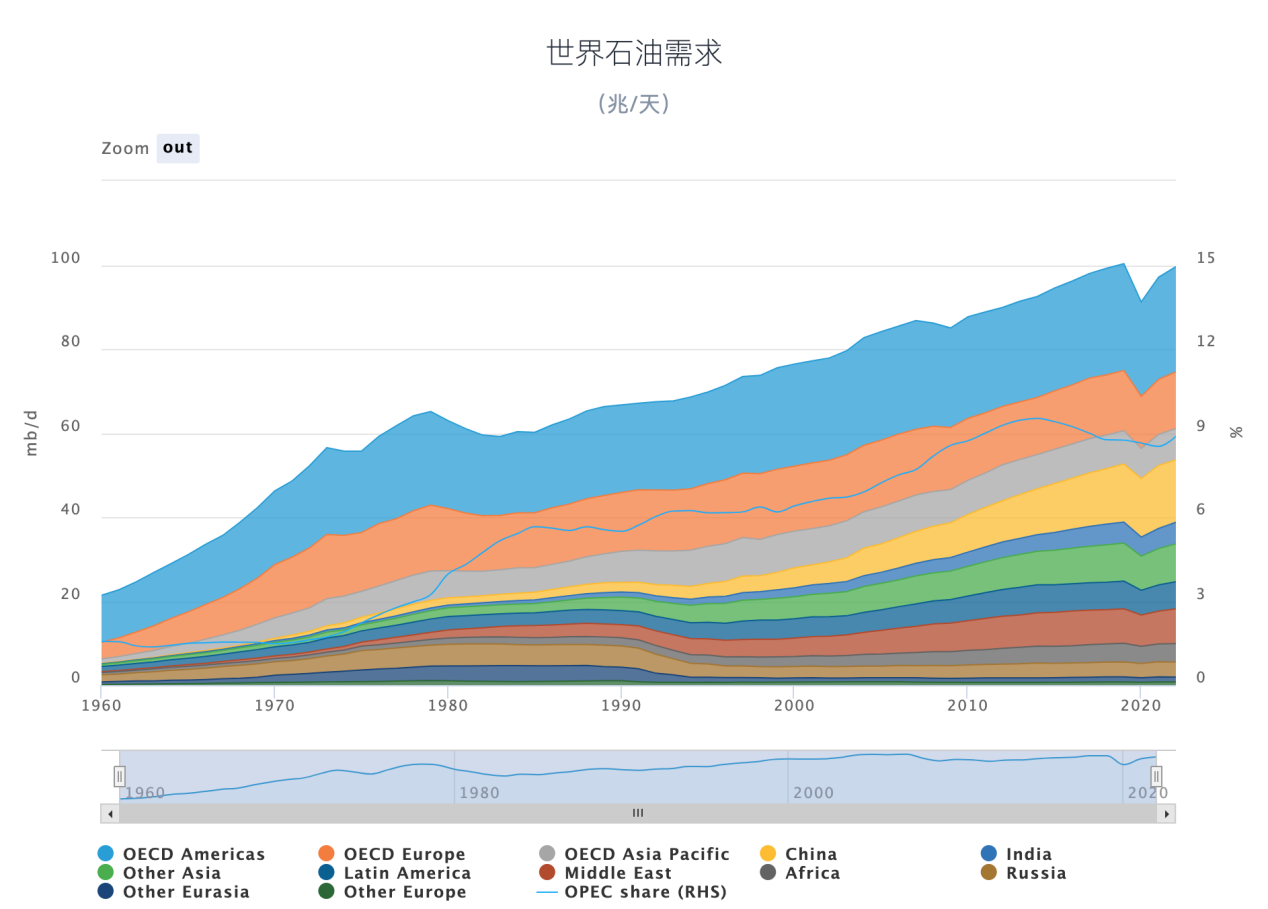
Source: OPEC
Oil is a relatively rigid demand, and global oil consumption growth has a positive correlation with economic growth. To a certain extent, the growth rate of the GDP of consuming countries can be used to predict the growth of their demand for crude oil. Different countries and regions have different growth rates of crude oil consumption, and developing countries have higher oil consumption per unit of economic activity. According to a study by Harvard University, every 1,000 US dollars in global GDP growth requires the consumption of approximately 0.4 barrels of oil (oil intensity). This value was once as high as 1 barrel per 1,000 US dollars in the 1970s. The dependence of GDP on oil has increased over time. It is constantly decreasing, but currently oil is still an important dependence on economic development.
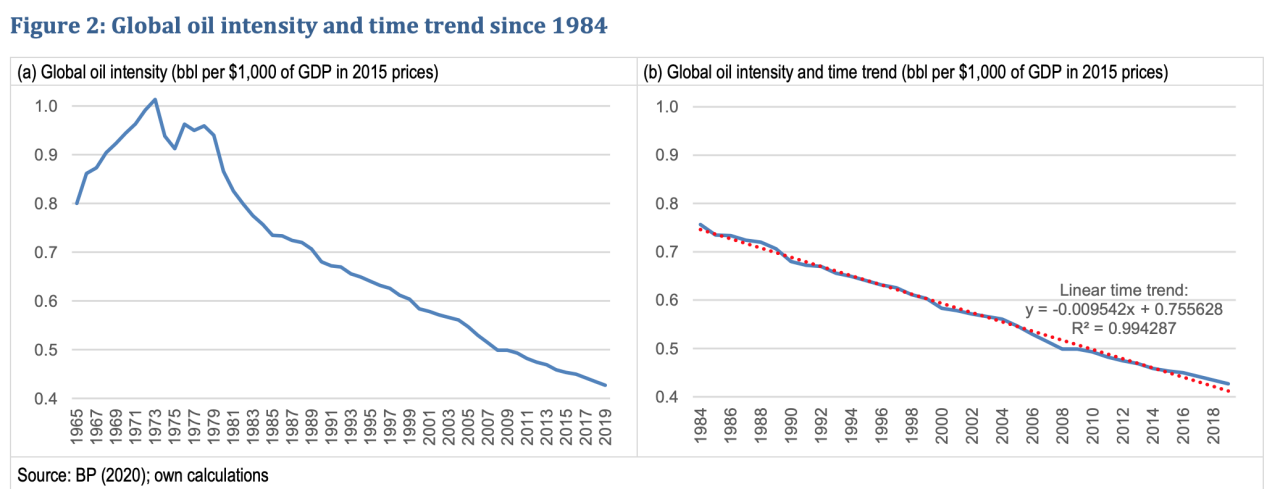
《Oil Intensity: The curious relationship between oil and GDP》
According to the World Energy Statistical Yearbook 2023, global oil consumption in 2022 is 97.309 million barrels/day, of which the top three are the United States with 19.14 million barrels/day, mainland China with 14.295 million barrels/day, and India with 5.185 million barrels/day. These three This country will account for 35.8% of world oil consumption in 2022. Europe as a whole consumes 14.06 million barrels per day, close to China’s levels.
Crude oil consumption (unit: thousand barrels per day)
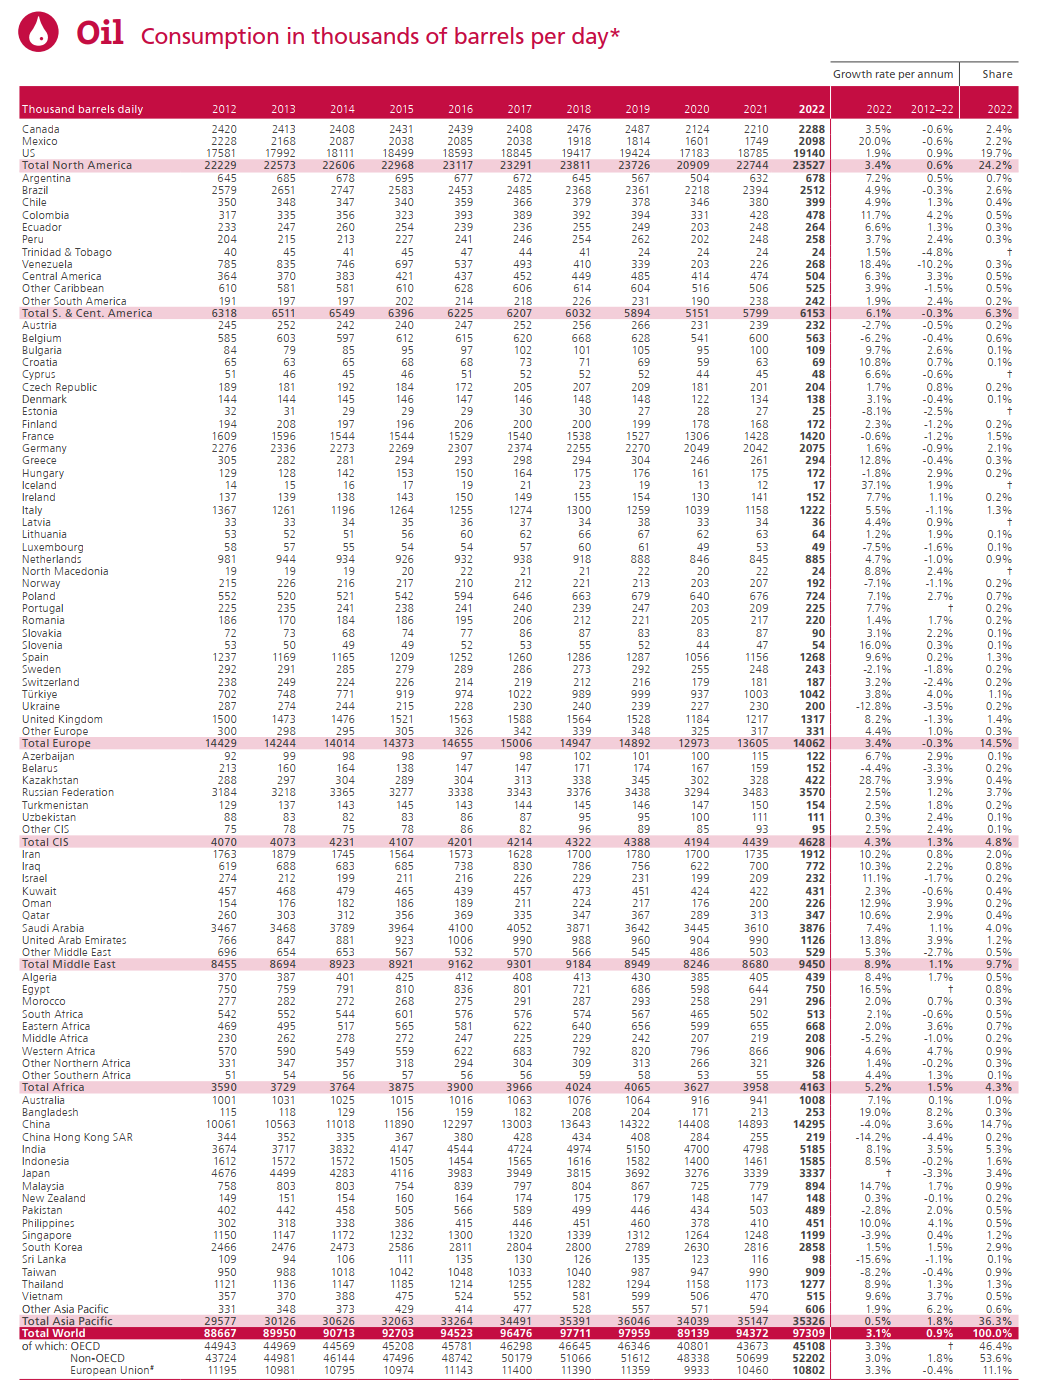
Source: Statistical Review of World Energy
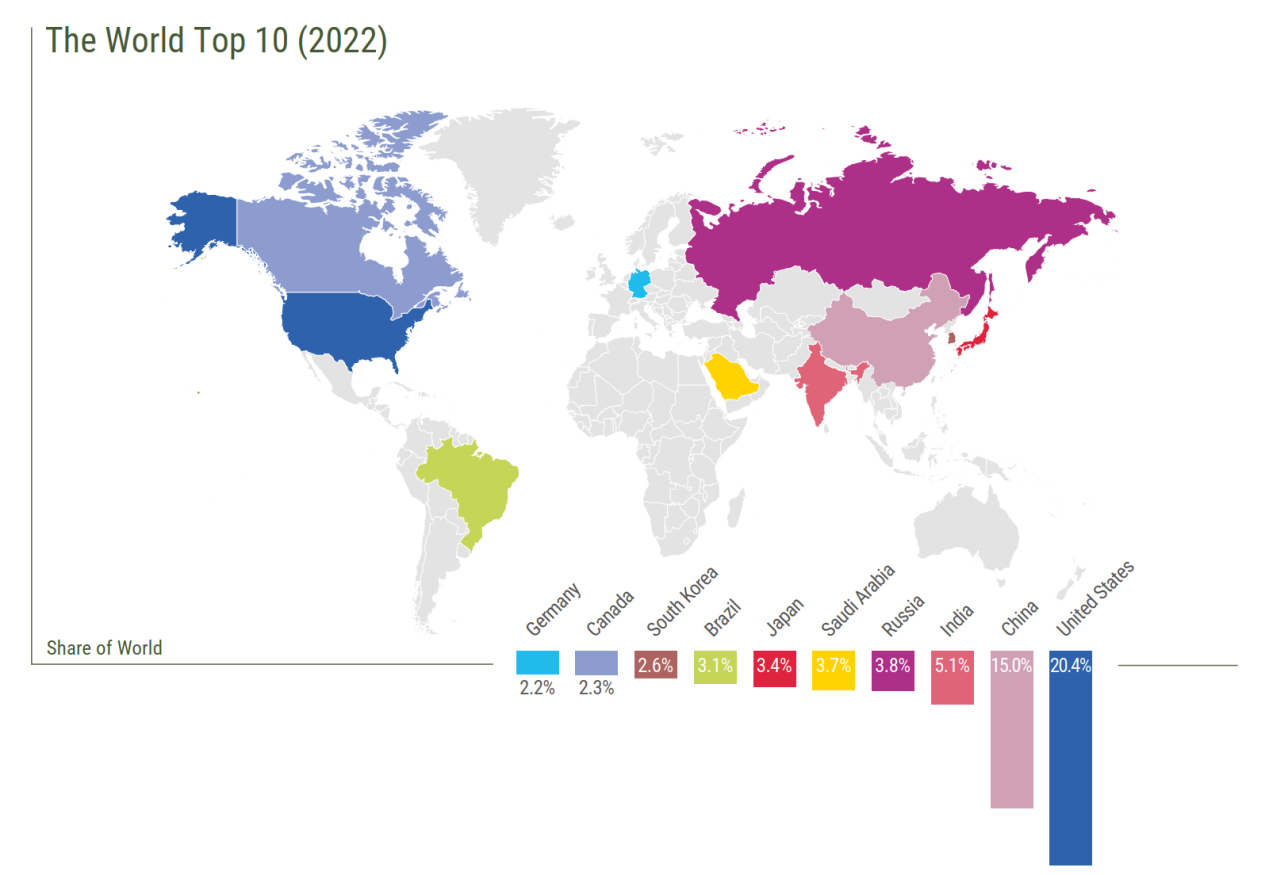
Source: eni world oild review
3. Inventory
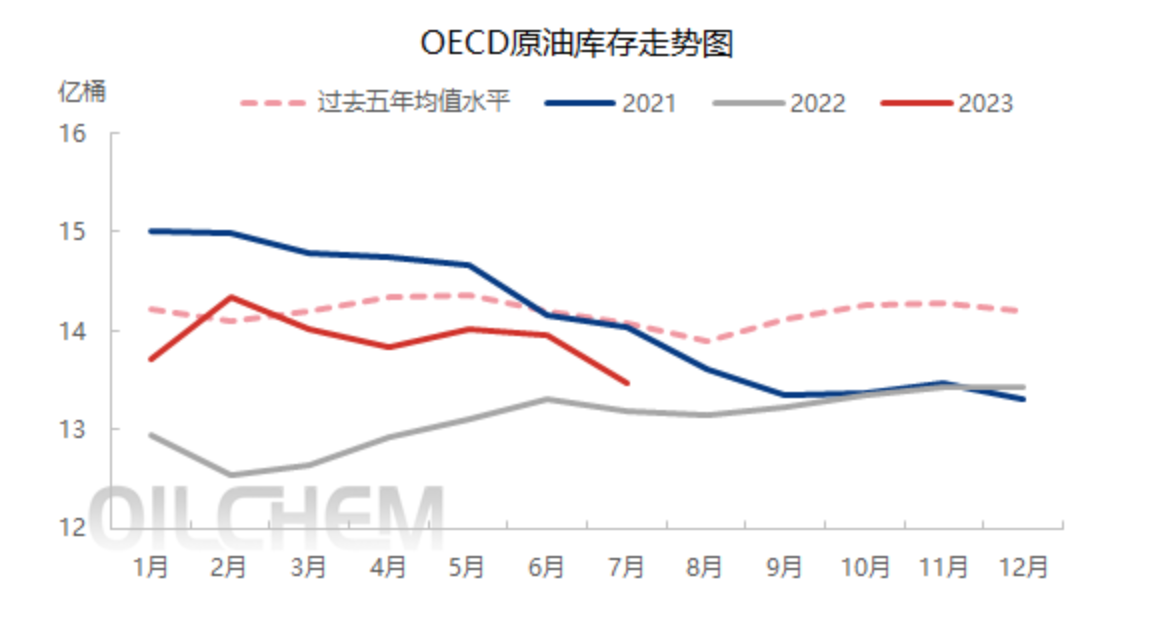
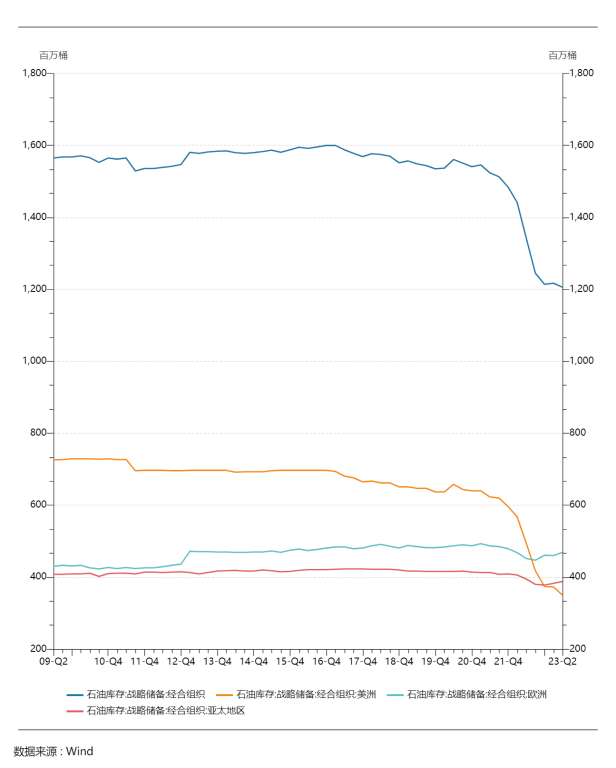
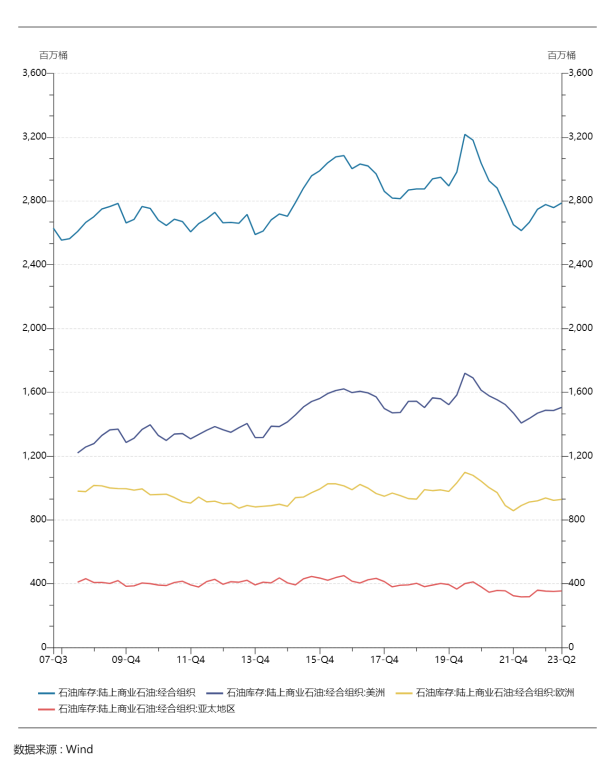
The difference between supply and demand creates inventory. Inventories are very important for crude oil price discovery. In theory, crude oil and refined oil inventories are negatively related to crude oil prices. Petroleum inventories are divided into strategic reserves and commercial inventories. Strategic petroleum reserves are directly controlled by the national government; commercial petroleum inventories are reserved by oilfield companies, import and export traders, refineries and consumers to ensure normal production.
OECD strategic stocks
OECD business inventories
U.S. business inventories and strategic inventories historical data
*Organization for Economic Co-operation and Development, referred to as OECD, is an intergovernmental international economic organization composed of 38 market economy countries. It aims to jointly respond to the economic challenges brought about by globalization. , social and government governance challenges, and seize the opportunities brought by globalization. Founded in 1961, it has a total of 38 member states and is headquartered in Paris, France. The 20 founding members in 1961 are: the United States, the United Kingdom, France, Germany, Italy, Canada, Ireland, the Netherlands, Belgium, Luxembourg, Austria, Switzerland, Norway, Iceland, Denmark, Sweden, Spain, Portugal, Greece, Turkey. 18 later members, they are (years of membership in brackets): Japan (1964), Finland (1969), Australia (1971), New Zealand (1973), Mexico (1994), Czech Republic (1995 year), Hungary (1996), Poland (1996), South Korea (1996), Slovakia (2000), Chile (2010), Slovenia (2010), Estonia (2010), Israel (2010) , Latvia (2016), Lithuania (2018), Colombia (2020), Costa Rica (2021).
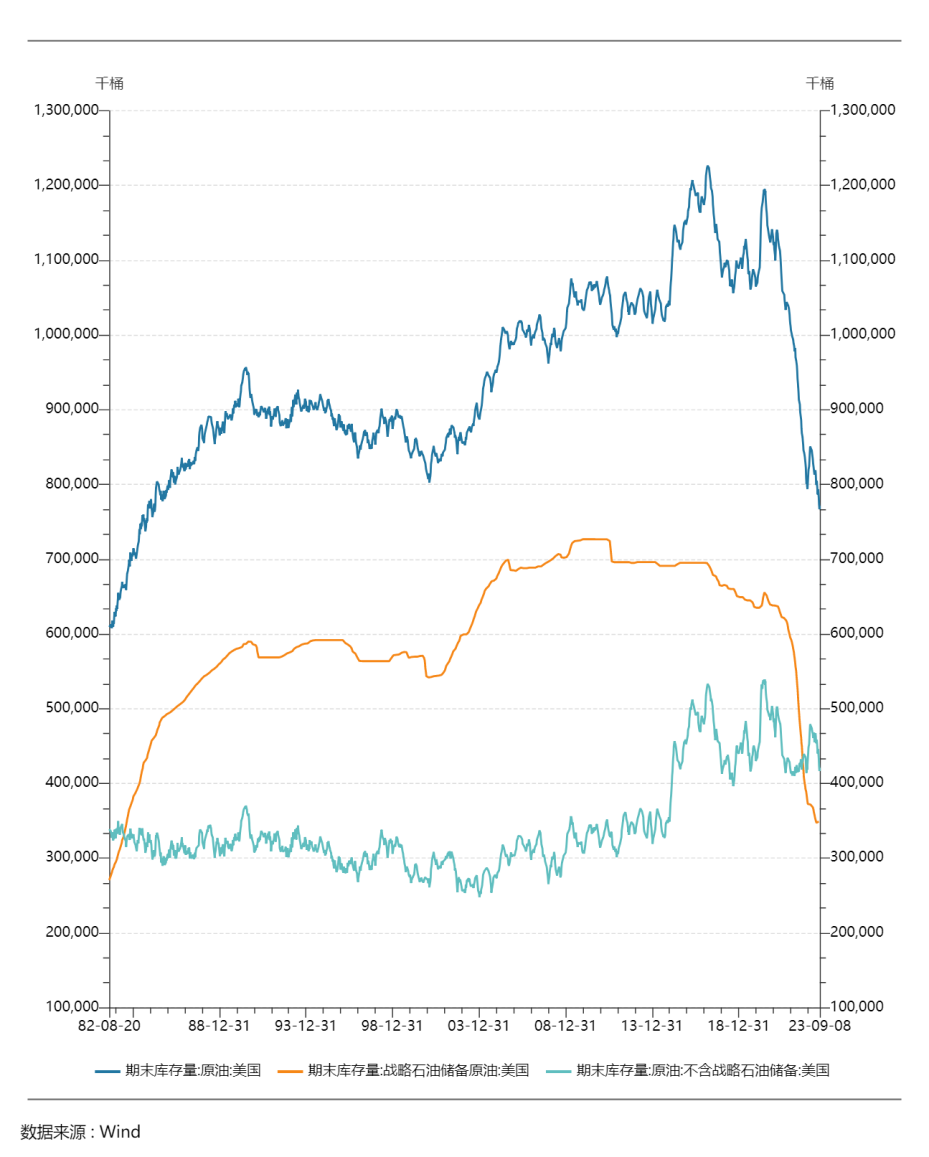
Total U.S. oil inventories (blue) have continued to decline since 2020, driven primarily by drawdowns in strategic reserves. In the short term, U.S. total inventories and commercial inventories rebounded to 850 million barrels and 480 million barrels respectively at the beginning of this year. However, they have continued to be depleted since March this year, with total inventories and commercial inventories falling to 770 million barrels and 420 million barrels respectively. lowest level this year.
The United States established the Strategic Petroleum Reserve (SPR) after the Arab oil embargoes in the 1970s. After 2015, the U.S. Congress passed multiple laws requiring the sale of strategic petroleum reserves and reducing the size of the reserves. The proceeds from the sales were listed as fiscal revenue for the current year and used for relevant fiscal expenditures designated by Congress. The United States strategic oil inventories have been declining since 2021, with current inventories of 350 million barrels, the lowest in nearly 40 years. What is the approximate level of 350 million barrels? The average crude oil consumption in the United States in 2022 is 19.14 million barrels per day. The strategic reserve of 350 million barrels is approximately equal to 18 days of crude oil consumption in the United States.
On March 1, 2022, in response to the sharp rise in international oil prices after the outbreak of the war between Russia and Ukraine, the International Energy Agency announced that 31 member countries jointly released 60 million barrels of oil reserves to the market, of which the United States released 30 million barrels. , accounting for 50% of the member countries of the International Energy Agency. On March 31, 2022, Biden announced the release of 1 million barrels per day of strategic oil reserves into the market over the next six months. The United States released a total of 218 million barrels in 2022, the largest reserve release in history, resulting in a significant reduction in strategic reserves.
On February 13, 2023, the U.S. Strategic Petroleum Reserve solicited bids for an additional 26 million barrels of Strategic Reserve crude oil and the contract was awarded on March 9. Sources say the Biden administration tried to block the sale but ultimately failed.
On May 15, 2023, the U.S. Congress agreed with the Biden administration’s proposal to cancel the legal sale of 140 million barrels of strategic petroleum reserves in the 2024~2027 fiscal year. The continued release of strategic oil reserves in the United States may threaten the energy security of the United States. Therefore, the U.S. government is currently committed to replenishing reserves and has conducted three bidding and procurement activities this year. The first and second tenders were launched in May and June of this year respectively, with crude oil purchase volumes of 3 million and 3.2 million barrels respectively. The average crude oil prices were US$73 per barrel and US$71.98 per barrel respectively. In July 2023, the U.S. Department of Energys Office of Petroleum Reserves announced a third tender to purchase approximately 6 million barrels of crude oil for the Strategic Petroleum Reserve, expected to be delivered from October to November this year, but withdrew the purchase plan due to high oil prices. The purchase and storage arrangement of the US strategic inventory is an important factor affecting crude oil prices.
4. Trade flow
The mismatch between crude oil production and consumption forms the flow of oil trade. As can be seen from the figure below, the production/consumption ratio varies widely around the world. The production/consumption ratio in the Middle East is as high as 3.33 while in the Asia-Pacific region it is only 0.2.
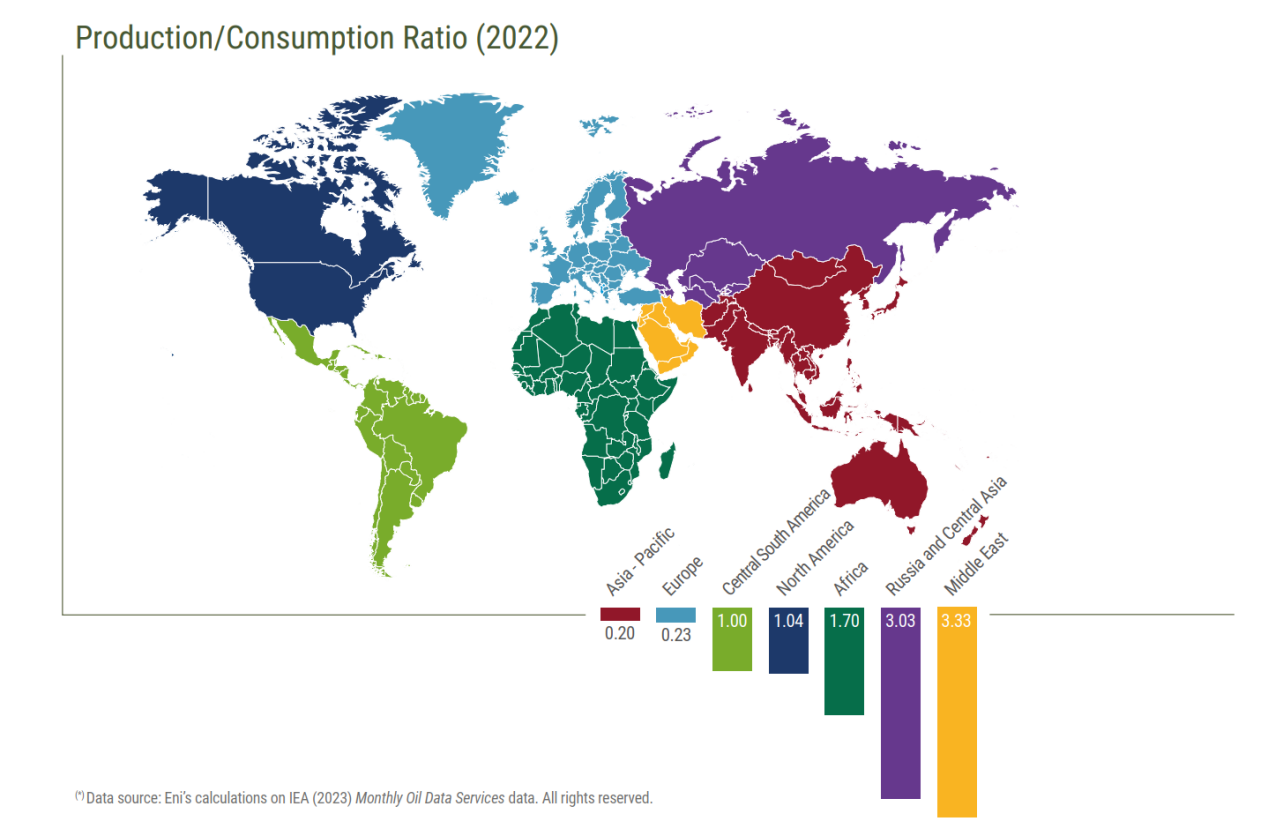
Source: eni world oild review
At present, the main crude oil export regions are the Middle East, the CIS, the United States, Canada and Africa, and the main crude oil import regions are Europe, the United States, the Asia-Pacific region and India. The reason why the United States imports and exports crude oil at the same time is the difference in crude oil quality. Different densities of crude oil require different equipment and processes for refining. Heavy oil requires additional refining processes such as cracking or coking, which requires higher investment. Therefore, the price of heavy oil is usually lower than that of light oil. U.S. refineries generally have high Nielsen coefficients and are configured to process heavy crude oil. Refineries need a type of crude oil that matches their processing capabilities to maximize profits. Therefore, the United States tends to import heavier grades of crude oil while exporting light oil.
In 2022, the total international crude oil trade volume will be 2.129 billion barrels. China is currently the worlds largest crude oil importer, accounting for 23.9% of the worlds total crude oil imports. It is also the worlds second largest oil consumer after the United States. In 2022, China imported a total of 508 million barrels of crude oil, mainly from Russia and the Middle East. Saudi Arabia, which has the highest crude oil export value, exported a total of 365 million barrels, mainly to the Asia-Pacific region.
*The Commonwealth of Independent States, referred to as the CIS, is a regional organization composed of several former Soviet republics when the former Soviet Union collapsed. There are currently 9 members, namely Azerbaijan, Armenia, Belarus, Kyrgyzstan, Moldova, Kazakhstan, Russia, Uzbekistan, and Tajikistan
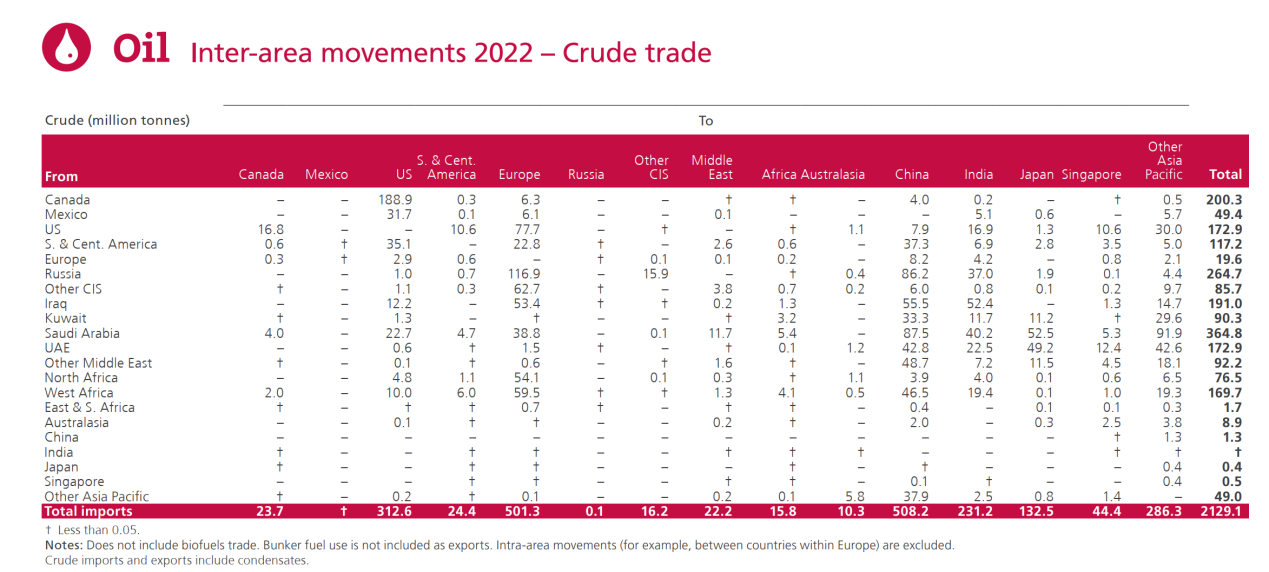
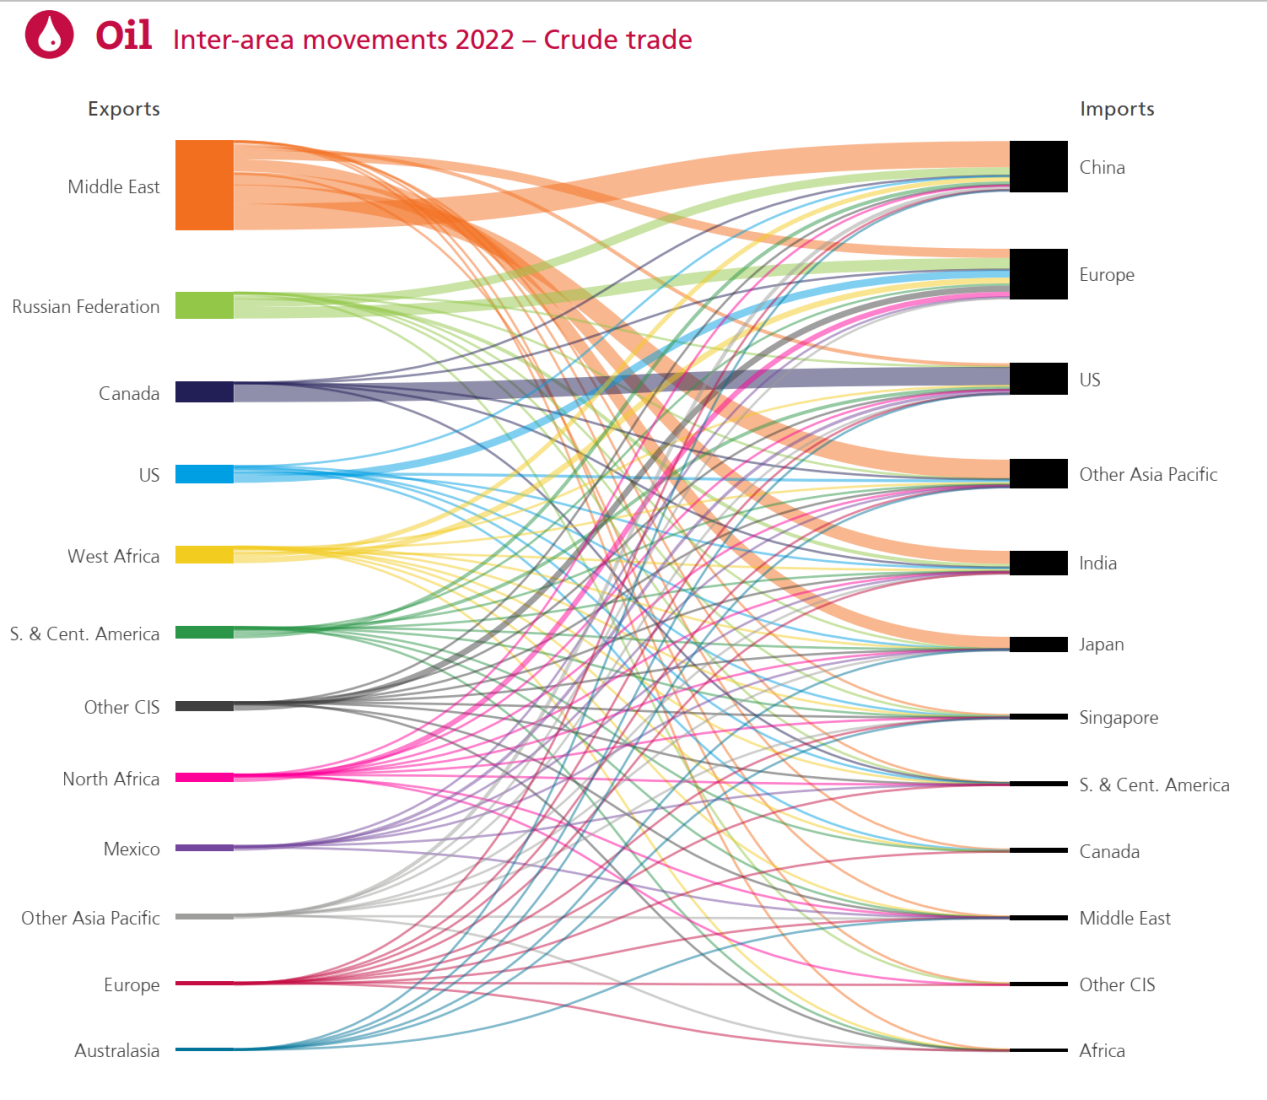
Source: Statistical Review of World Energy
4. Crude oil and US dollar index
Generally speaking, the continued rise of the US dollar is negative for commodities priced in US dollars. International crude oil transactions are usually priced in U.S. dollars. When the U.S. dollar appreciates, the amount of local currencies used by countries to purchase crude oil increases relative to the purchase cost, which puts downward pressure on crude oil prices. On the contrary, when the U.S. dollar depreciates, the amount of local currencies used by countries to purchase crude oil decreases. The decline in purchase costs puts upward pressure on crude oil prices; increased oil demand may push the U.S. dollar to strengthen. Since oil transactions are priced in U.S. dollars, when global economic growth leads to an increase in oil demand, the supply of U.S. dollars required to purchase oil will also increase, forming a negative impact on the U.S. dollar. demand, pushing the dollar stronger. From the perspective of international trade, the United States is currently an exporter of petroleum products. Rising oil prices will lead to a reduction in the US trade deficit and a strengthening of the offshore dollar.
However, judging from historical data, the two have not maintained a negative correlation for a long time, and the period when the negative correlation is more obvious is not entirely driven by the relationship between the US dollar and crude oil. Crude oil is affected by complex factors such as supply and demand, great power competition, geopolitics, and macroeconomics. The U.S. dollar exchange rate is only one aspect that affects crude oil prices.
Historical correlation between crude oil prices and the U.S. dollar index
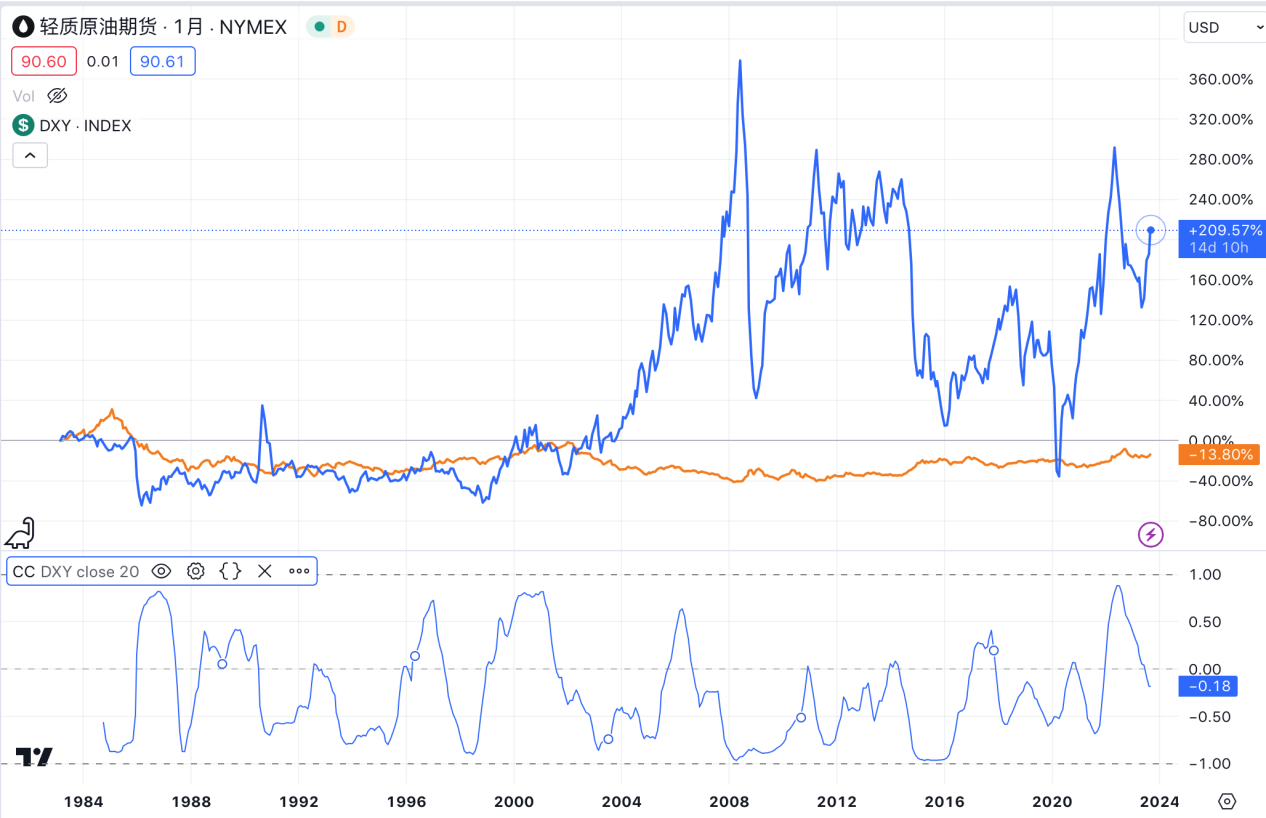
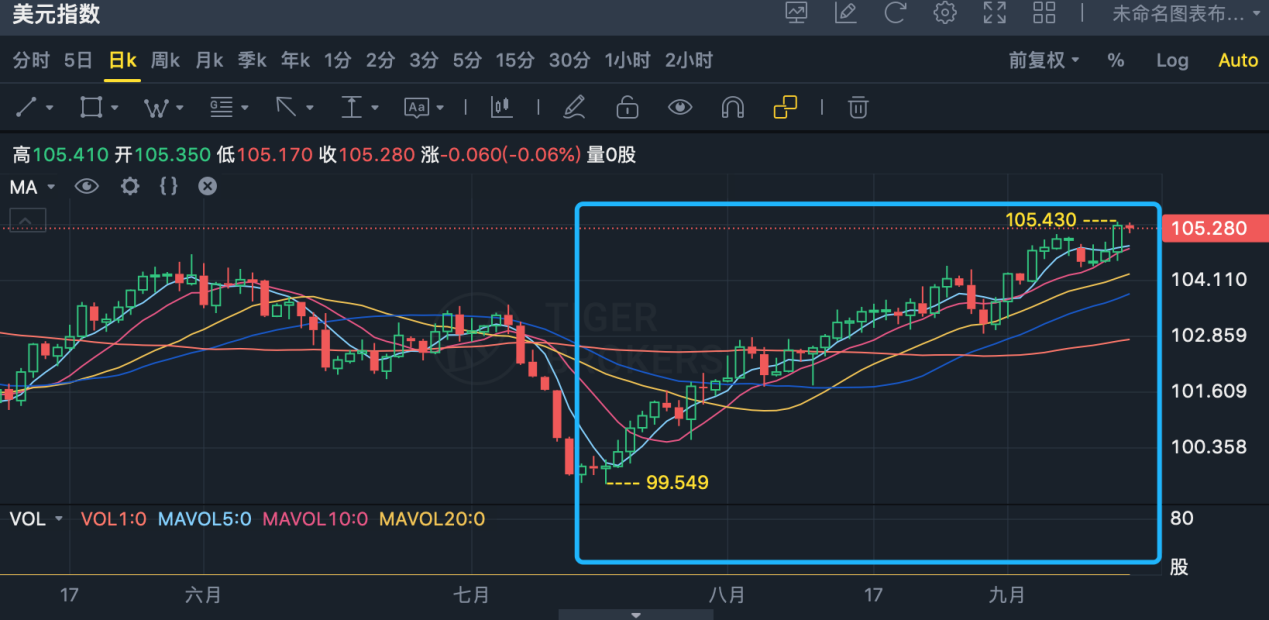
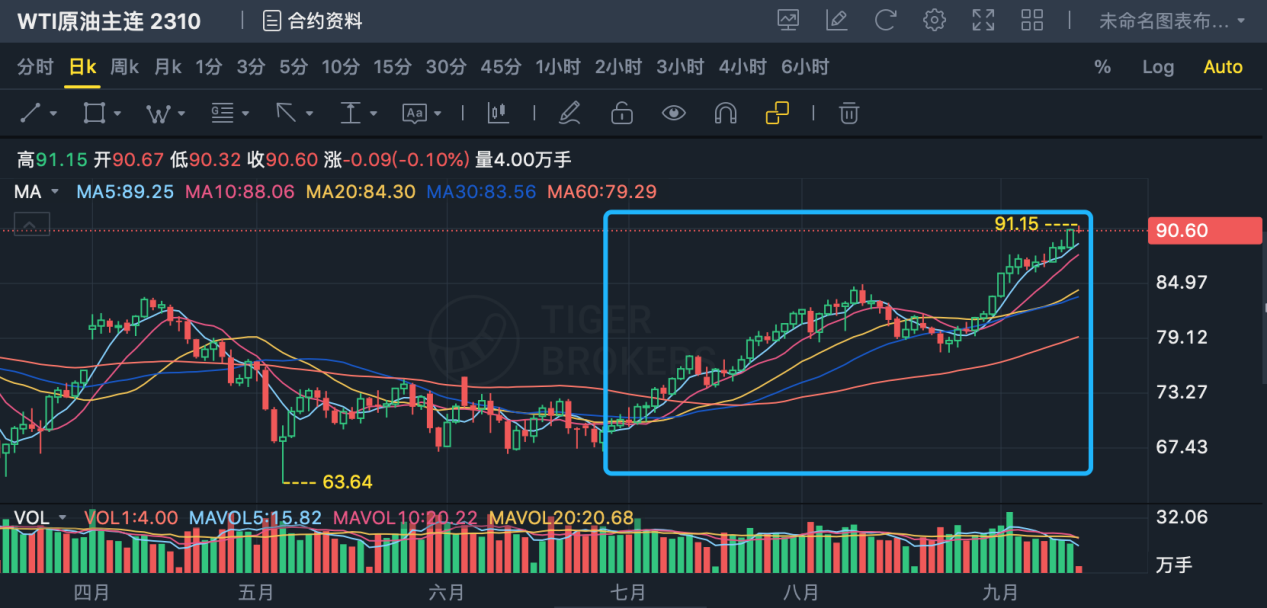
Since July this year, the US dollar and crude oil have risen simultaneously, which mainly reflects the disturbance caused by supply-side rather than demand-side factors.
5. Crude oil and inflation
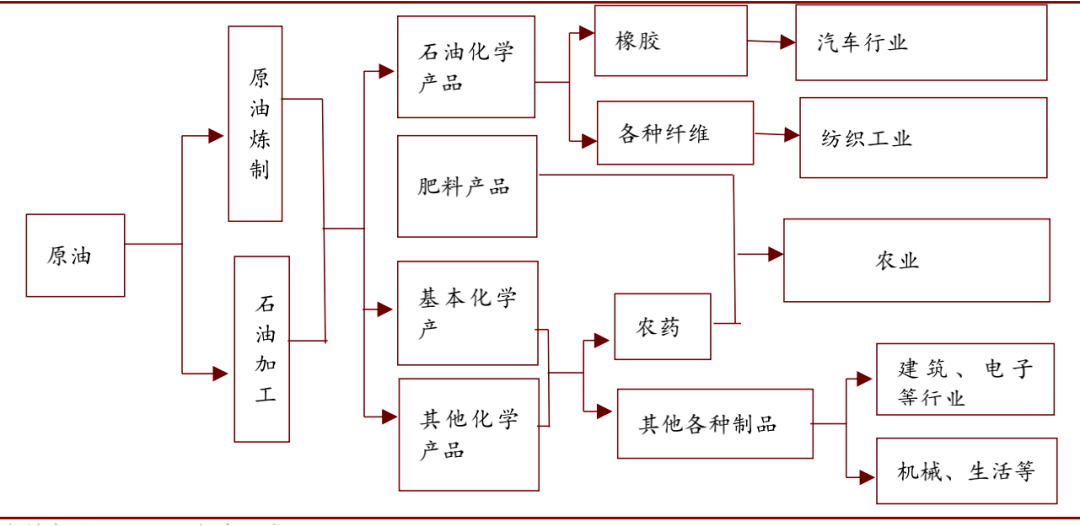
Rising inflation expectations could push crude oil prices higher. When inflation expectations rise, the expected purchasing power of money decreases. Investors may move funds from currencies to real assets such as crude oil, gold and commodities, leading to increased demand for crude oil and pushing crude oil prices higher. Crude oil is an important production factor. Companies and consumers may expect that costs will increase in the future, so they purchase and reserve crude oil and other raw materials in advance to avoid the risk of future price increases; rising crude oil prices will exacerbate inflationary pressures. On the one hand, since crude oil occupies an important weight in the CPI, rising crude oil prices directly affect a basket of commodities, leading to an increase in oil prices and related petrochemical product costs. On the other hand, oil prices are transmitted downward through the industrial chain. The increase in the cost of industrial products such as diesel, kerosene, and fuel oil will cause the prices of metal products, plastics, etc. to rise accordingly. From production labor costs in the industrial field to consumer prices in the commodity and service industry, the final All will rise.
Crude oil chemical industry chain
Source: China Merchants Securities
The U.S. CPI indicator reflects changes in the price level of goods and services related to residents lives, and is calculated by the weighted average of each sub-data. According to the CPI weight calculation rules announced by the U.S. Department of Labor in 2023, housing prices account for the highest proportion, about 34%; food and beverage and transportation prices follow, both at about 13%; medical prices account for 8.1%. Energy prices accounted for 6.9%. Federal Reserve Chairman Jerome Powell said in his semi-annual testimony to the U.S. Senate Banking Committee in March 2022 that a rough rule of thumb is that a $10 per barrel increase in oil prices would lead to a 0.2% increase in inflation and a 0.1% impact on economic growth. of blow.
Data shows spot oil prices maintain a strong correlation with market indicators of longer-term inflation expectations.
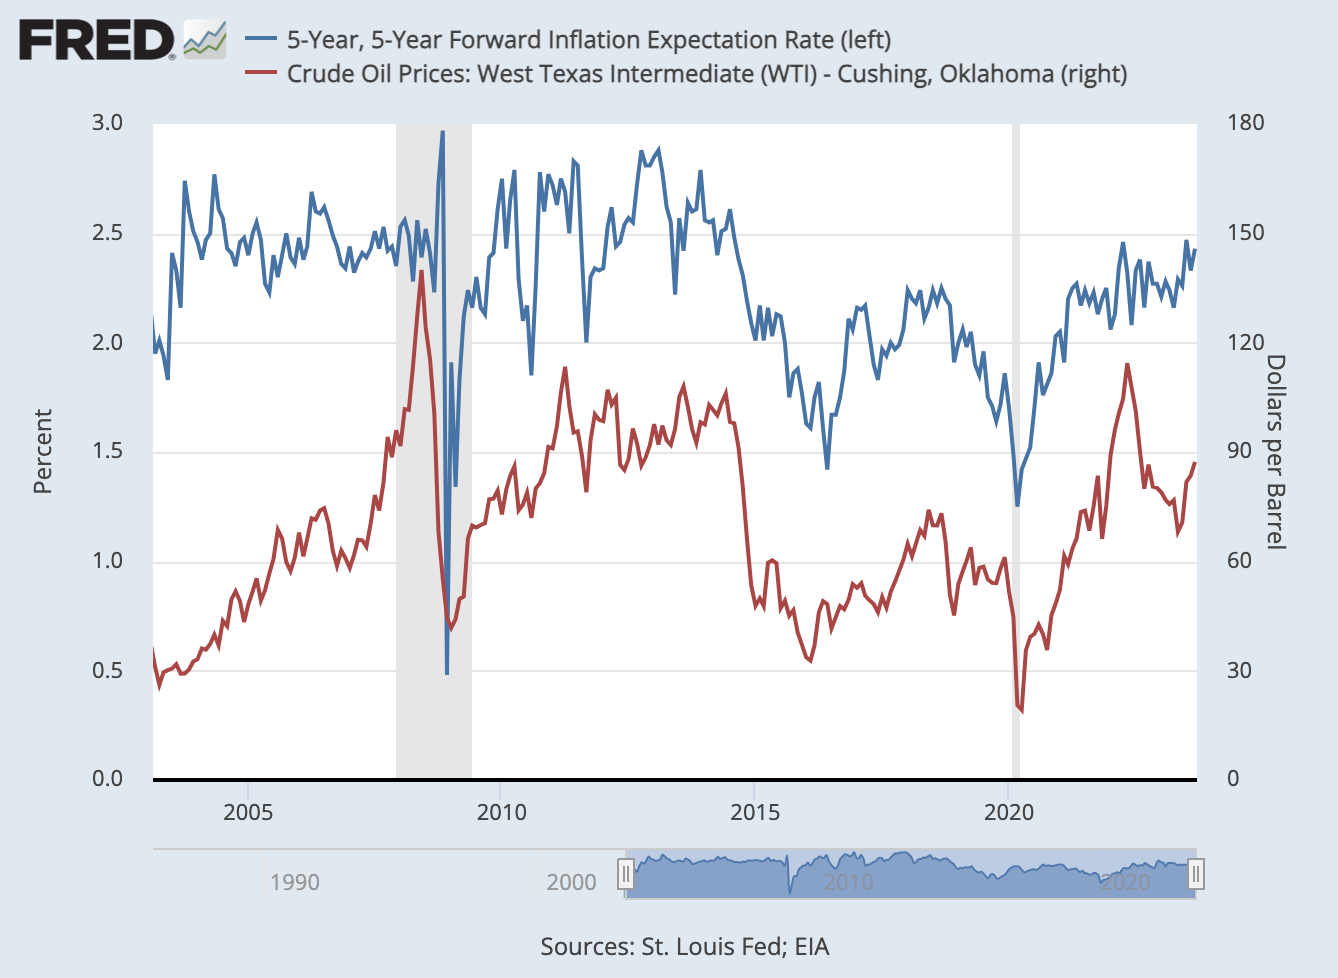
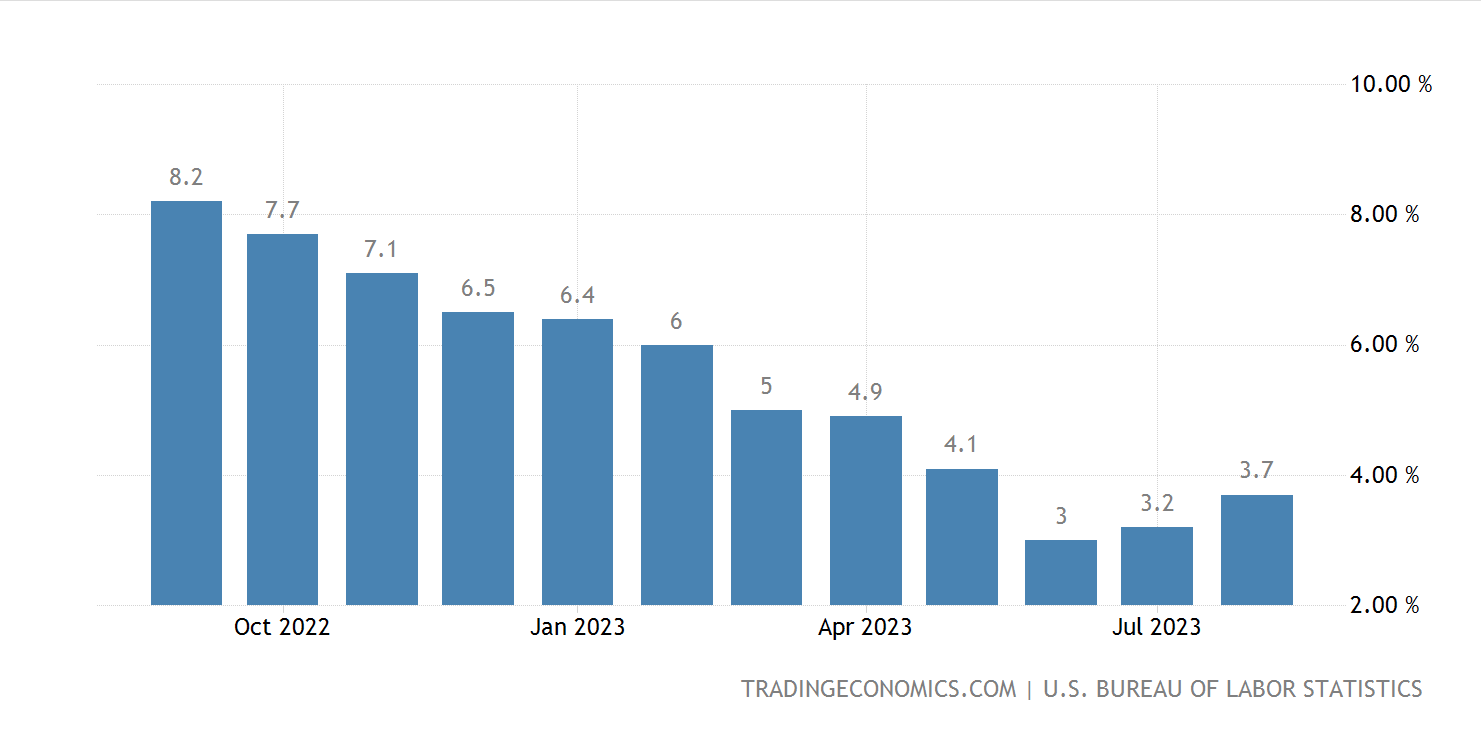
The U.S. CPI rebounded to 3.7% year-on-year in August from 3.2% in July, exceeding expectations of 3.6%. The year-on-year growth rate of core CPI dropped from 4.7% to 4.3%, and the month-on-month increase slightly expanded to 0.3% from 0.2% last month, exceeding expectations of 0.2%. Rising oil prices were the biggest driver of CPI in August, accounting for more than half of the CPI increase. As oil prices climb further towards $100, it could lead to the Federal Reserve keeping interest rates high for longer to control inflation.
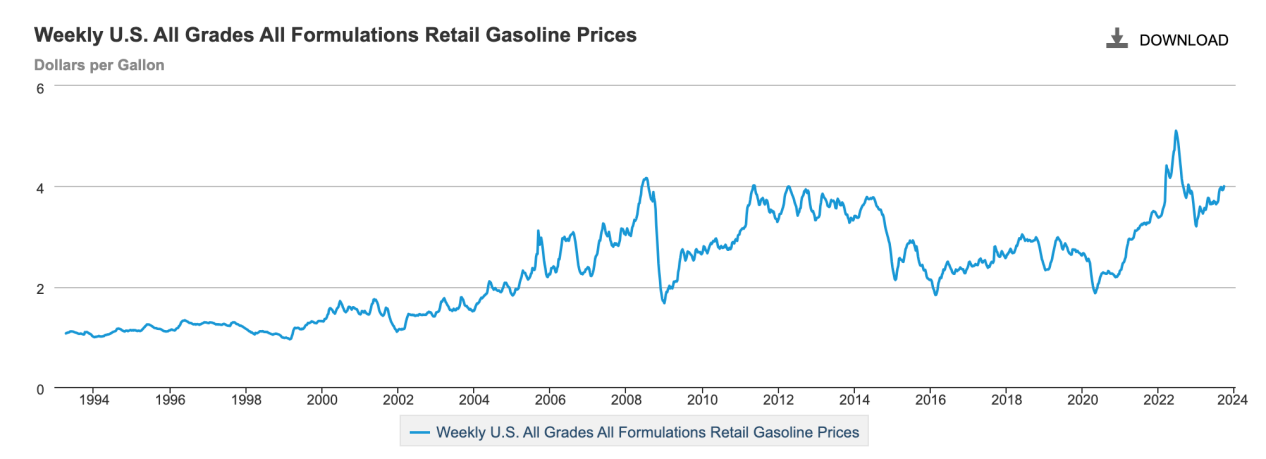
In addition to the economic impact of rising crude oil prices, it may also have political consequences. U.S. retail gasoline prices rose quickly to nearly $4, driven by rising crude oil prices. According to data from the American Automobile Association AAA, the current average price of regular gasoline at U.S. gas stations is $3.88 per gallon, and the overall oil price level is at a relatively historical high. An American social survey agency once regarded the rise in the retail price of gasoline to US$4 as a high gas price that is unacceptable to the public. Historically, for every $10 change in the price of a barrel of crude oil, the price of gasoline will change by 25-30 cents. If the price of Brent oil reaches $100, the US gasoline price will most likely reach $4. Next year is a U.S. election year, and this could become a political issue.
6. Crude oil market situation this year
1. Crude oil price trend
(1) The bankruptcy of U.S. banks in March
Silvergate Bank declared bankruptcy on March 8, Silicon Valley Bank in the United States went bankrupt on March 10, and Signature Bank closed on March 13. Overlaying the Credit Suisse banking crisis in Europe, international oil prices suffered a sharp setback, turning to trading in the logic of global macro recession. , Brent crude oil prices fell by about US$10 per barrel, a drop of more than 10%.
(2) OPEC+ announced production cuts in April
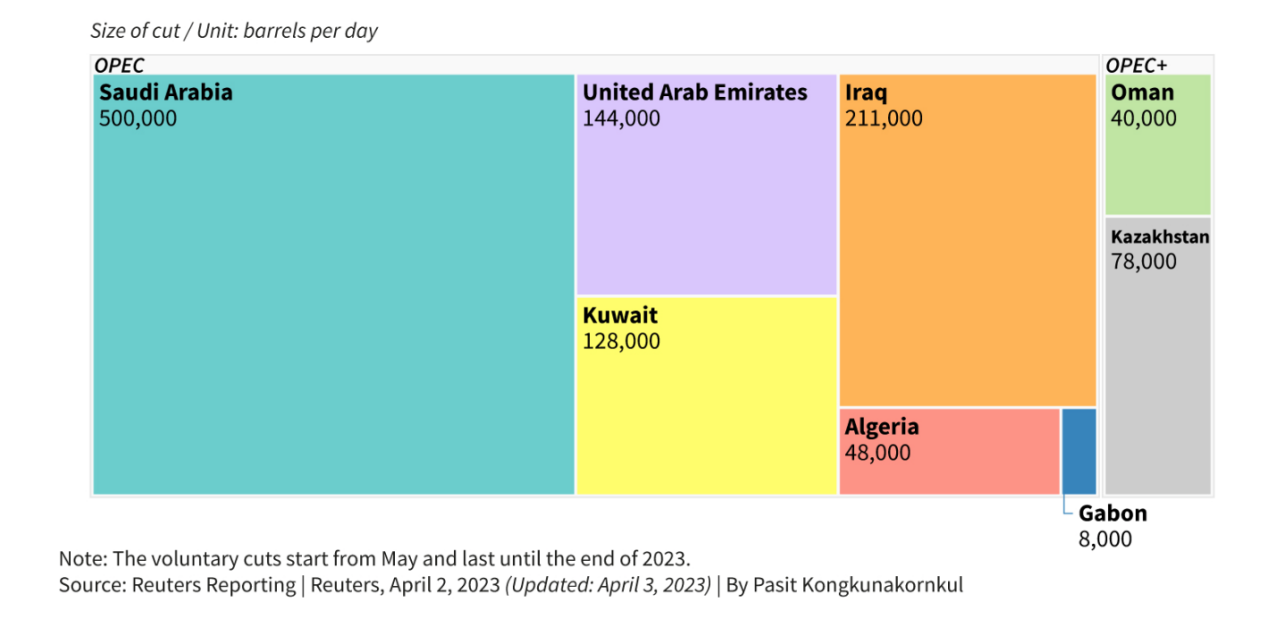
In order to maintain oil prices, OPEC+ announced a production reduction plan beyond expectations at its April 2023 production meeting, cutting production by approximately 1.16 million barrels per day.
①Saudi Arabia will implement a voluntary production reduction plan of 500,000 barrels per day from May until the end of 2023;
② Iraq voluntarily cuts oil production by 211,000 barrels per day starting in May until the end of 2023;
③The UAE will voluntarily reduce oil production by 144,000 barrels per day from May to the end of 2023;
④Kuwait will voluntarily reduce oil production by 128,000 barrels per day starting in May until the end of 2023; ⑤Kazakhstan will contribute 78,000 barrels per day to OPEC+ production reductions;
⑥Algeria will cut oil production by 48,000 barrels per day from May to the end of 2023;
⑦ Oman’s Ministry of Energy and Mines said it would voluntarily reduce oil production by 40,000 barrels per day starting in May and continuing until the end of 2023;
⑧Russia will voluntarily reduce its oil production by 500,000 barrels per day until the end of 2023. Previously in February, Russia had announced that it would reduce its crude oil production by 500,000 barrels per day in March, and later announced that it would extend this production cut to June this year. moon.
Oil prices bottomed out and rebounded, with Brent crude returning to pre-crisis price levels in mid-April.
(3) Impact of the debt crisis in May
In early May, the banking crisis in the U.S. and Europe and the heightened risk of U.S. debt defaults caused crude oil prices to plummet. After that, crude oil prices fluctuated in a range for a month and a half.
(4) Saudi Arabia will cut additional production from June
On June 5, Saudi Arabia announced an additional 1 million barrels/day of voluntary production cuts starting in July, increasing the number of voluntary production cuts from 500,000 barrels/day to 1.5 million barrels/day for one month, exceeding market expectations.
On July 5, Saudi Arabia announced that it would voluntarily extend its plan to cut oil production by 1 million barrels per day for one month, and said that the production reduction plan may be extended beyond August. Russia said it would cut oil exports by 500,000 barrels per day in August.
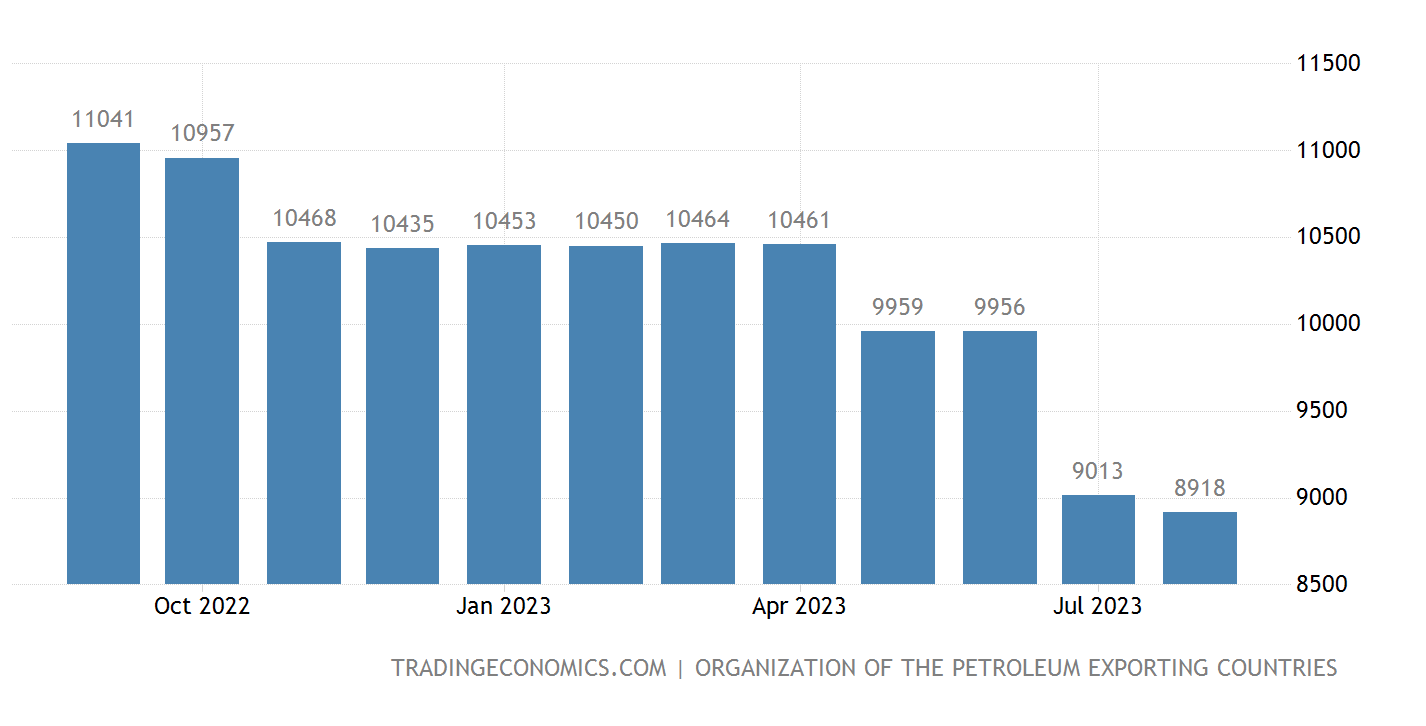
Saudi Arabia and Russia announced on August 3 that they would each extend supply cuts until at least September. Saudi Arabia will continue to voluntarily cut crude oil production by 1 million barrels per day, keeping crude output at a low of 9 million barrels per day. Russia said it would cut oil exports by 300,000 barrels per day in September. Coupled with the seasonal increase in peak summer travel demand in the United States, global oil market inventories have begun a depletion cycle, and oil prices have entered an upward channel in July and August.
Saudi Arabia’s crude oil production in the past year (unit: BBL/D/1 K)
(5) In September, Saudi Arabia and Russia extended their production reduction plans until the end of the year
On September 5, Saudi Arabia extended a one-time voluntary additional production cut of 1 million barrels per day for three months to the fourth quarter of 23. Russia also decided to extend the 300,000 barrels per day oil export reduction implemented in September until the end of the year. , pushing up concerns about shortages in the oil market, and oil prices rose further.
2. Crude oil supply and demand
Irans crude oil production continues to increase
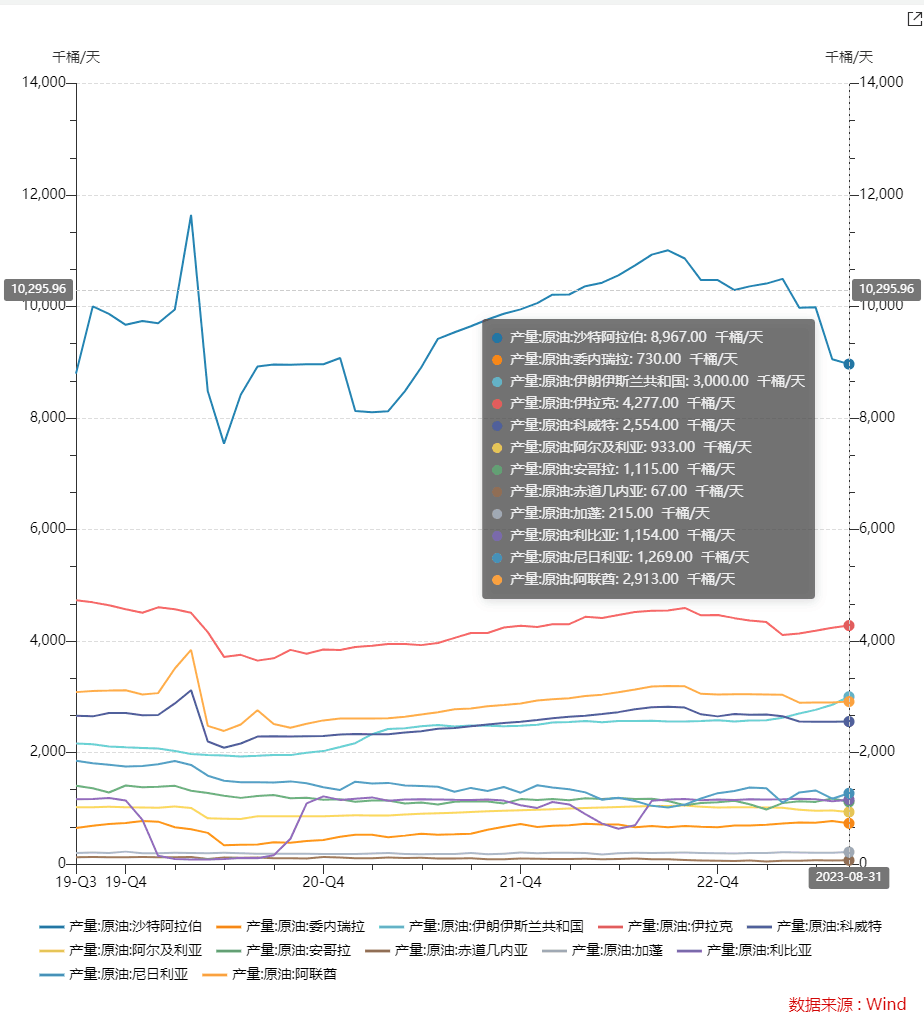
Contrary to the production cuts by Saudi Arabia and Russia, Irans crude oil production has continued to increase this year. As of August, the output was about 3 million barrels per day, an increase of nearly 500,000 barrels per day from the output level of 2.5 million barrels per day at the beginning of the year. Iran said in early August that it planned to further increase crude oil output to 3.5 million barrels per day in September.
*Refers to the period of strong consumption of gasoline and crude oil caused by American people driving and traveling in the summer. It starts from the U.S. Memorial Day at the end of May every year and ends at the U.S. Labor Day in early September every year, mainly in July and August. .
If its production increase target is fulfilled as scheduled, it will be able to significantly offset Saudi Arabias additional production cut plan of 1 million barrels per day in terms of supply and demand balance in the third quarter.
Iran’s crude oil supply continues to increase this year
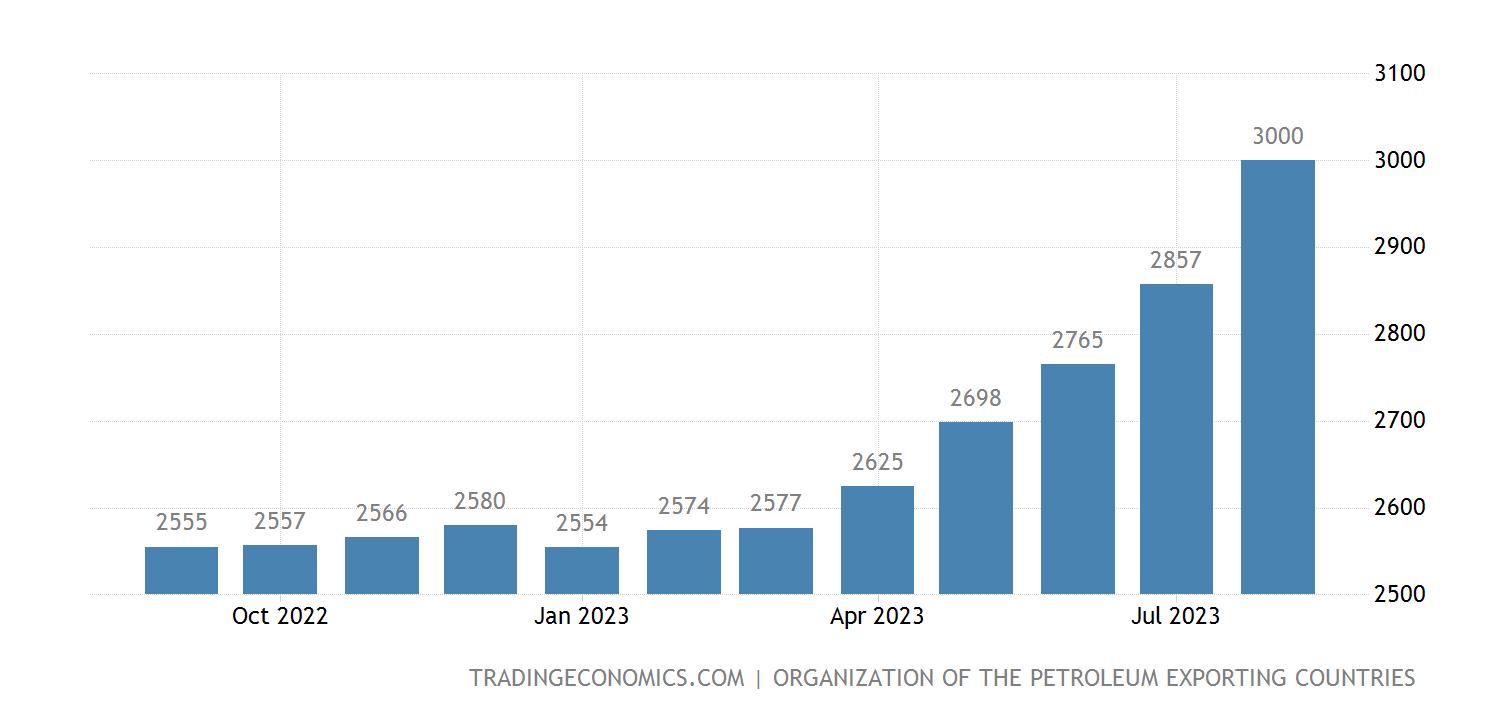
Since the second half of this year, the United States has continued to show signs of loosening the sanctions it has imposed on Iran for many years. On August 10, the United States and Iran reached a prisoner exchange agreement. On September 18, a spokesperson for the Iranian Ministry of Foreign Affairs stated that five Iranian citizens detained in U.S. prisons and five American prisoners held in Iran will be released. , and the US$6 billion that Iran had frozen in two banks in South Korea was unfrozen and transferred to bank accounts in Qatar. The easing of relations between Iran and the United States may be related to Irans recent continued increase in crude oil production. The U.S. government may choose to encourage Iran to increase production by easing relations with Iran.
U.S. crude oil production rises recently
U.S. crude oil production was 12.9 million barrels per day in the week ended September 15, unchanged from the previous week and up 700,000 barrels per day from the end of July. U.S. crude oil imports were 6.517 million barrels per day, a decrease of 1.07 million barrels per day from the previous week. U.S. crude oil exports were 5.067 million barrels per day, an increase of 1.98 million barrels per day from the previous week. U.S. crude oil processing capacity was 16.304 million barrels per day, a decrease of 0.5 million barrels per day from the previous week; the refinery operating rate was 91.9%, a decrease of 1.8 percentage points from last week.
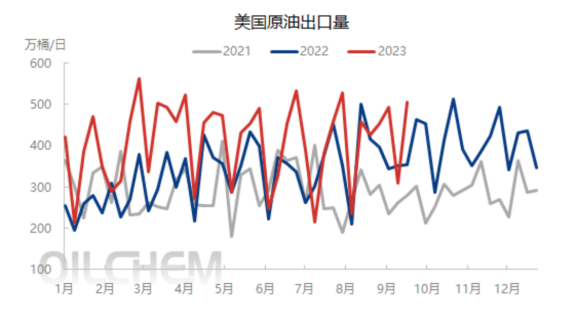
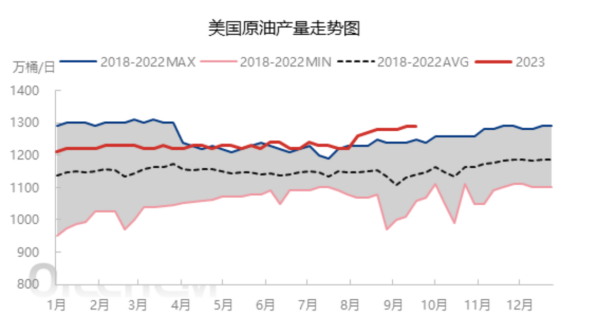
Data source: Longzhong Information
OPEC+ production cuts are generally implemented
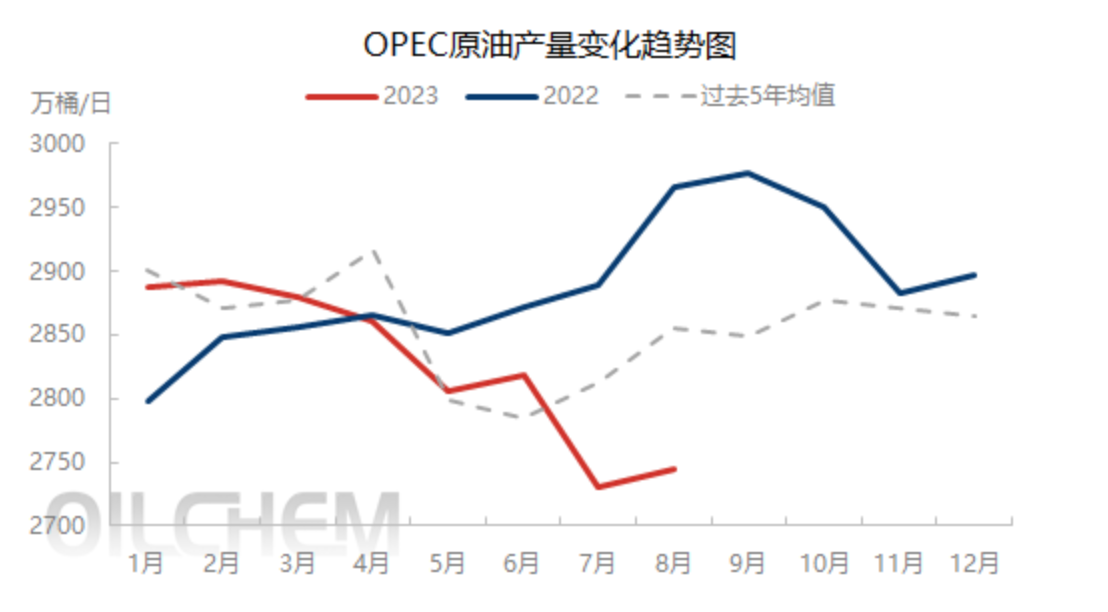
Since the third quarter, OPEC+s proactive supply adjustment has been implemented in the trade market. The total crude oil production of the OPEC+ production reduction agreement countries in August 2023 was 35.99 million barrels per day, which was below the production quota of 39.57 million barrels per day.
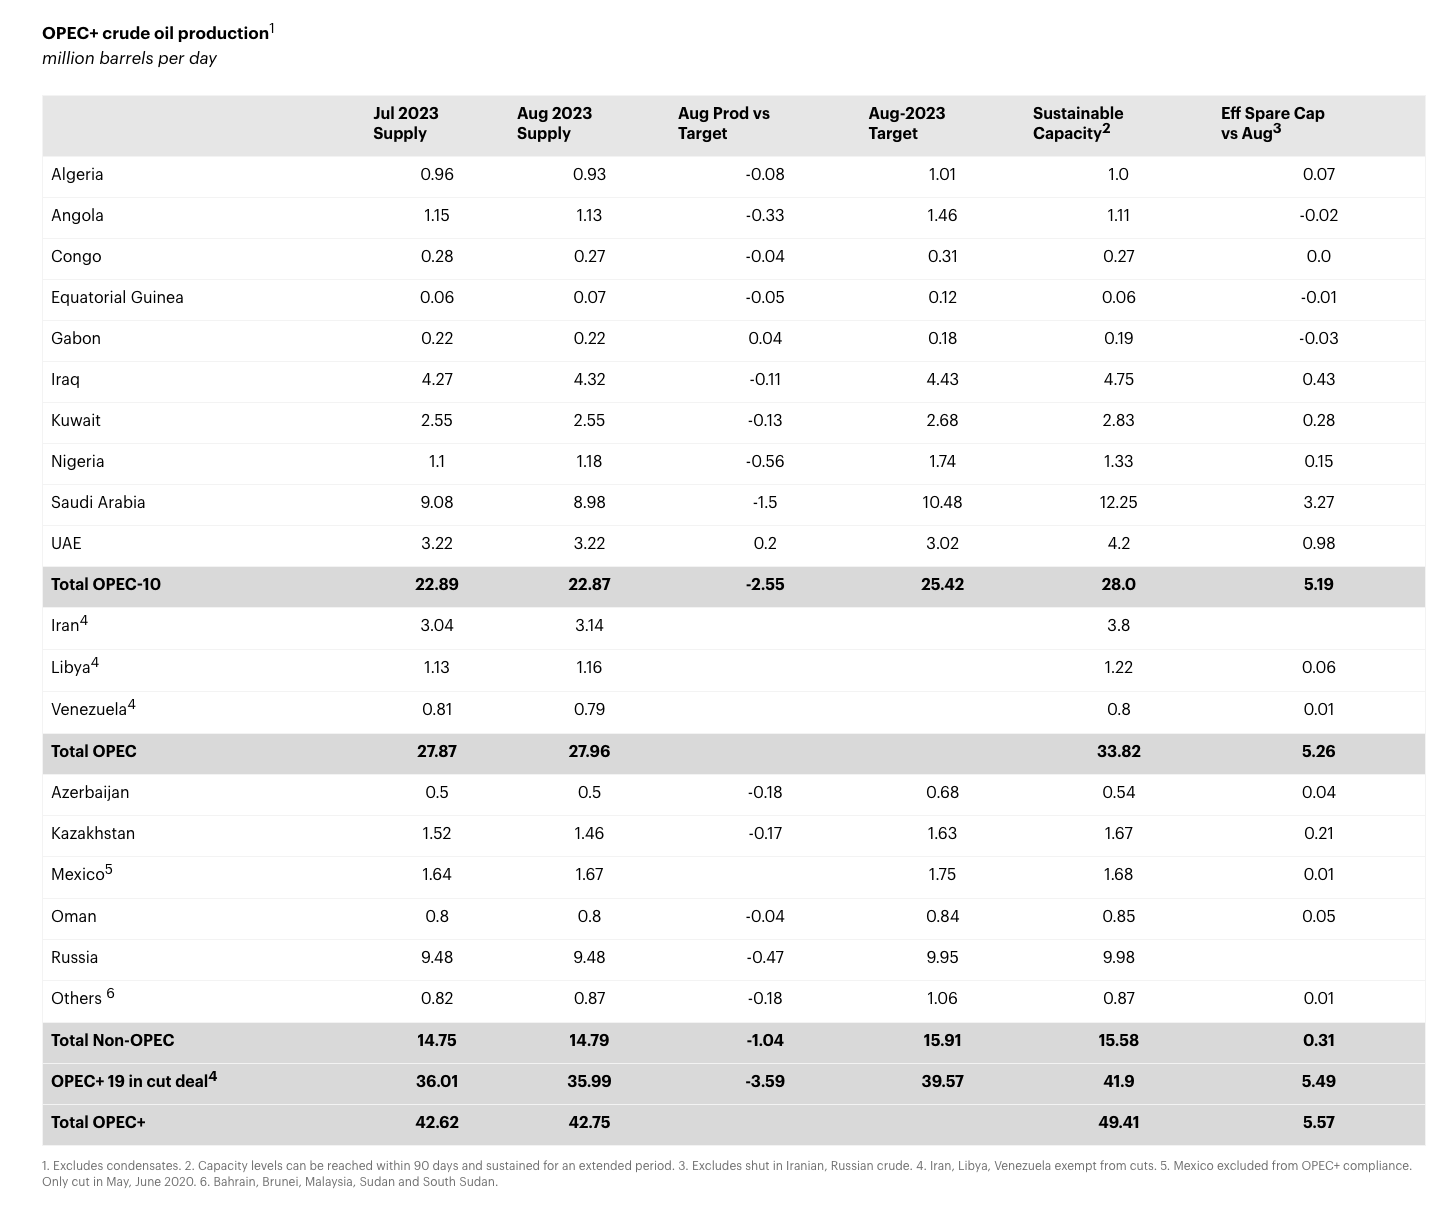
Source: IEA
Data source: Longzhong Information
China’s crude oil imports hit a record high in the first half of the year
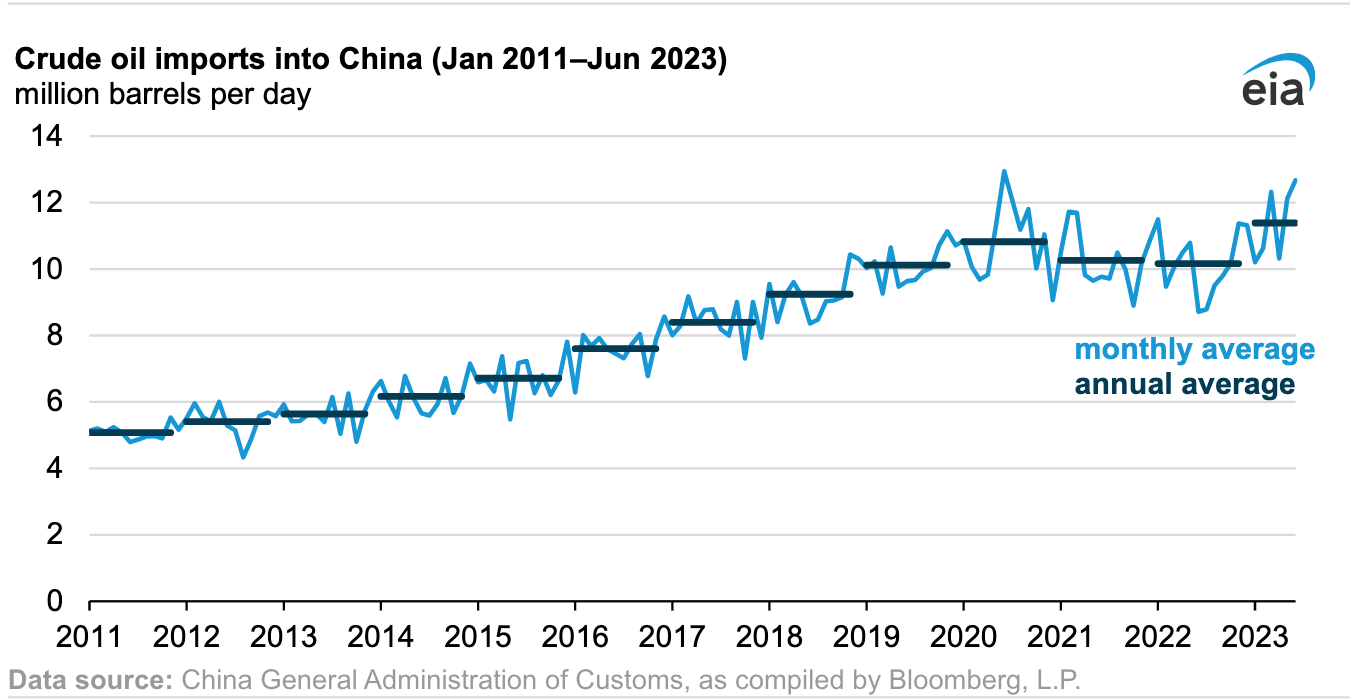
China imported a record amount of crude oil in the first half of 2023, driven by refinery expansion and government moves to reopen the economy after easing COVID-19 movement restrictions. In the first half of 2023, China imported an average of 11.4 million barrels of crude oil per day, an increase of 12% from the average of 10.2 million barrels per day in 2022. In the first half of 2023, most of Chinas new crude oil imports came from Russia, Iran, Brazil and the United States.
overall supply and demand situation
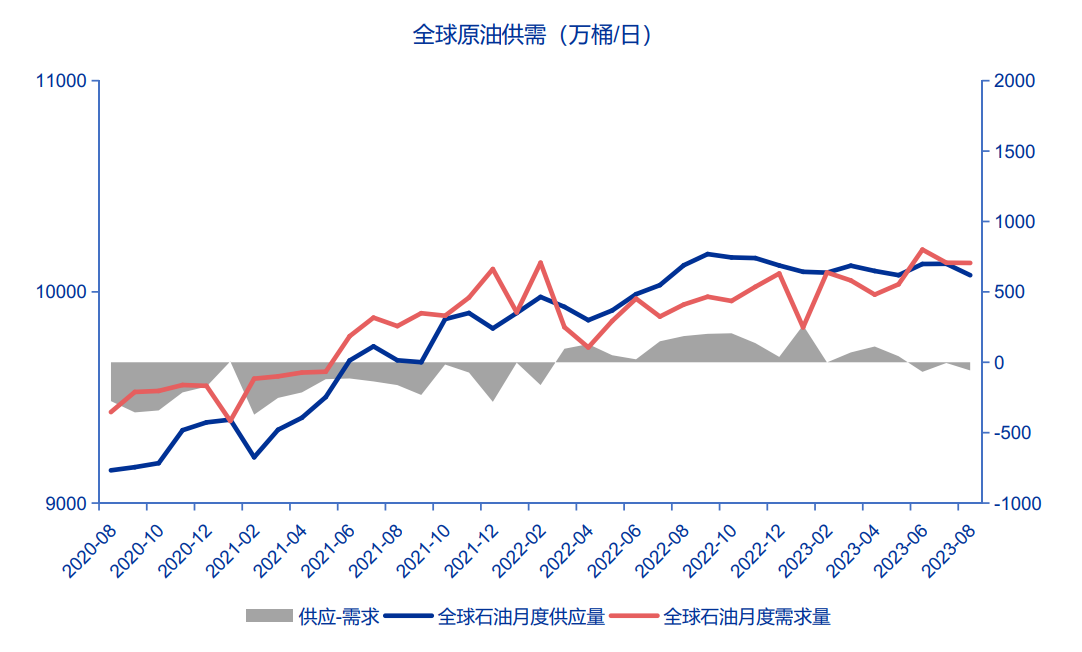
In August 2023, global crude oil supply was 100.79 million barrels per day, and global crude oil demand was 101.37 million barrels per day. The supply and demand pattern of the global crude oil market in August was that supply was less than demand.
7. The outlook of the three major institutions on the crude oil market
US Energy Information Administration (EIA)
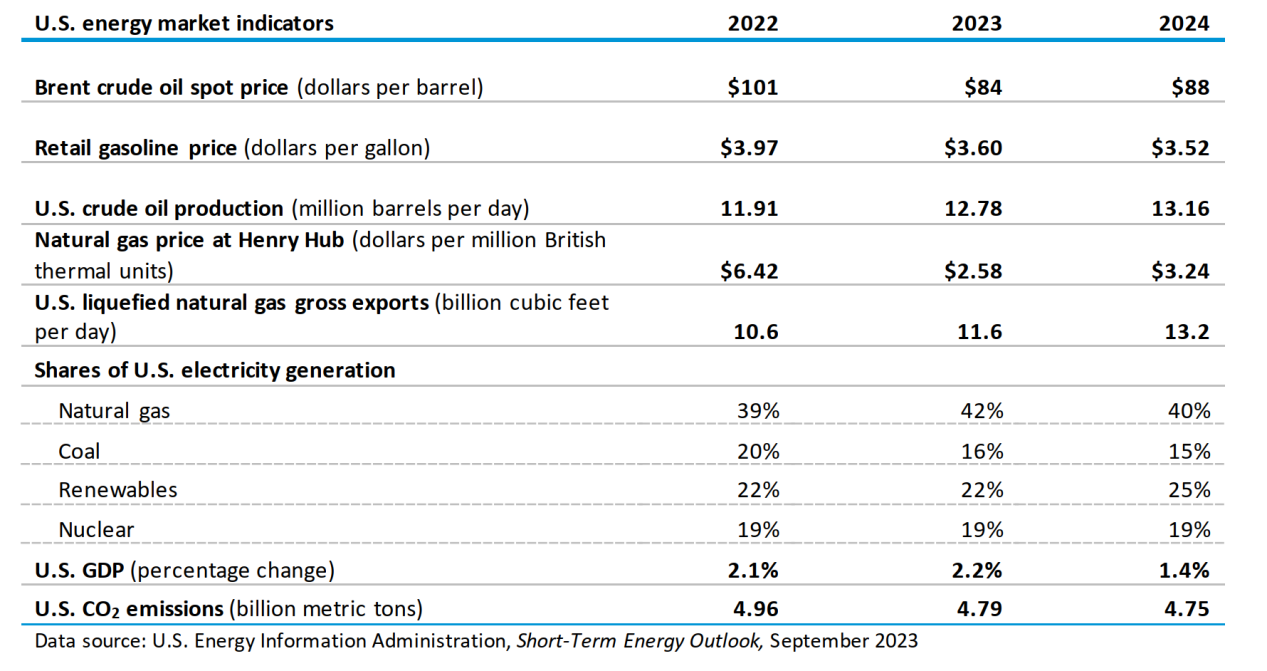
On the supply side, despite OPEC+s voluntary production cuts, increased oil production from non-OPEC countries will support an increase in output of 1.24 million barrels per day in 2023, reaching 101.18 million barrels per day. U.S. crude oil production is expected to be 12.78 million barrels per day in 2023, an increase of 870,000 barrels per day from last year. OPEC crude oil production was 27.91 million barrels per day, a decrease of 760,000 barrels per day from last year.
In terms of demand, global oil consumption is expected to increase by 1.81 million barrels/day from last year to 100.98 million barrels/day in 2023, of which Chinas demand increase is 780,000 barrels/day, accounting for 43% of the increase.
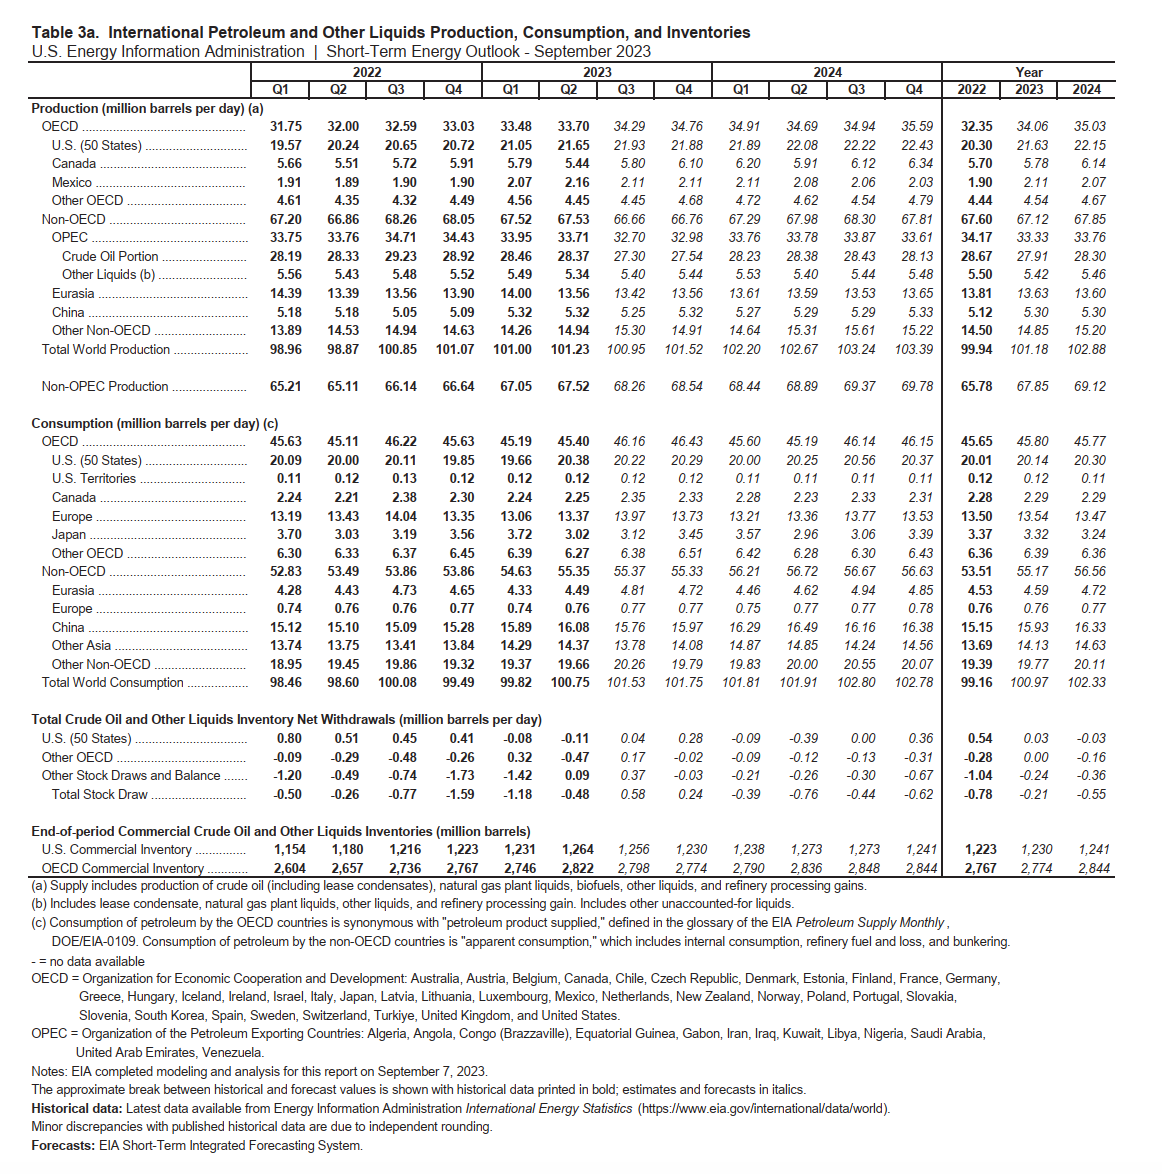
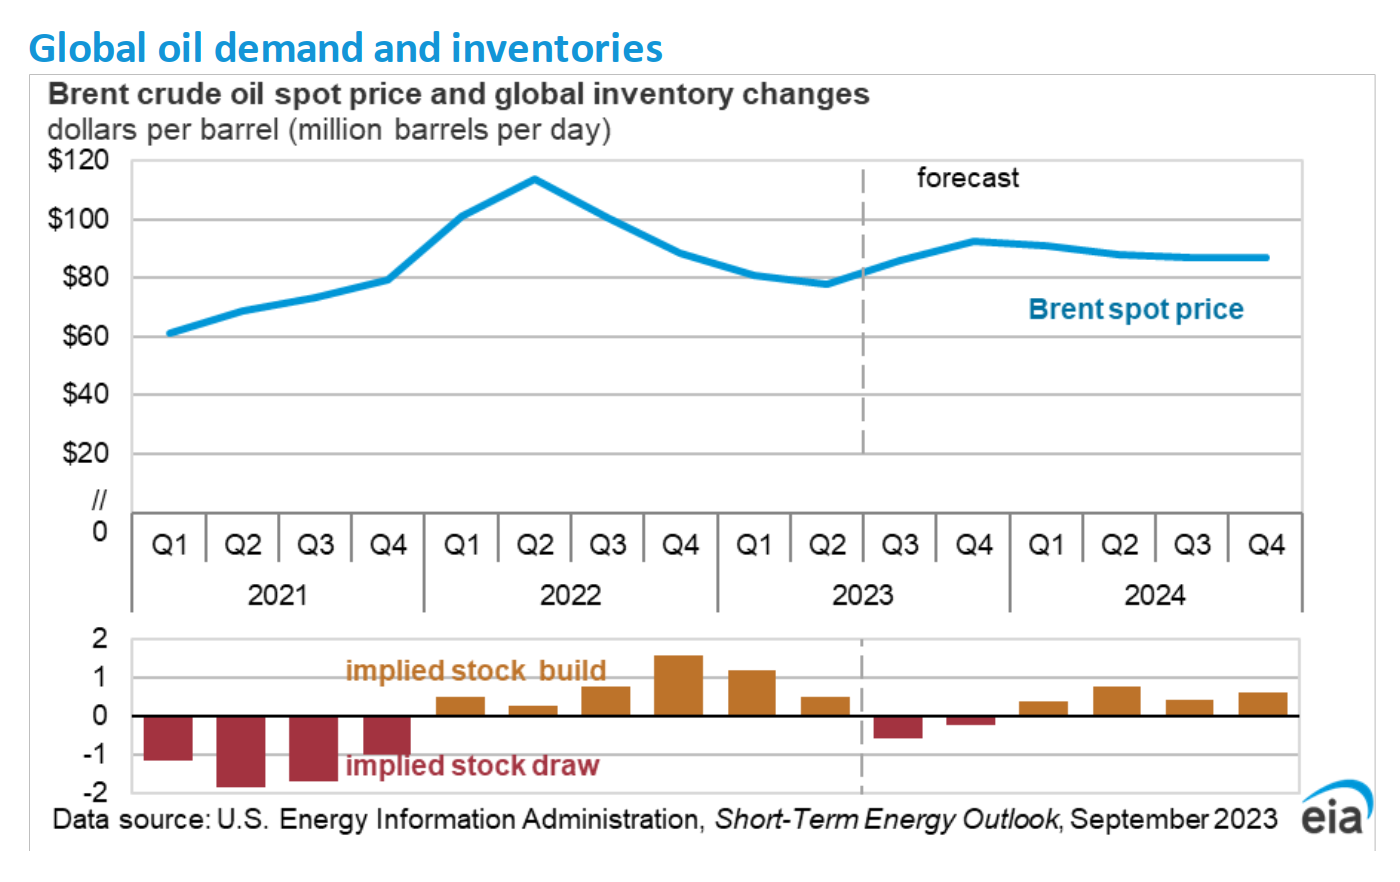
In terms of inventories, global oil inventories are expected to decrease by 600,000 barrels per day in the third quarter of this year, and are expected to drop to 200,000 barrels per day in the fourth quarter. Global oil inventories will put upward pressure on oil prices in the coming months. The spot price of Brent crude oil is expected to be US$93 per barrel in the fourth quarter of 2023, higher than US$86 per barrel in August, and the average price in 2024 is US$88 per barrel. .
Organization of the Petroleum Exporting Countries (OPEC)
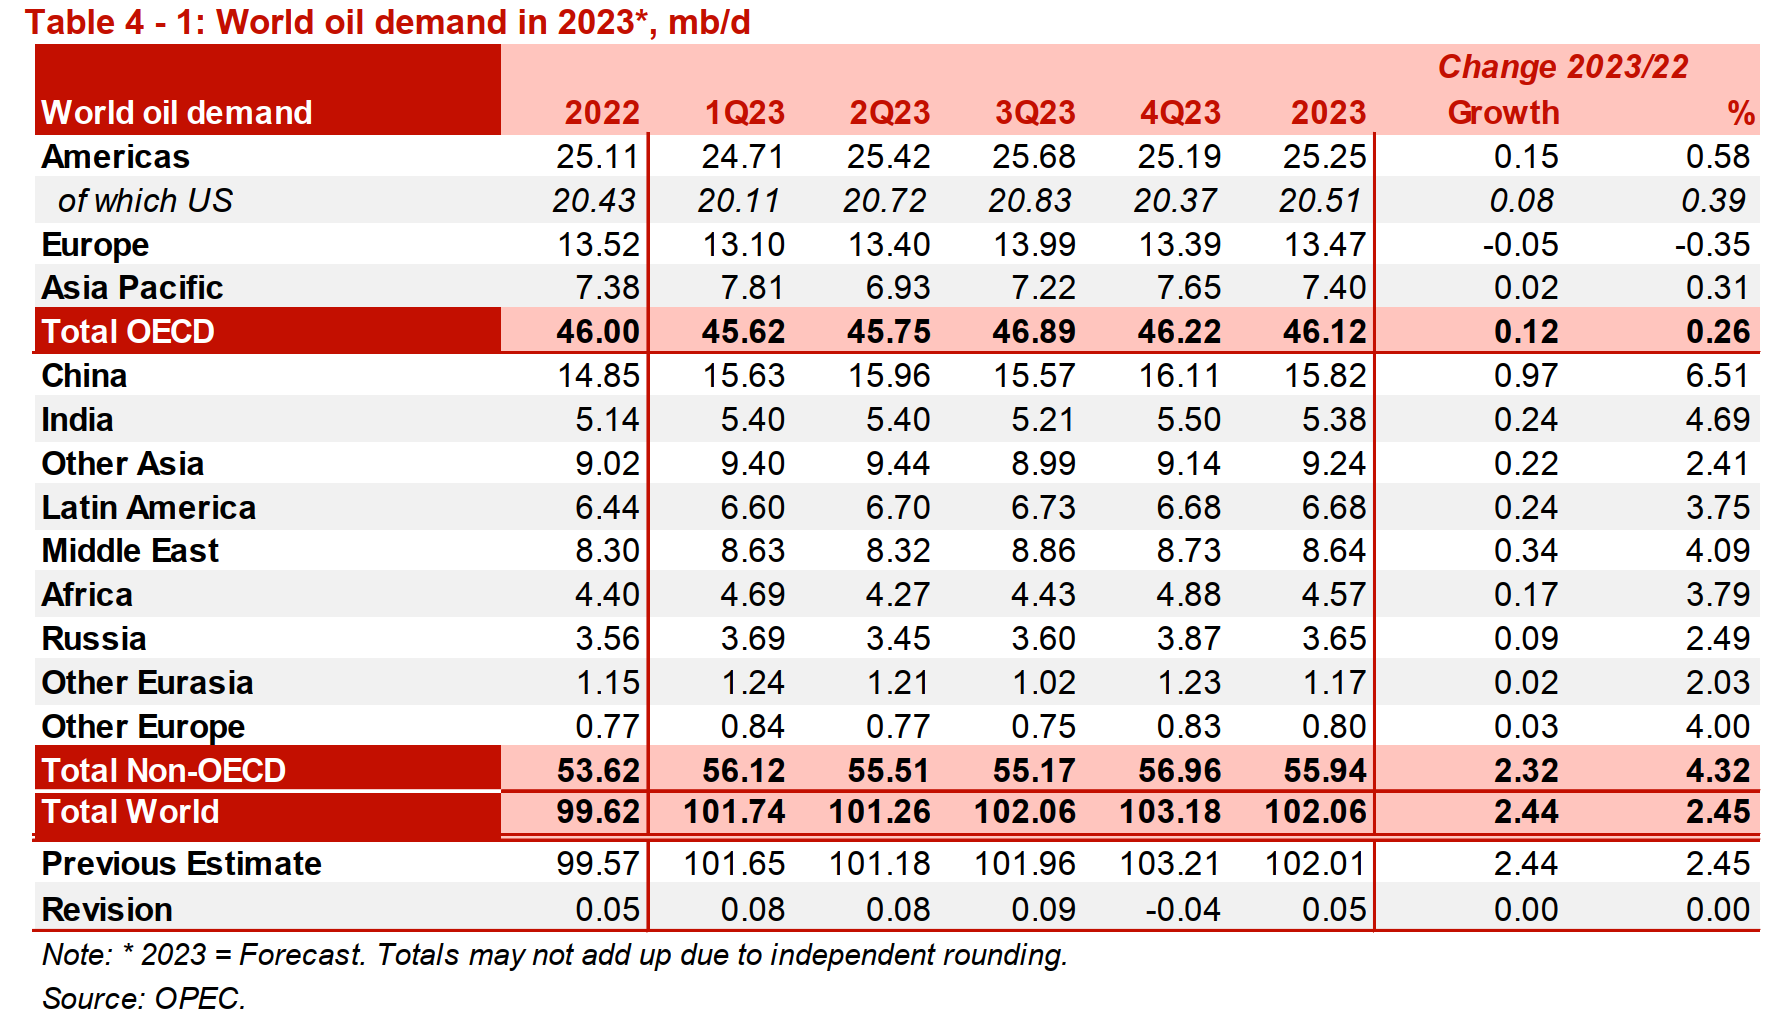
OPECs monthly oil market report shows that on the demand side, world oil demand will increase by 2.44 million barrels per day in 2023, with average demand reaching 102 million barrels per day, an increase of 2.45% from 2022. The forecast results are the same as last month. The largest growth is in China, with demand expected to grow by 6.51% in 2023.
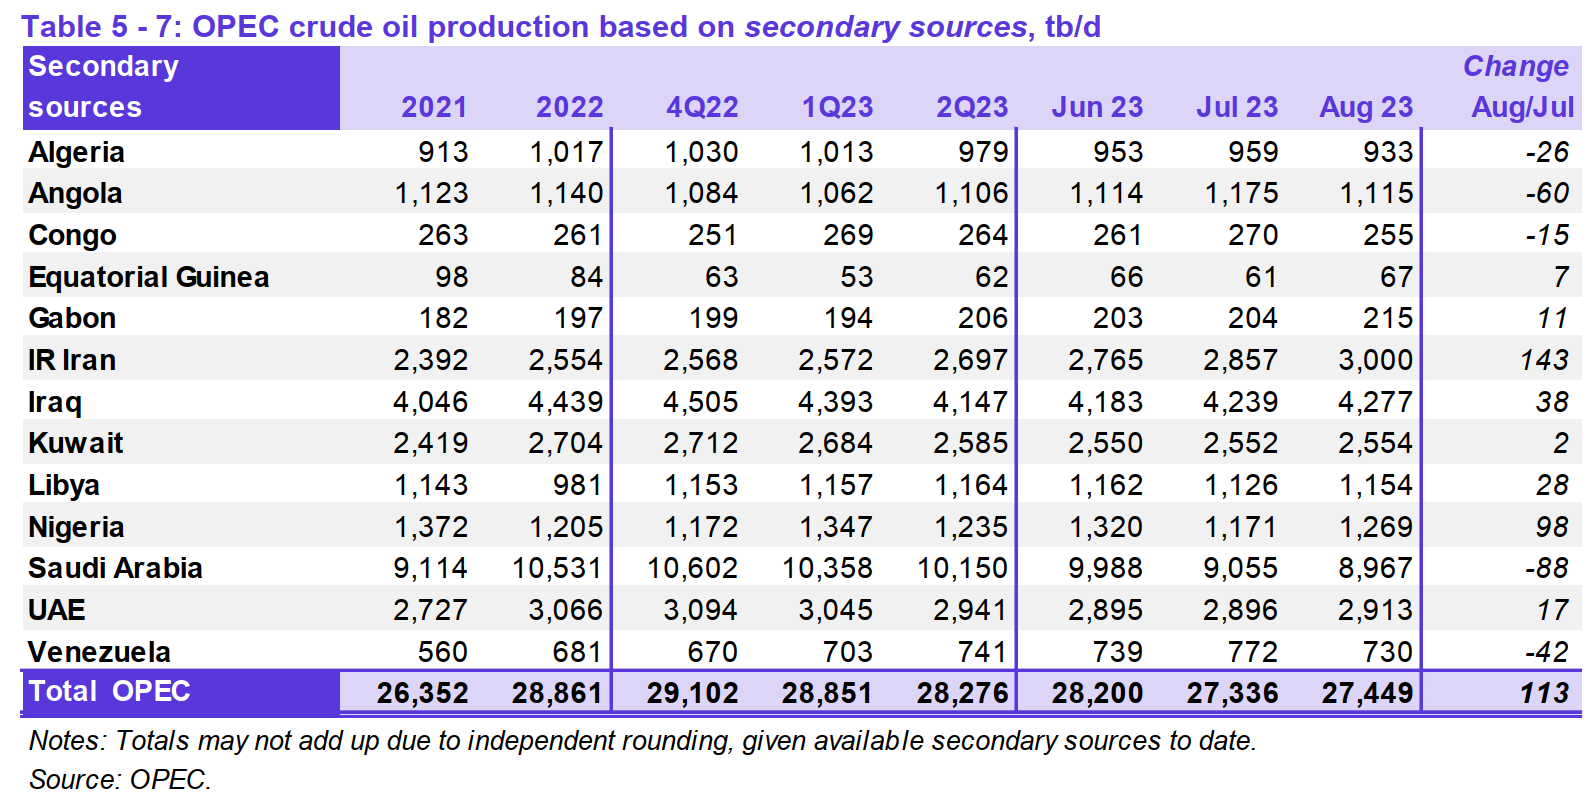
On the supply side, although Saudi Arabia voluntarily cut production, it was mainly affected by the increase in production in Iran and Nigeria. In August, the 13 OPEC member countries produced an average of 27.45 million barrels of crude oil per day in the current quarter, an increase of 113,000 barrels per day from the previous month.
Non-OPEC liquid petroleum production is expected to increase by 1.58 million barrels per day year-on-year in 2023, with the main increases coming from the United States and Brazil