Macro Report (7.24): Technology Plunges, Small Caps Unsettled, Retail Investors Extremely Optimistic



Stocks
Last week, the US stock market saw a small increase, with the Nasdaq performing poorly and earnings reports being mixed. Most large banks achieved excellent performance, leading some analysts to believe that this may indicate overall economic strength, with regional banks showing more divergence. Technology stocks saw fluctuations in earnings, leading to a decline in some major stocks, while earnings for large airlines were better than expected. Utilities, energy, and healthcare were the best-performing sectors this week, while communication services and industrials were the worst-performing sectors. Overall, the market last week leaned more towards defensive stocks.
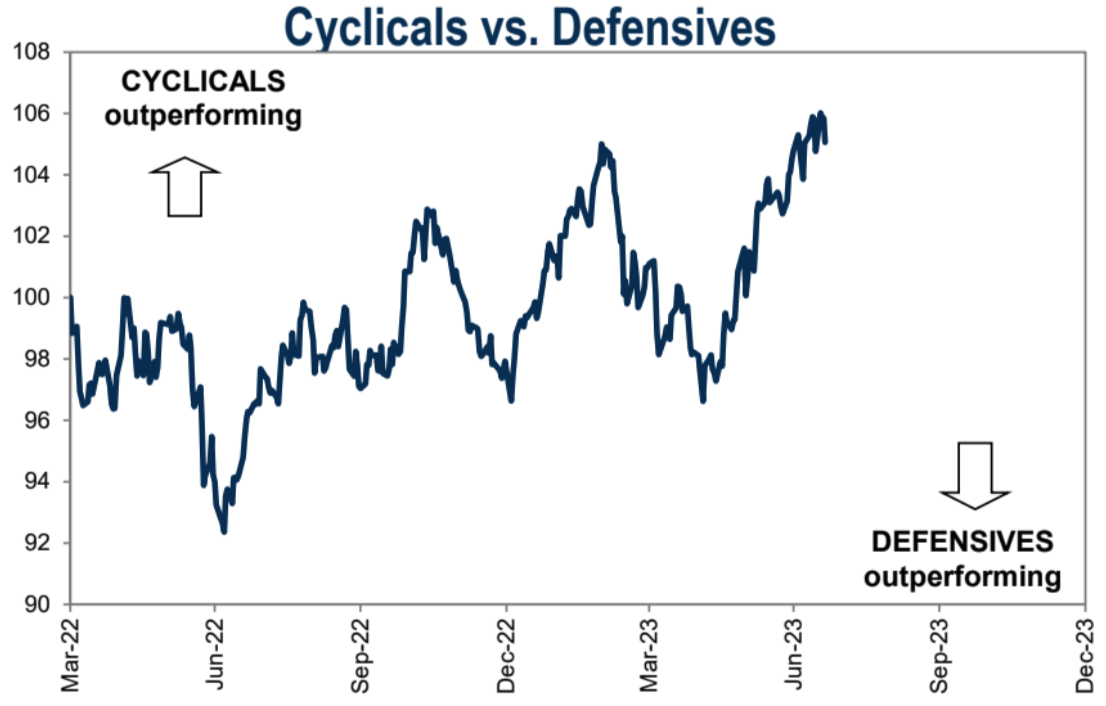
Although the Nasdaq index, dominated by technology stocks, has been strong for most of this year, it experienced its largest single-day decline in four months on Thursday of last week. Disappointing earnings data from important companies like Tesla and Netflix led to a decline of over 2% in the index on that day, highlighting the vulnerability of overvalued technology stocks. In other markets, European stocks, British stocks, and Japanese stocks all closed higher, while A-shares and Hong Kong stocks declined.
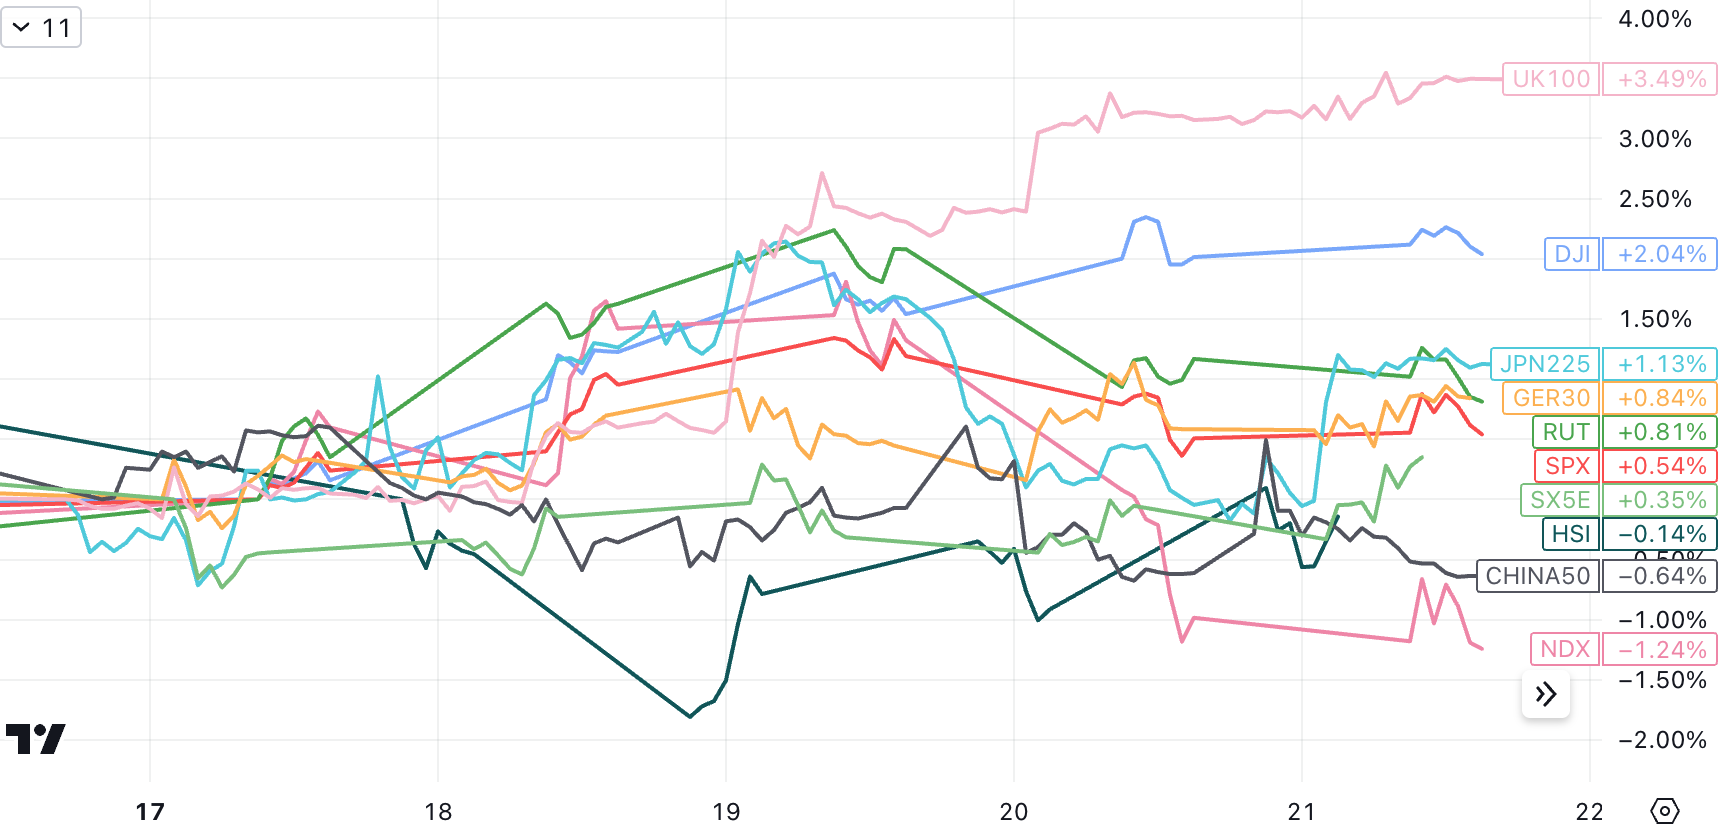
The significant rise in the US stock market since May has been largely driven by optimism about the Goldilocks scenario, where the economic conditions are neither too hot to prevent further inflation decline nor too cold to fall into a recession. The current corporate profits can also support this expectation.
It is worth noting that small-cap stocks have risen nearly 7% in less than three weeks, which is undoubtedly a response to the reduced cost pressure and vibrant economy. The continued strong performance of small-cap stocks is an important signal of economic recovery expectations, as smaller companies are typically more sensitive to domestic economic conditions and often perform poorly before and during an economic recession. However, as the economic outlook improves, their performance is outstanding.
The small-cap stocks, as measured by the Russell 2000 index, have had less of a rebound since hitting bottom in October last year compared to large-cap stocks. The Russell 2000 index is still nearly 18% below its peak in 2021, while the S&P 500 and Nasdaq 100 are only about 5% away from their historical highs in 2021.
The geopolitical situation between Russia and Ukraine has become more tense, and international crude oil, which has already received support from Saudi Arabia and Russia's production cuts, continues to rise.
Hello, recently there has been a rising trend for the past month, pulling away from precious metals and industrial metals: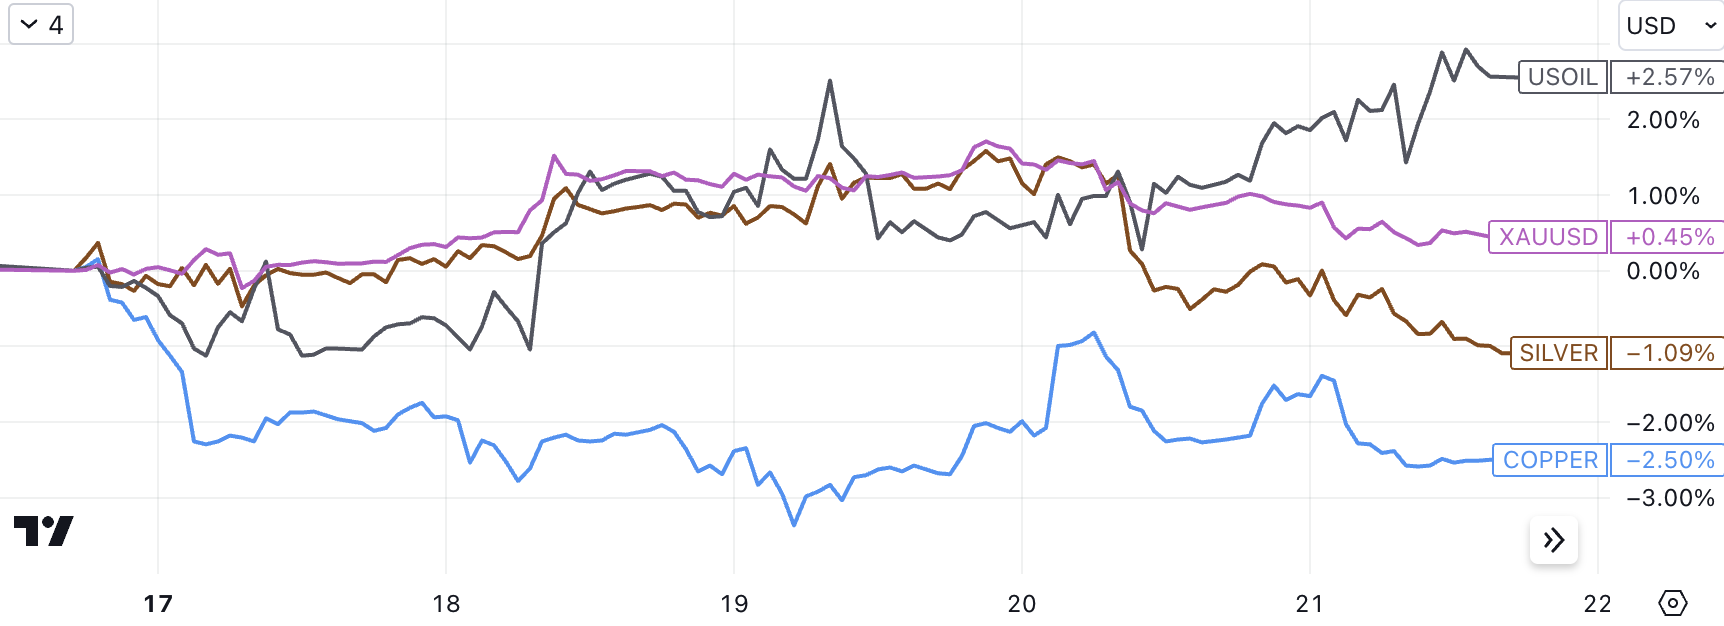
Cryptocurrency
Last week, actual interest rates rebounded slightly, along with the exchange rate of the US dollar. The rebound mainly occurred on Friday, and both gold and BTC were suppressed:
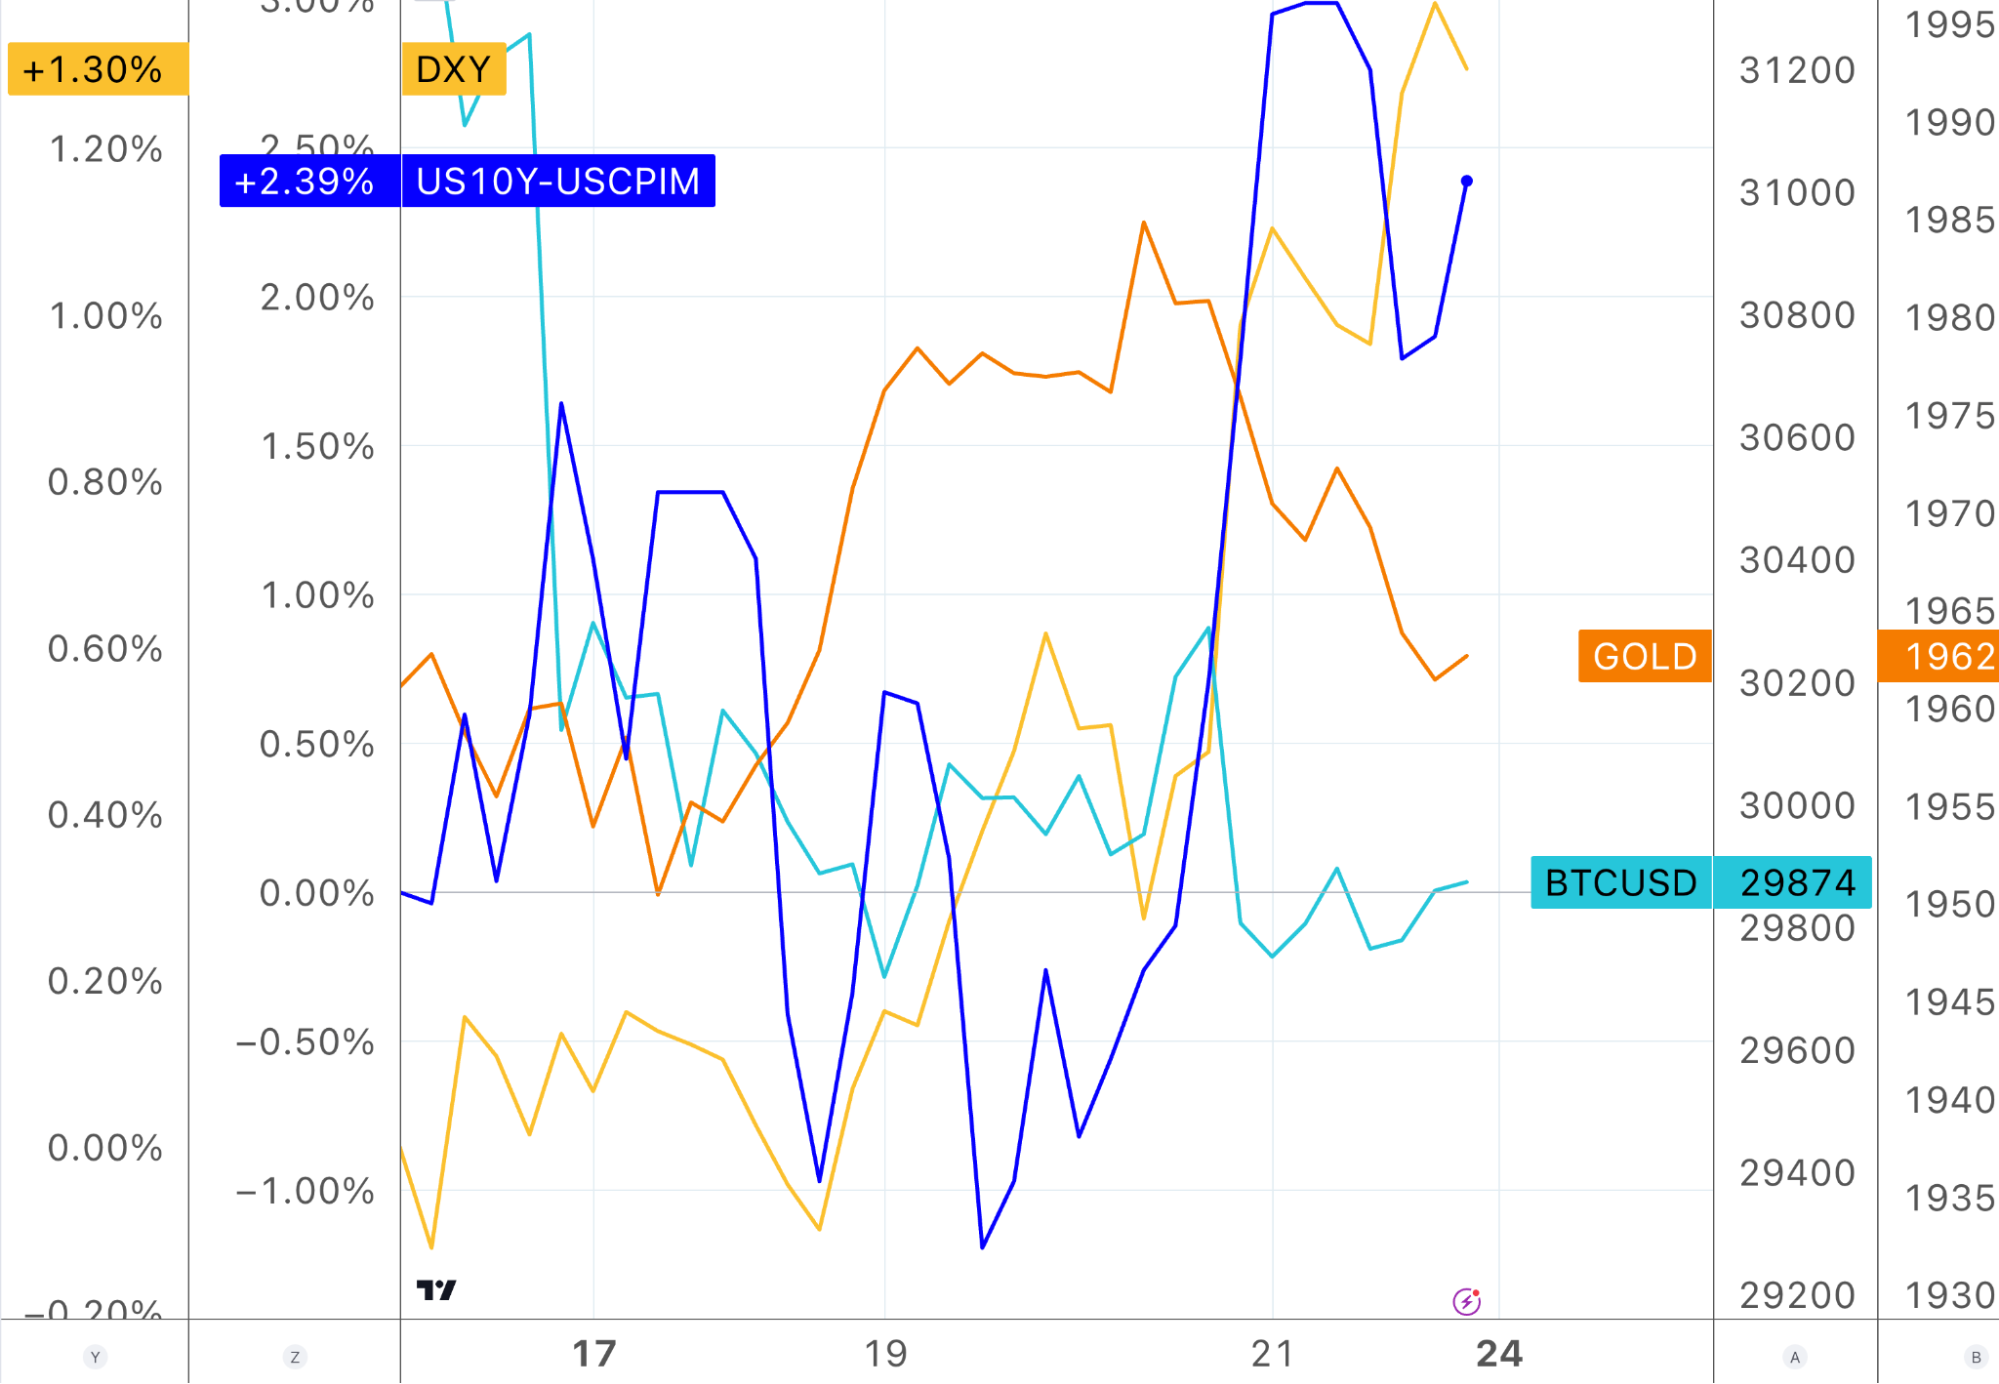
The US dollar index fell by 2.2% the previous week and fell below the 100 level, but rebounded strongly by over 1% last week, rising from a 15-month low and recovering nearly half of July's decline, marking the largest weekly gain in nearly three months. Mainly due to strong US resident demand + lower than expected core inflation in Japan. At the same time, the continued uncertainty surrounding whether the Bank of Japan will adjust its Yield Curve Control (YCC) policy has put pressure on the yen. On Friday, there were reports that the Bank of Japan is unlikely to change its YCC plan, and the yen fell in response, further boosting the US dollar.
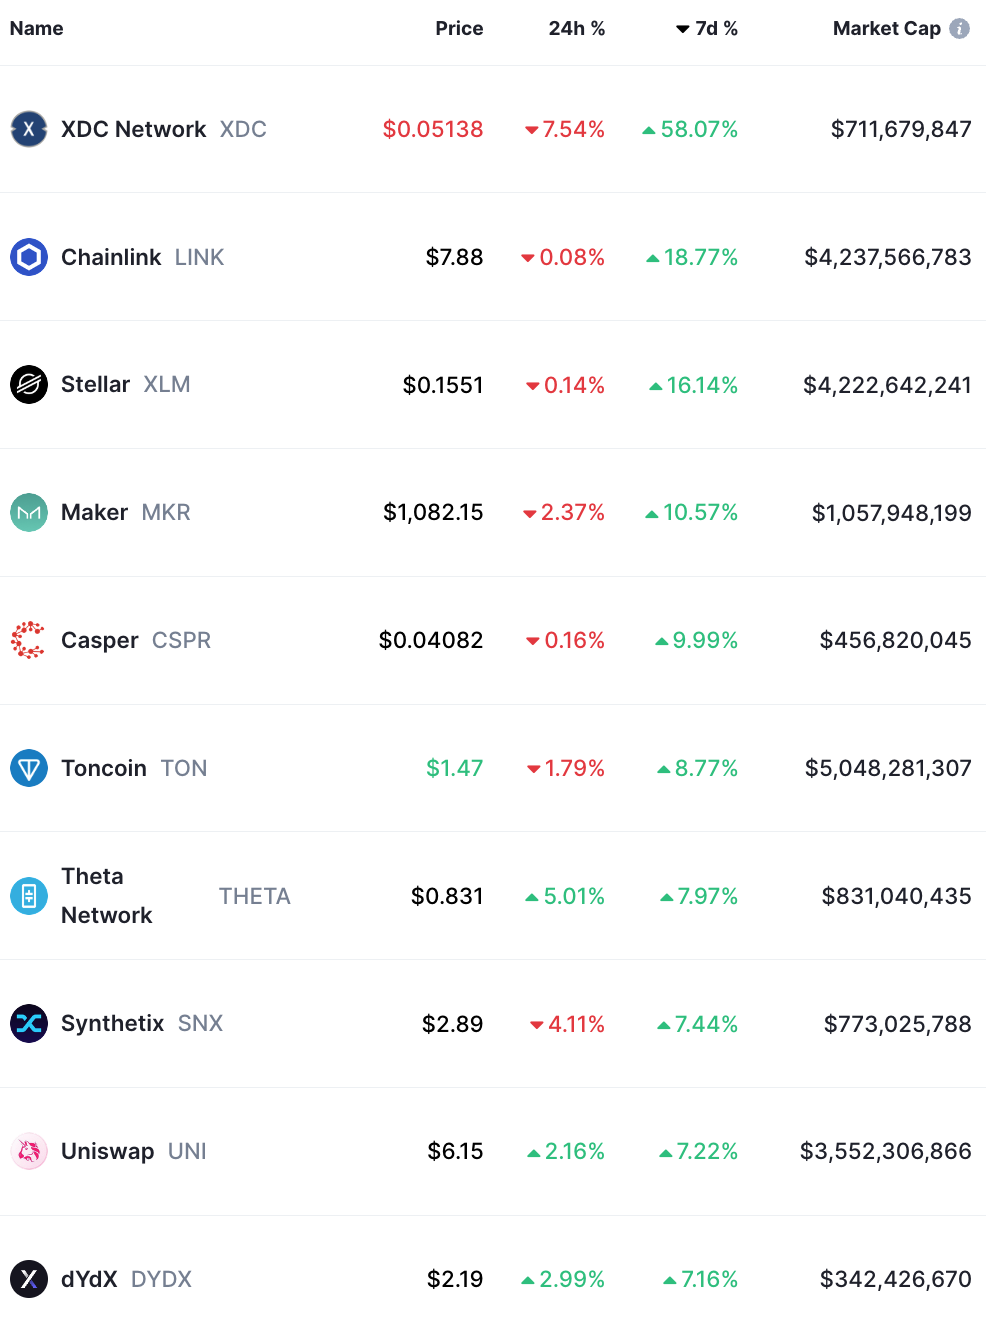
Top 100 token performance:
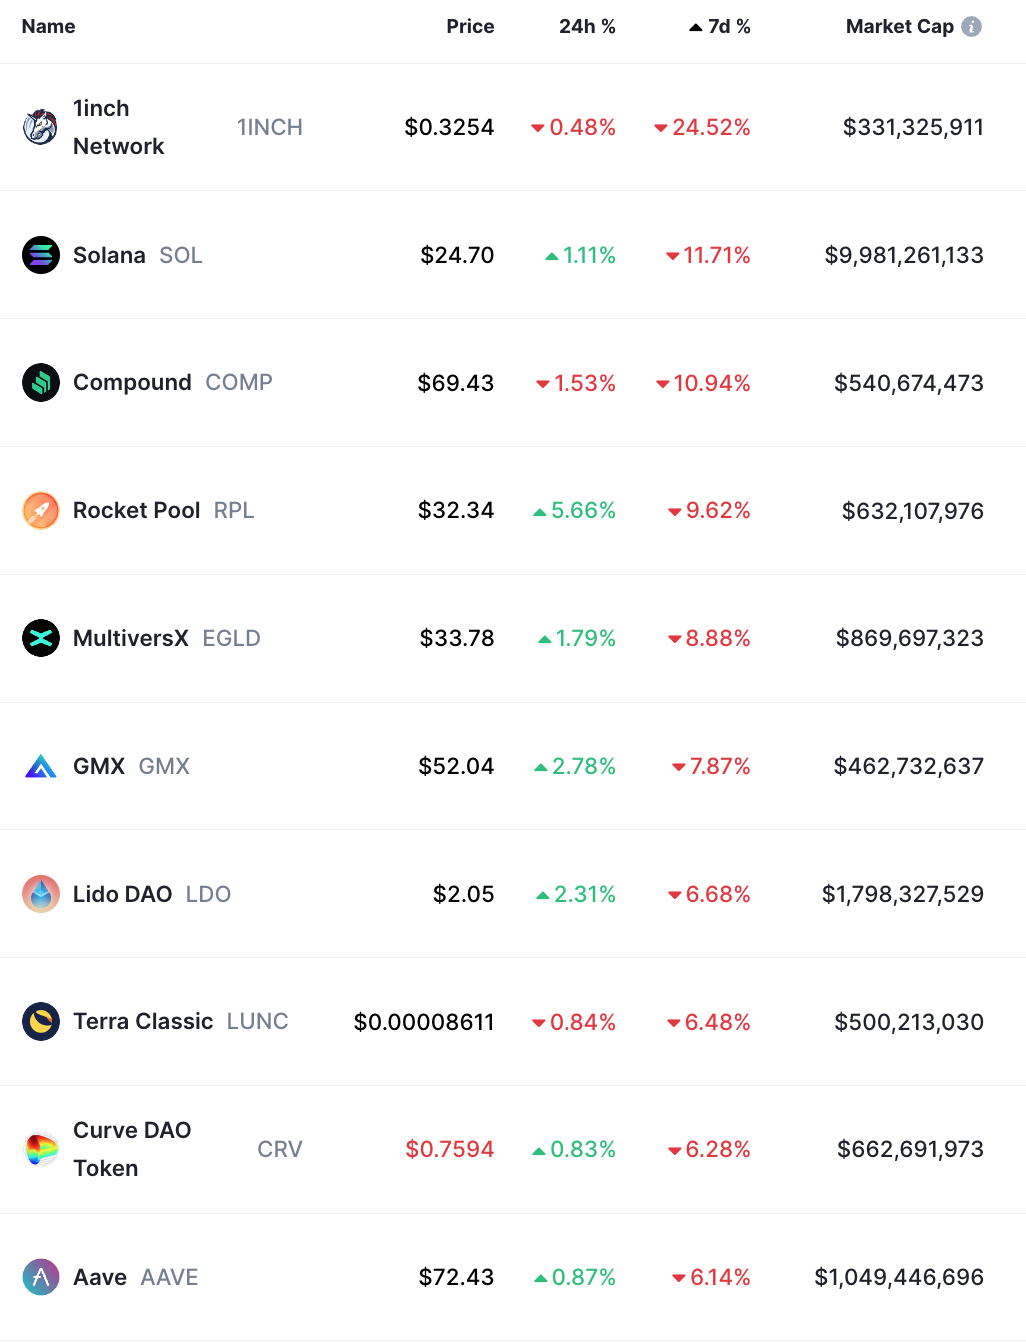
Top 100 tokens market cap decline:
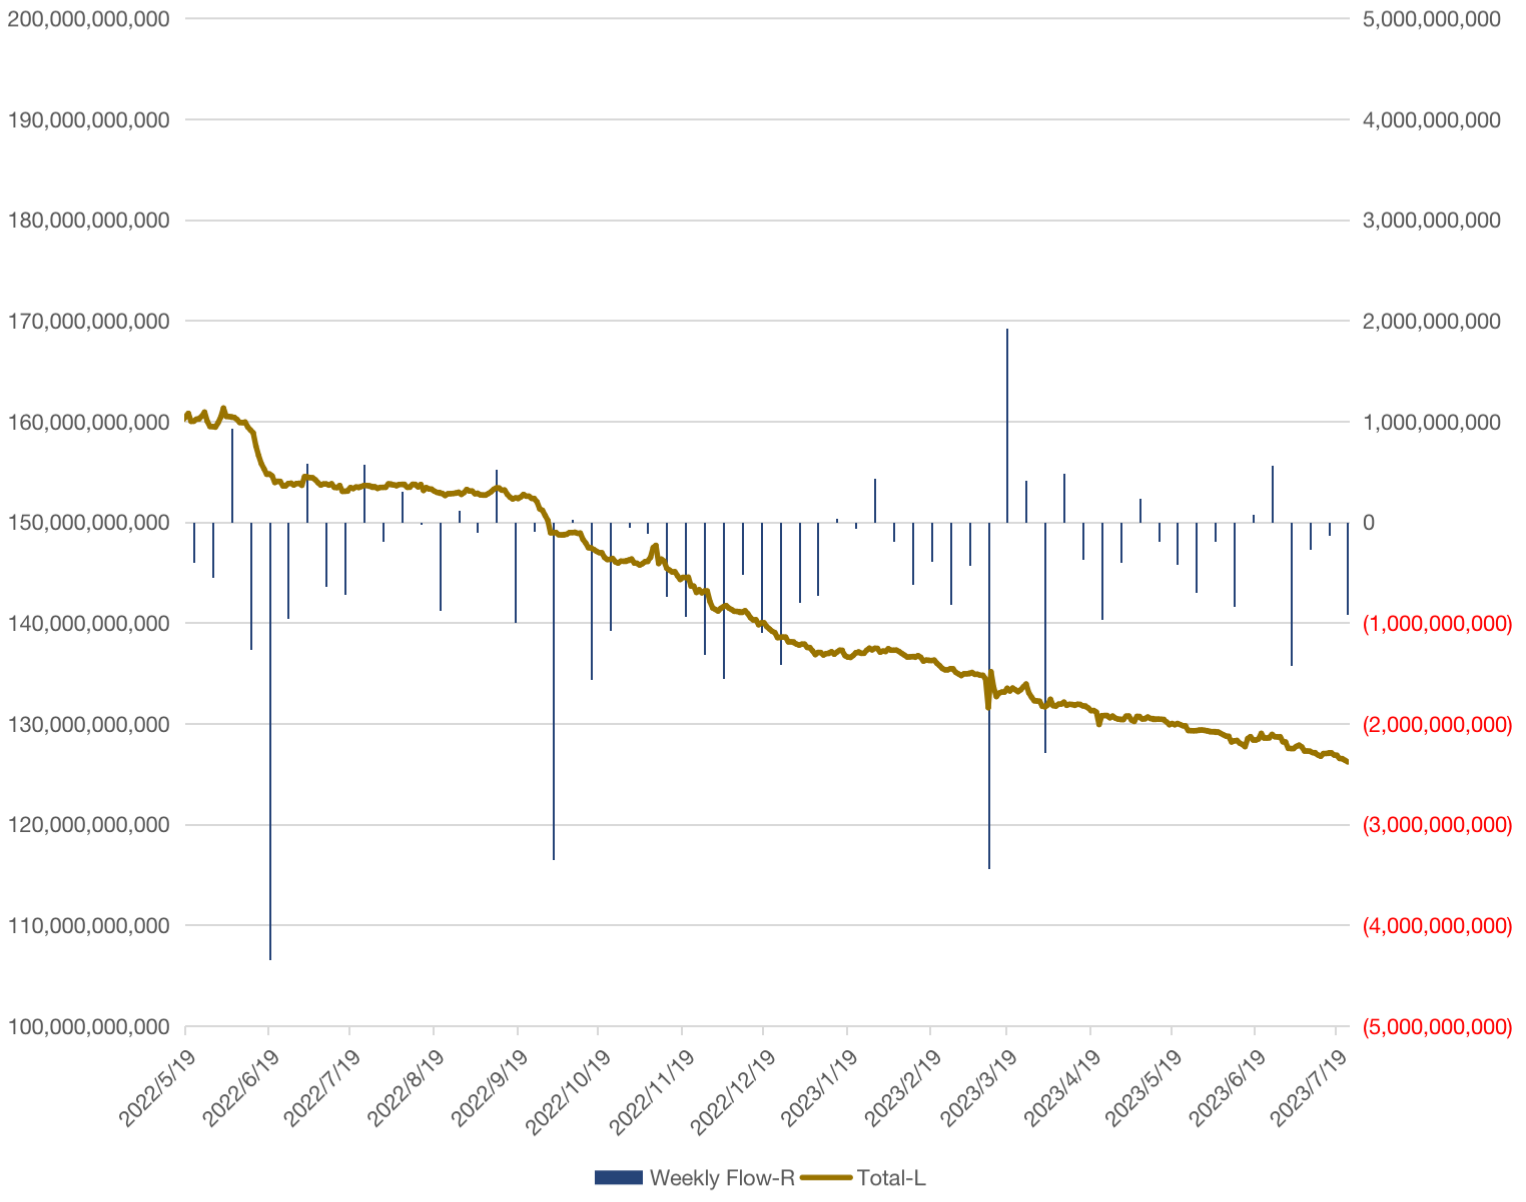
Total on-chain stablecoin supply decreases from $127.06 billion to $126.19 billion, continuous outflow for the fourth consecutive week, with a weekly decline of 0.72%:
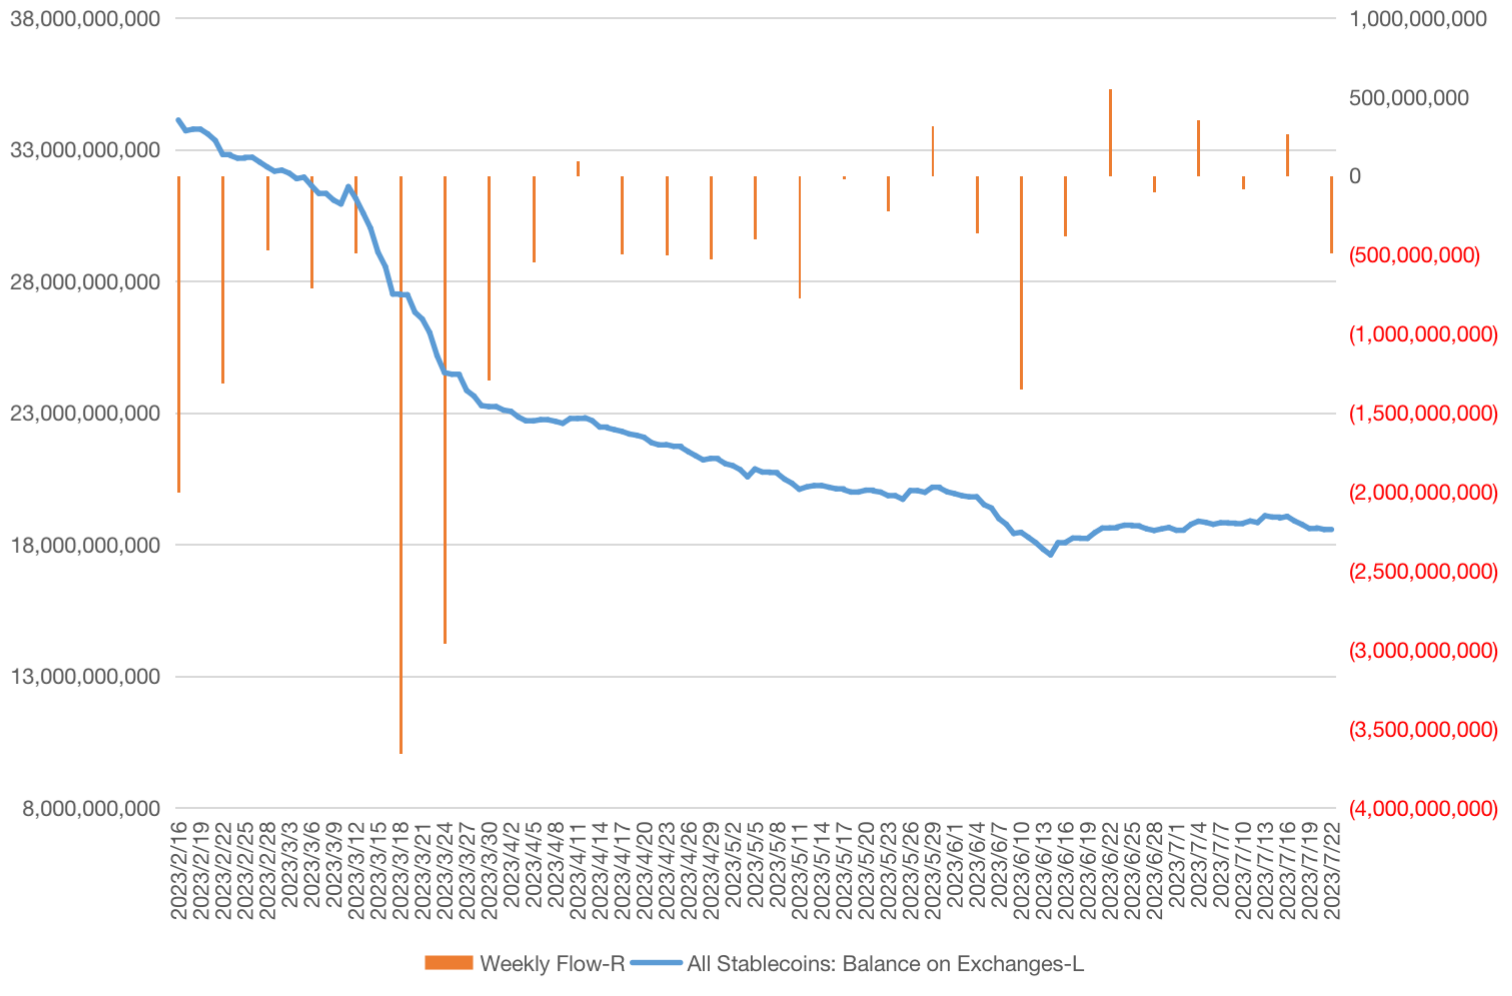
Centralized exchange stablecoin balance decreased from $19.06 billion to $18.56 billion, the largest decline in 8 weeks:
Fund Flow and Position
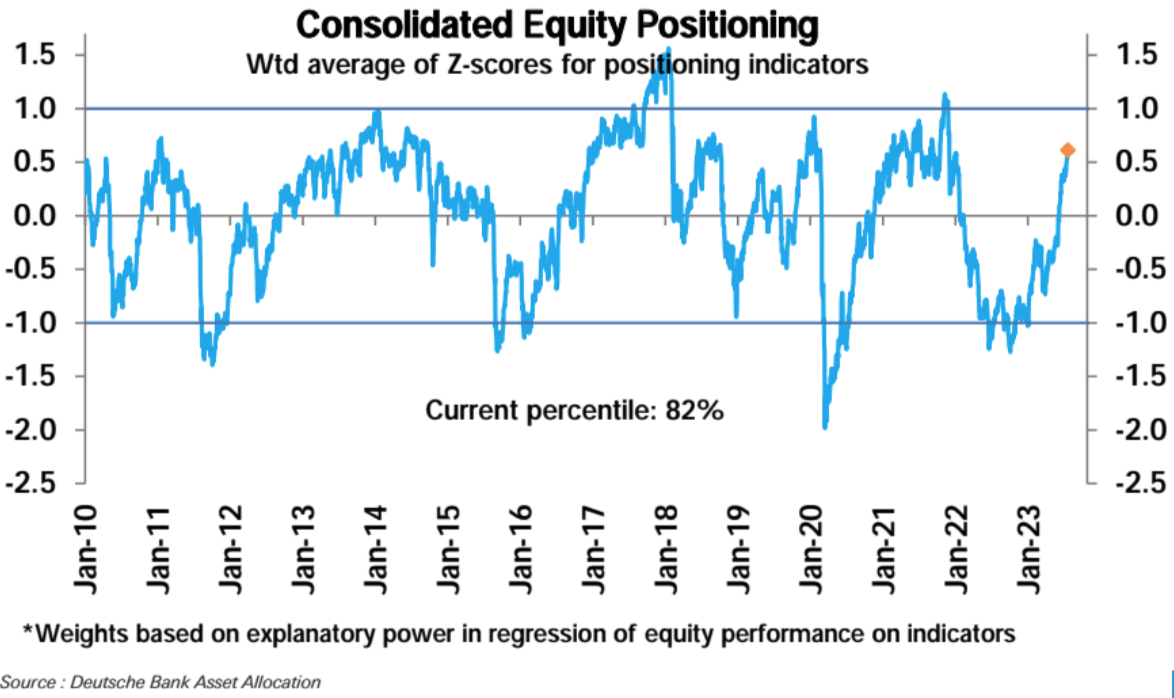
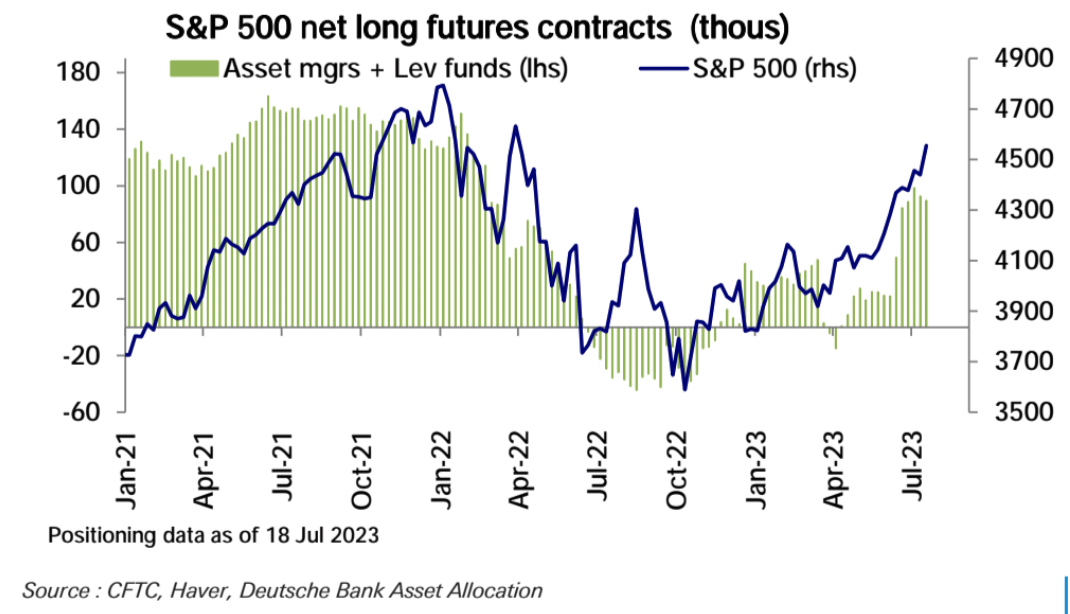
According to Deutsche Bank's statistical data, the overall stock position increased further last week and is now at a relatively high level (z score 0.61, 82nd percentile):
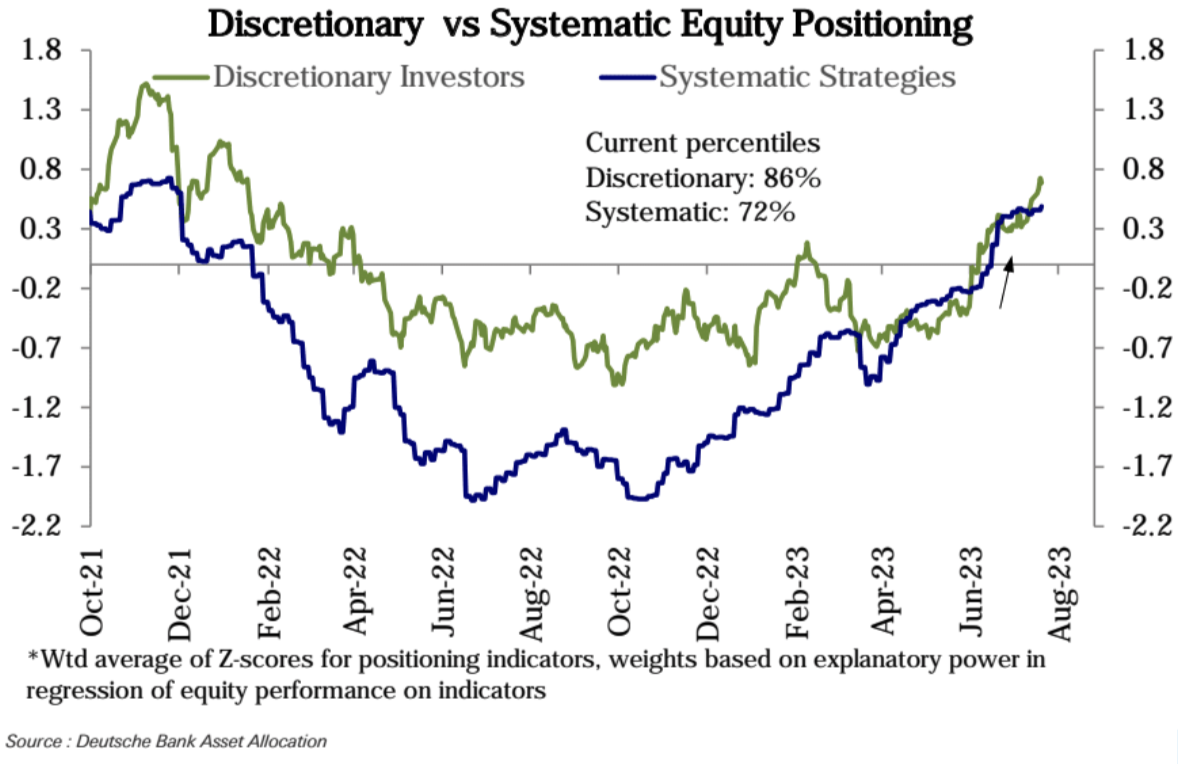
This is mainly due to the significant increase in subjective investors' positions (z score 0.69, 86th percentile), which, although reaching a high level, is still below the peak of the previous cycle. However, it is also observed that the positions of systematic strategy funds have remained flat (z score 0.49, 72nd percentile):
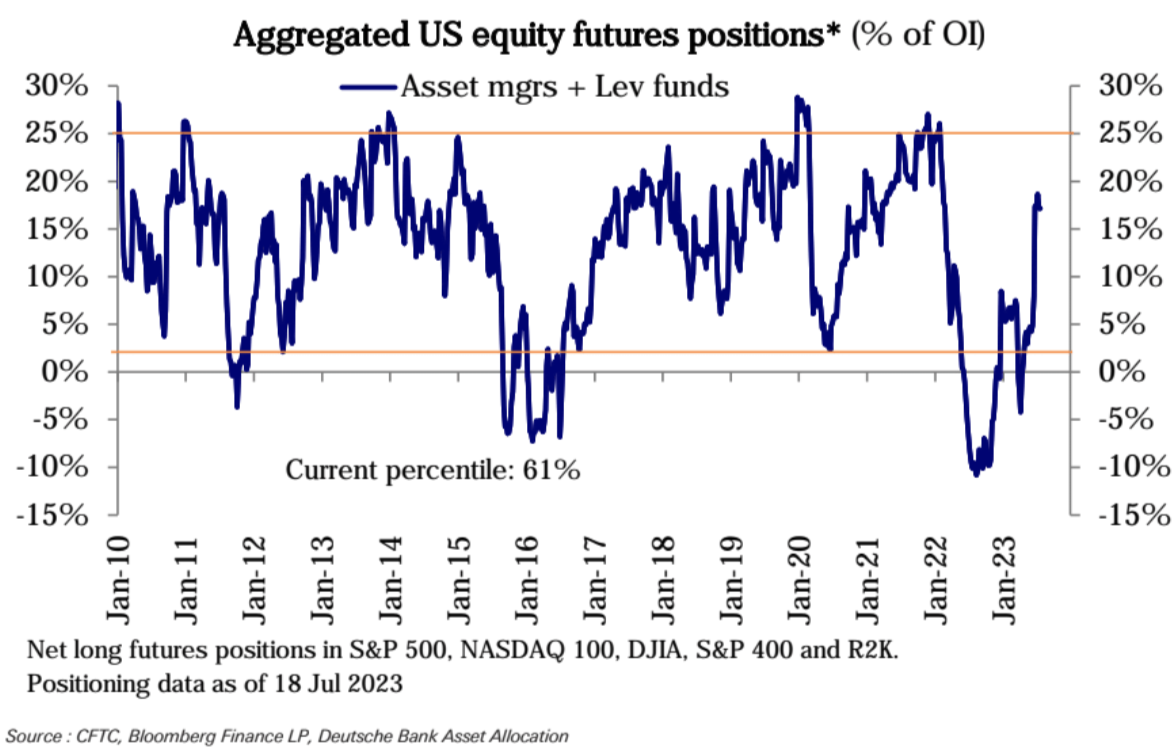
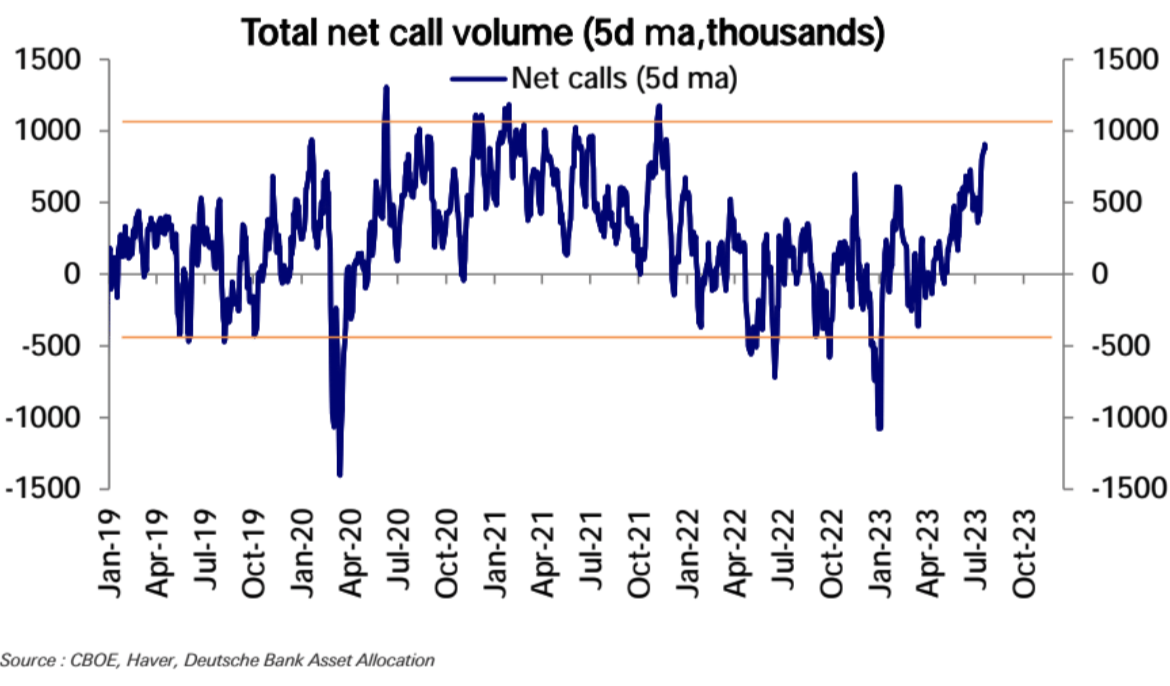
Some indicators are approaching their historical highs. Specifically, the position of systematic strategy that has driven the upward trend in the past five months is now relatively high; futures are close to the upper range of their historical levels; the difference in long and short sentiment has reached the top 10% historically; short positions have significantly reduced, and the trading volume of net bullish options has risen to the level of 2021, mainly driven by small trades.
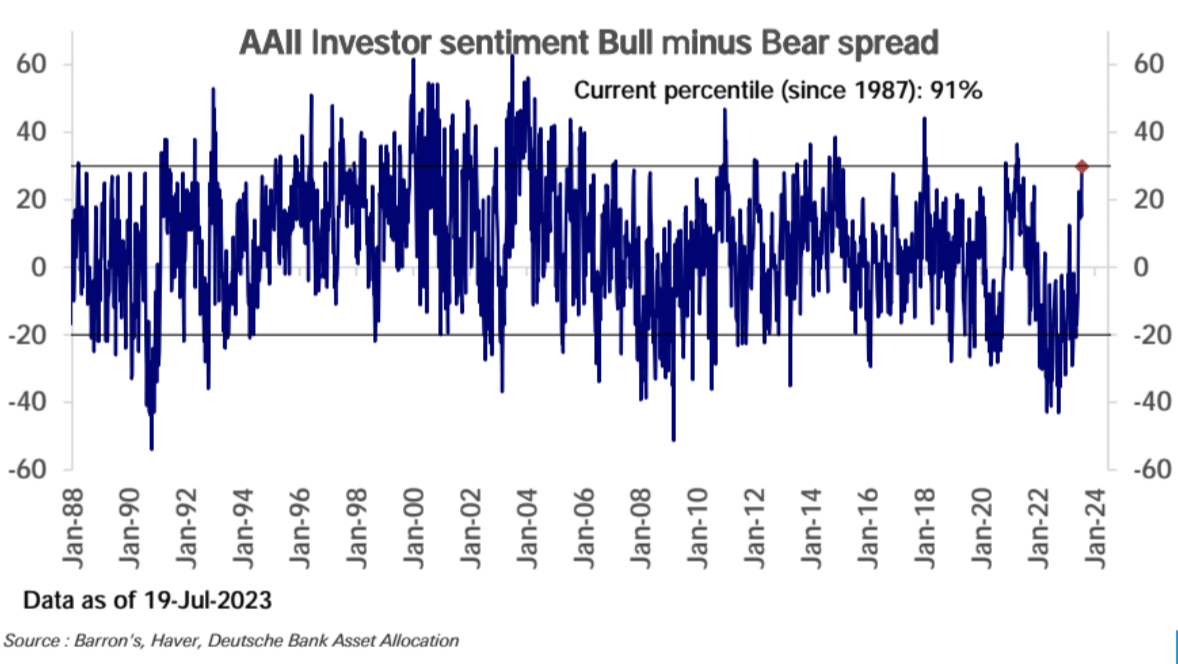
AAII bullish and bearish sentiment differential has reached historical top 10% level:
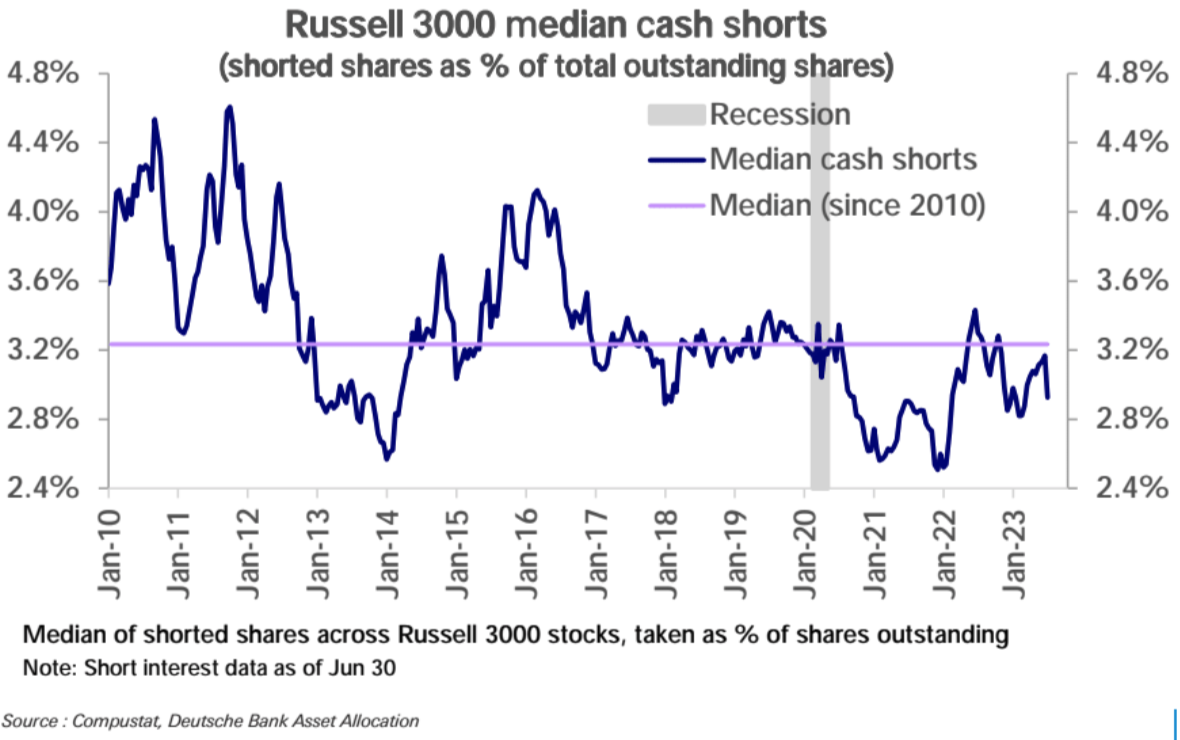
Net call option trading volume (purchased options minus sold options) rose sharply to the 97th percentile in history, individual stock option trading volume surged to a 20-month high:
Has the position of subjective investors relative to the fundamentals been excessive? It depends on which cyclical indicator you look at. It is certainly much higher than levels suggested by popular indicators like ISM or LEI that have been declining, but it is in line with several other indicators that have started to rebound: macro data surprises, hard data indicators such as manufacturing industrial production and retail sales, and earnings revisions. We continue to see a similar situation in 2019, when subjective investors chased the rise led by systematic strategies and the position levels were overstretched before the fundamentals became clearly positive.
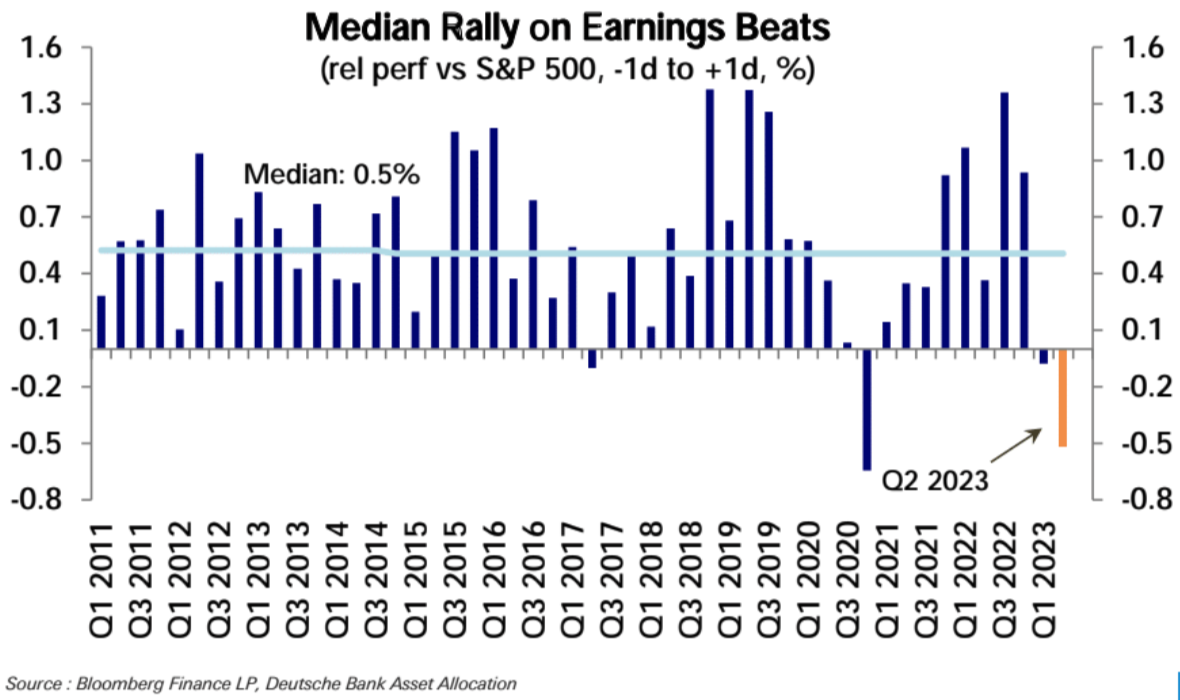
For the Q2 earnings season, the market expects earnings to grow for the second consecutive quarter, but the price momentum may be weaker due to the high position. Preliminary results show that 80% of companies have exceeded expectations. However, since the start of the earnings season, the S&P 500 has only risen by 0.6% and the average of companies that beat expectations has actually declined by 0.5%. This price decline after beating expectations is an unusual trend, contrasting with typical historical patterns:
In terms of industry allocation, consumer daily necessities (87th percentile), communication services (84th percentile), and technology industry (80th percentile) have higher positions; consumer non-essential products industry (67th percentile) is slightly biased, with a recent rapid rise. The industrial sector (61st percentile) is slightly biased, and the energy sector has returned to neutrality. The financial industry (40th percentile) and the real estate industry (40th percentile) are still slightly underweight, but are rapidly approaching neutrality. Utilities (30th percentile) remain underweight and have not broken the trend, as is the case with the health care industry (26th percentile). The raw materials industry (26th percentile) remains underweight.
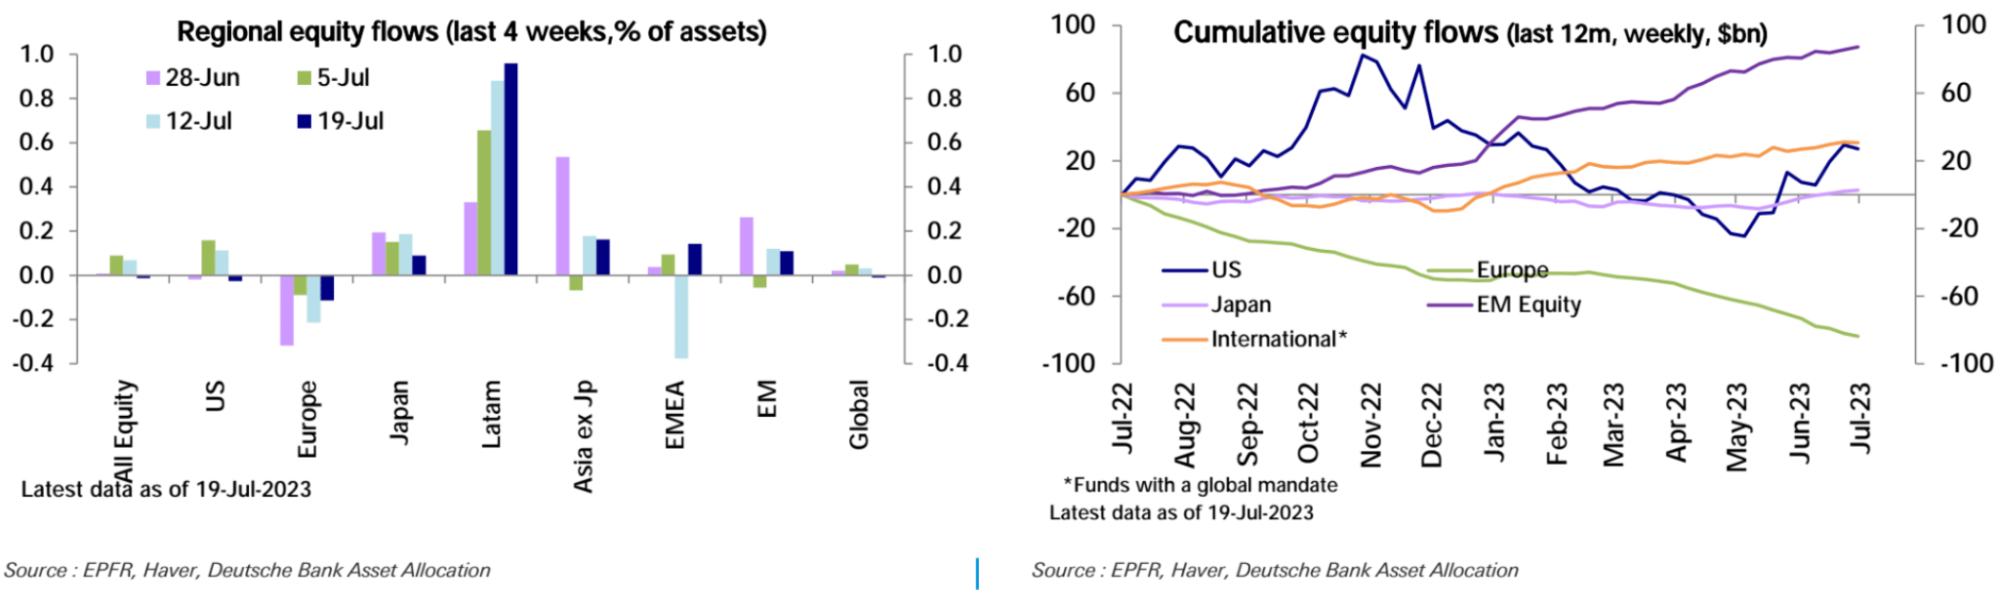
After three consecutive weeks of inflows, equity funds saw outflows last week (-2.1 billion USD). The outflows mainly came from the United States (-2.3 billion USD), while Europe (-1.6 billion USD) experienced redemptions for the 19th consecutive week. Emerging markets (1.7 billion USD) and Japan (0.6 billion USD) received inflows:
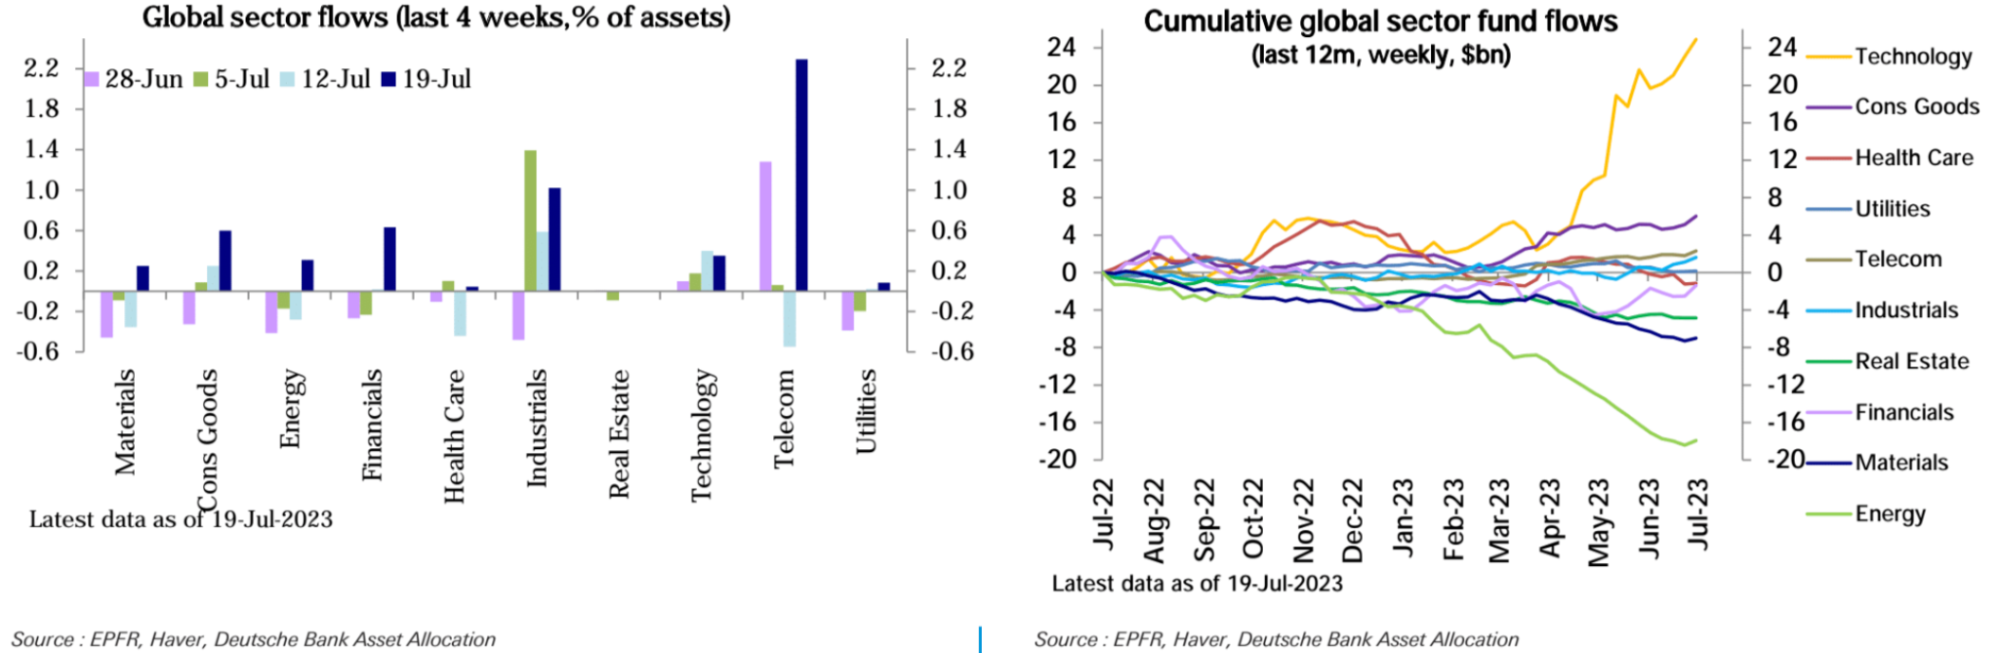
In terms of industries, the technology industry ($1.8 billion), the finance industry ($1.1 billion), and the consumer goods industry ($900 million) received a large influx of funds. Telecommunications, energy, and industrial sectors each received an influx of $500 million, while the materials industry received $300 million. There were no significant changes in other industries:
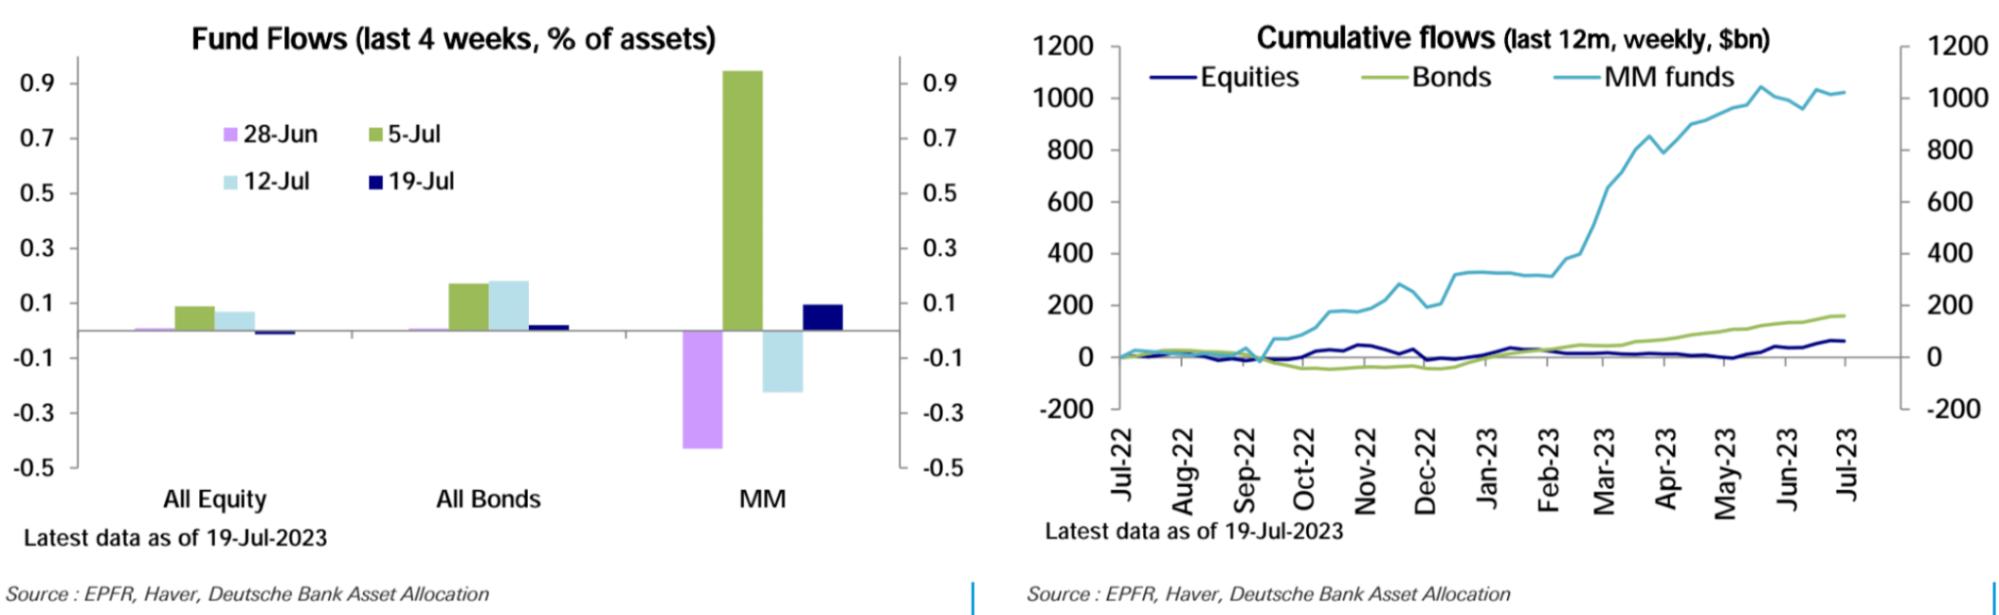
Bond funds experienced a significant slowdown in inflows this week ($1.4 billion), while money market funds received moderate inflows ($7.5 billion):
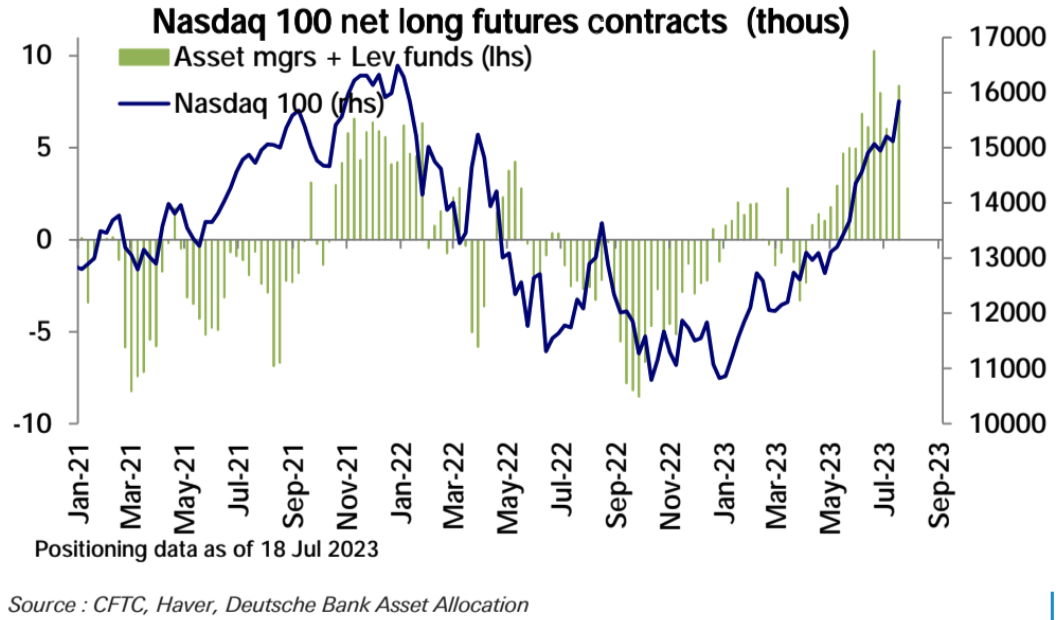
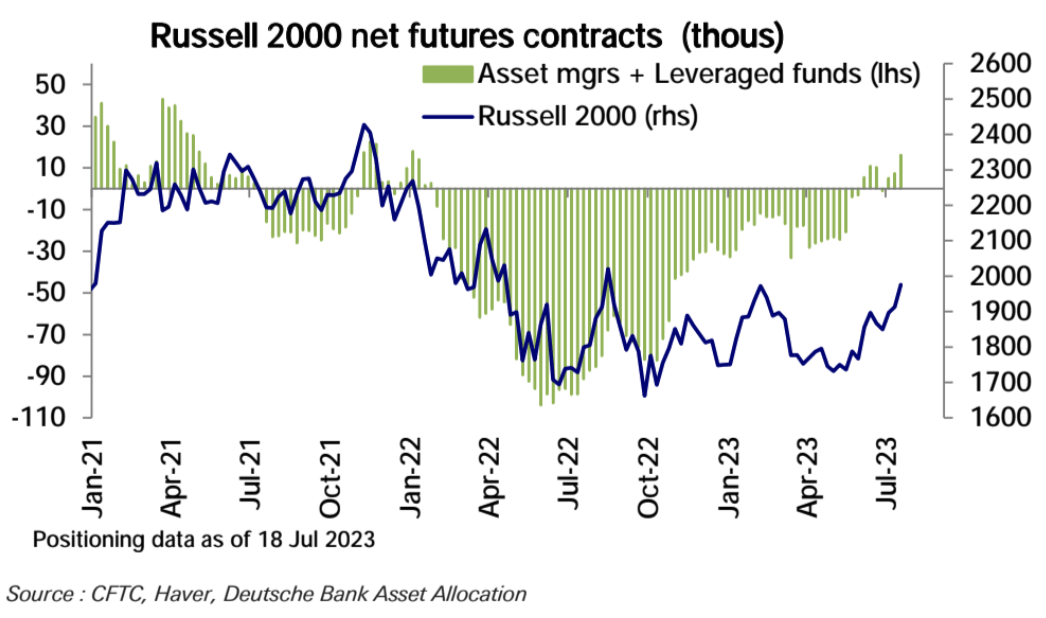
In the futures market, overall positions in US stock index futures remained stable, with the decrease in net long positions of the S&P 500 offset by the increase in net long positions of the Nasdaq 100 and the Russell 2000. Last week, the net long positions of the Russell 2000 reached a new high since January 2022:
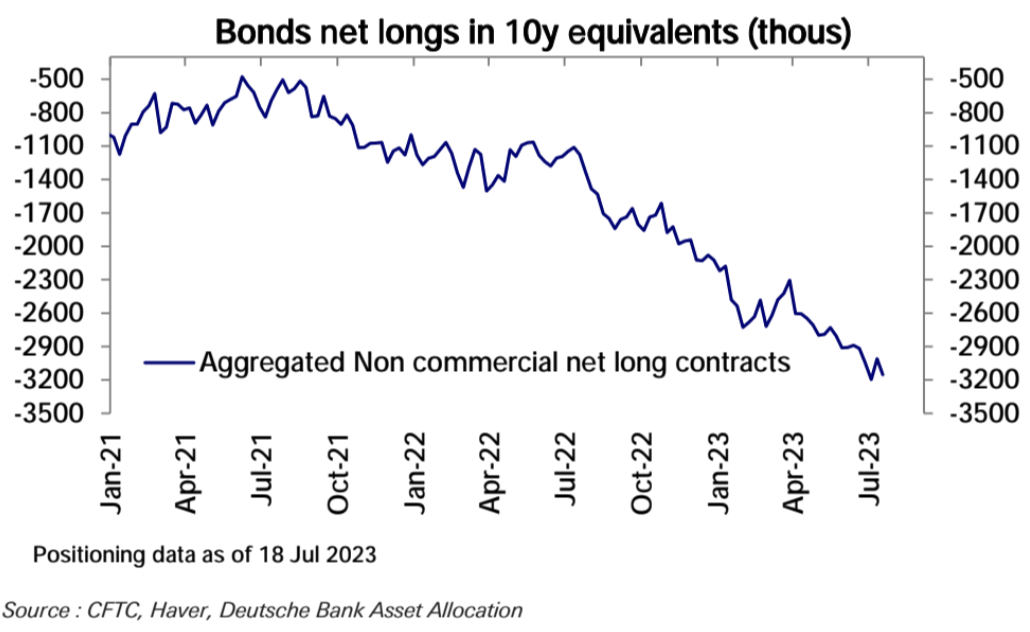
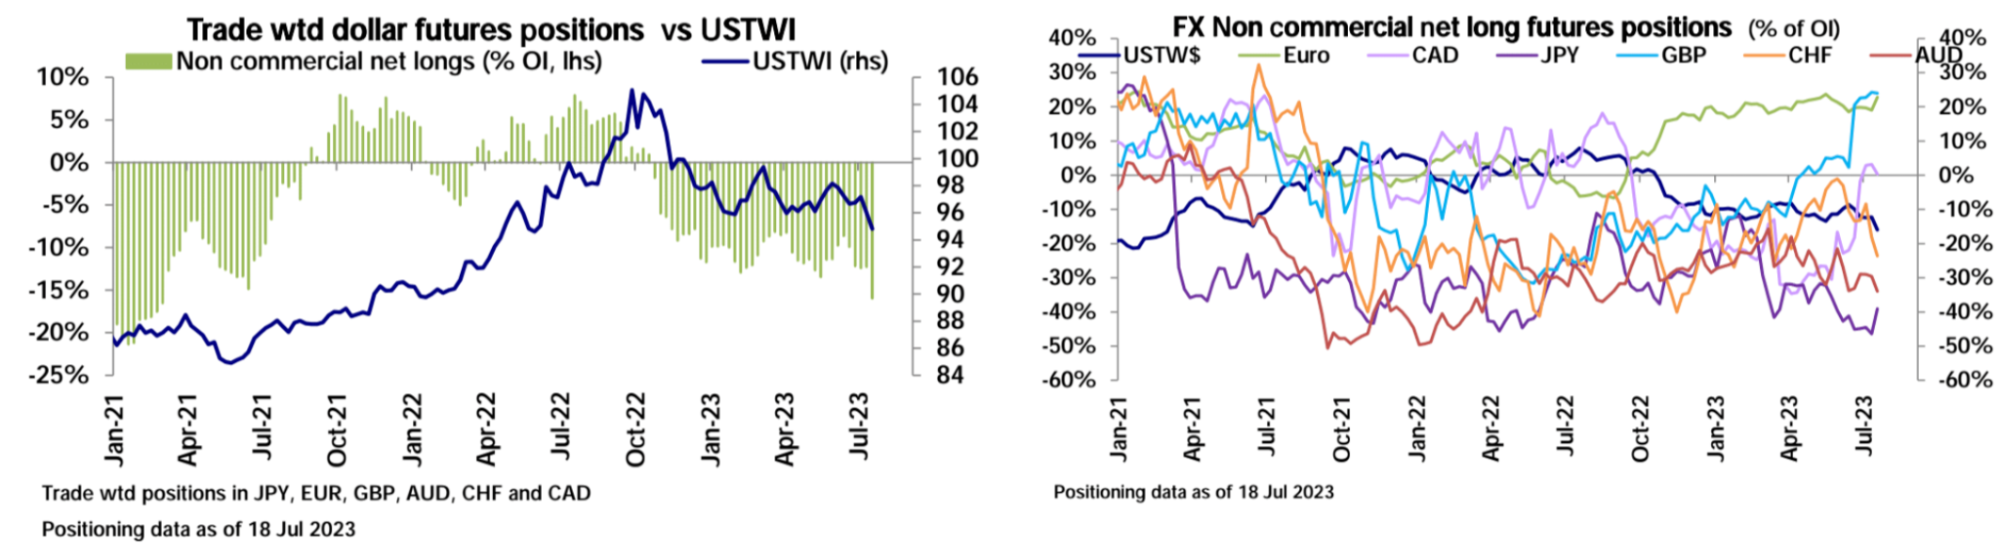
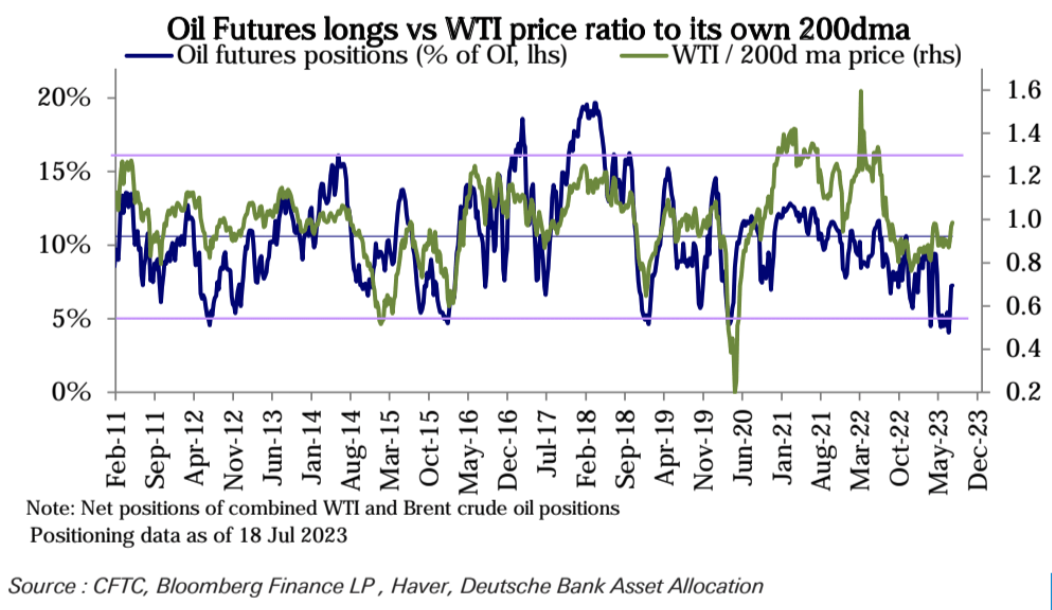
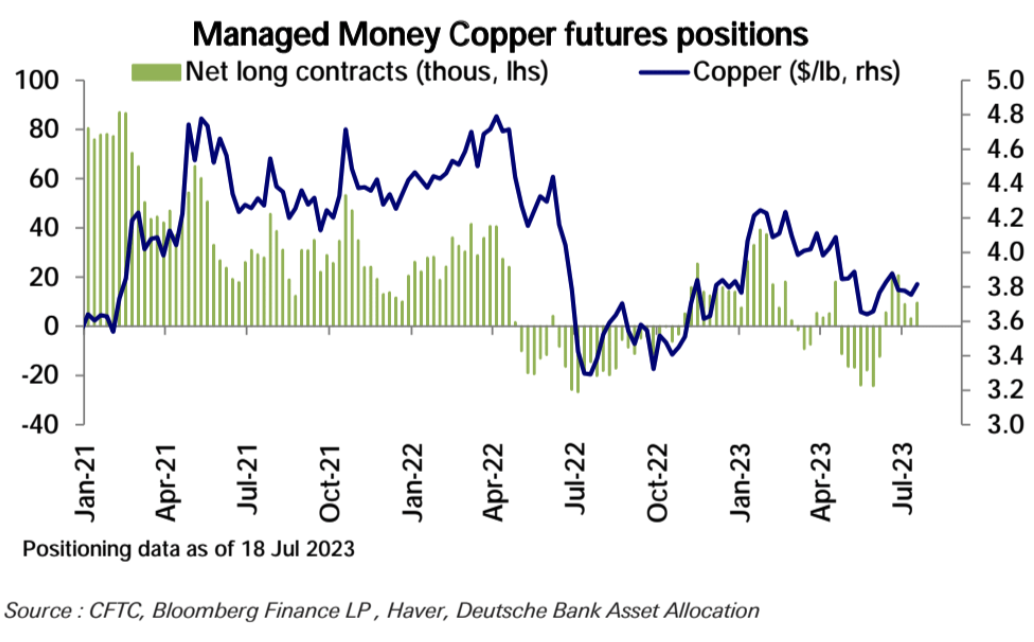
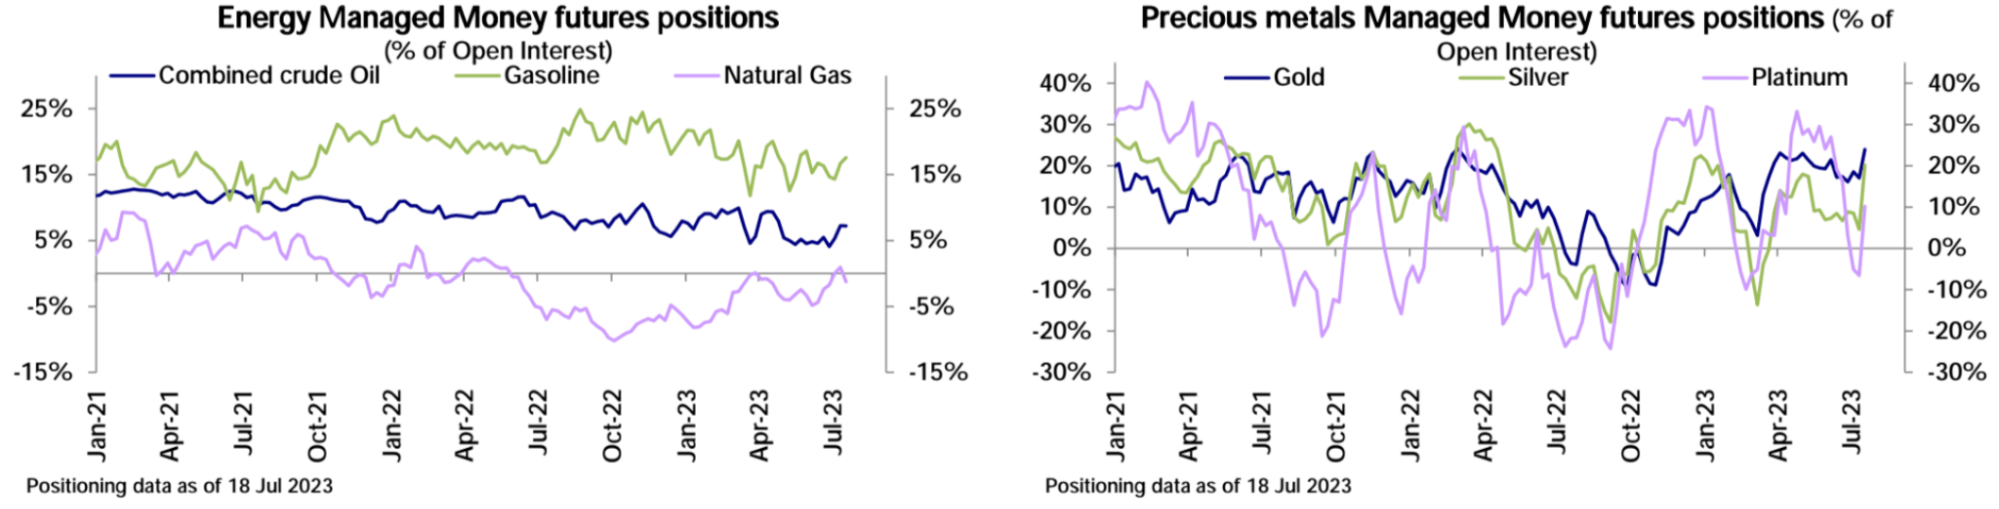
Overall bond net short positions increased but remained slightly below historical highs. The short positions in the US dollar have risen, net long positions in oil have remained stable, while net long positions in gold, silver, and copper have also increased.
Market Sentiment
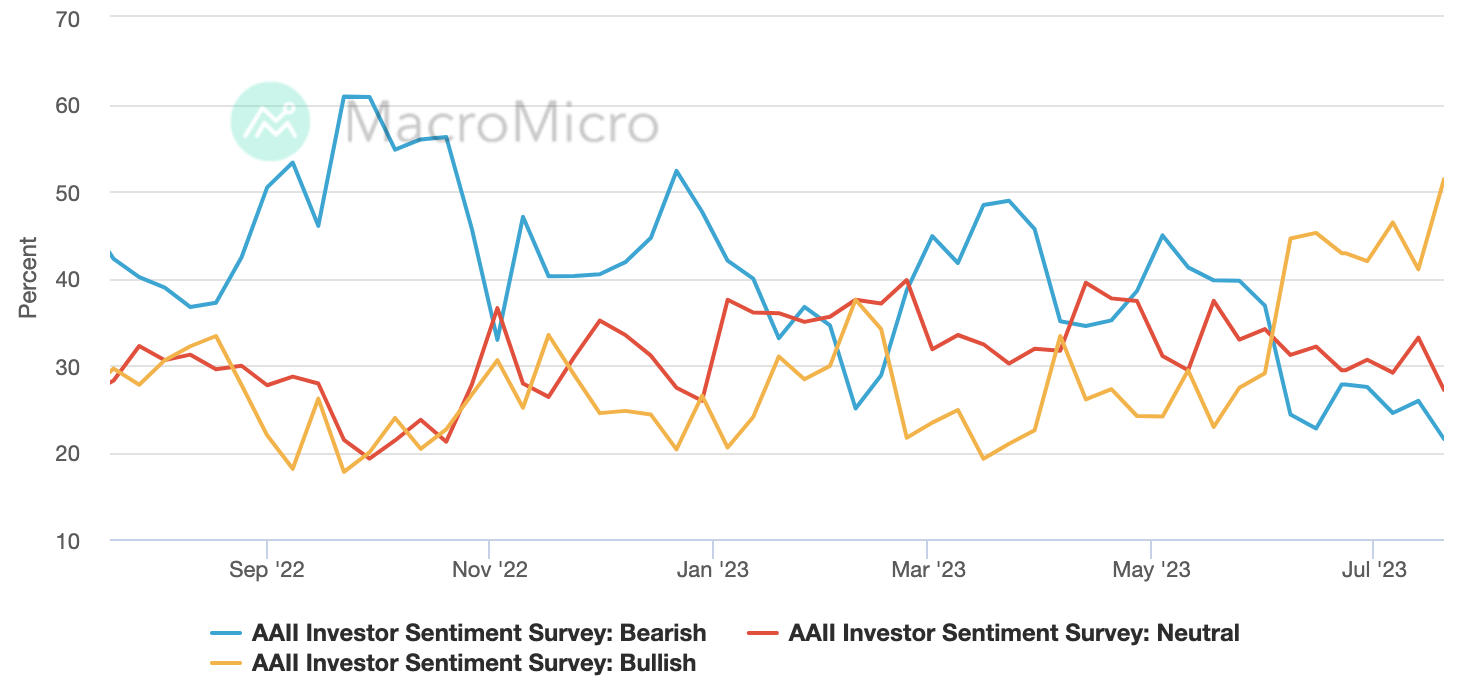
AAII Investor Survey, the percentage of bullish sentiment reached a new high since November 2021 at 51.36%, while the percentage of bearish sentiment reached a new low since June 2021 at 21.49%:
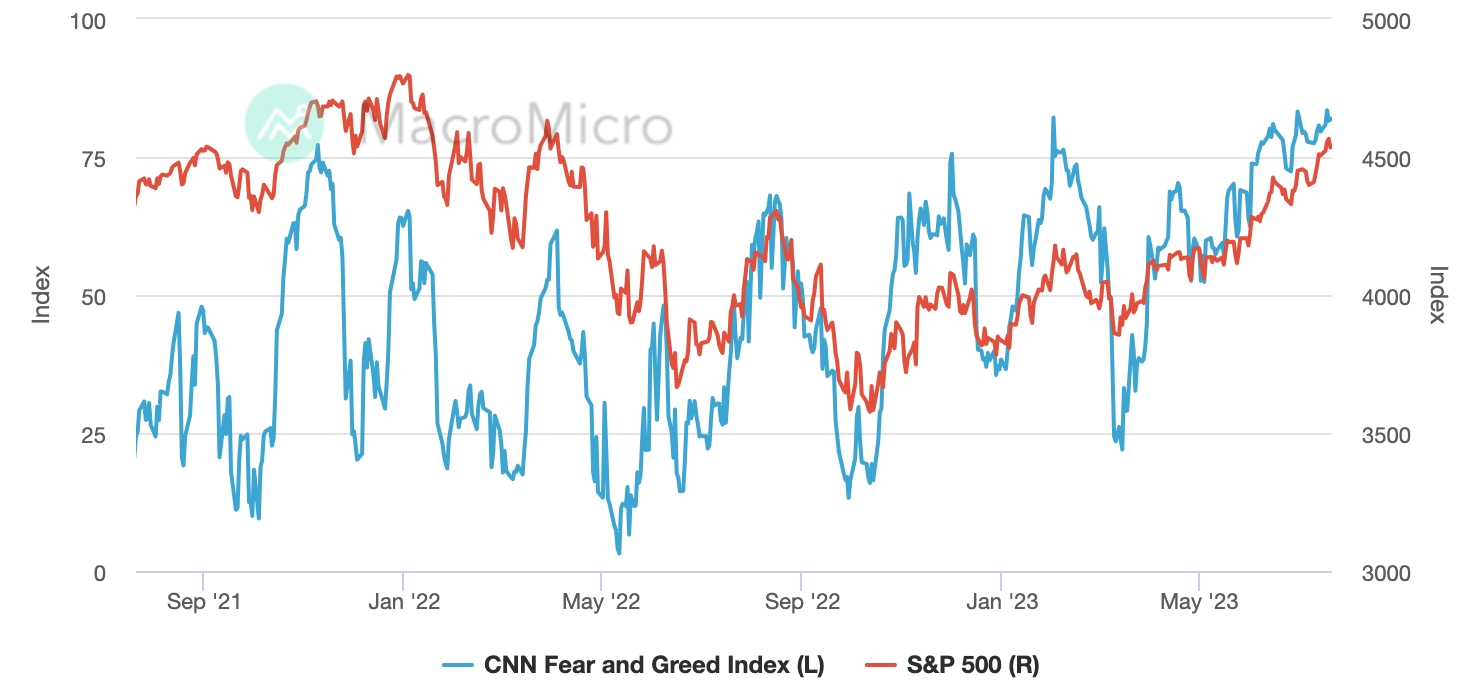
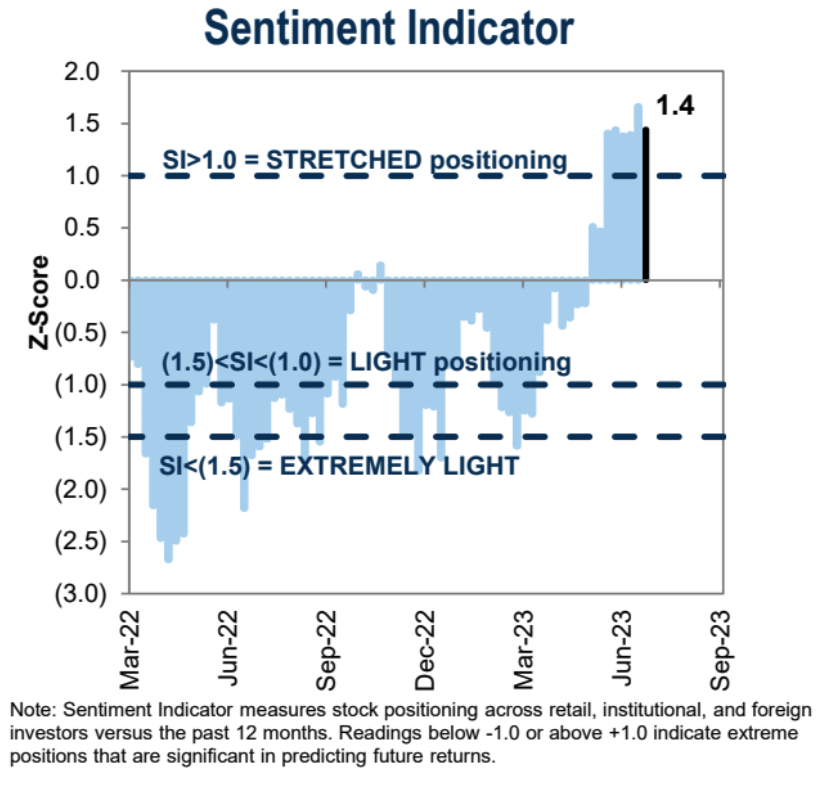
Goldman Sachs' sentiment indicator has remained at an extreme level for two consecutive months:
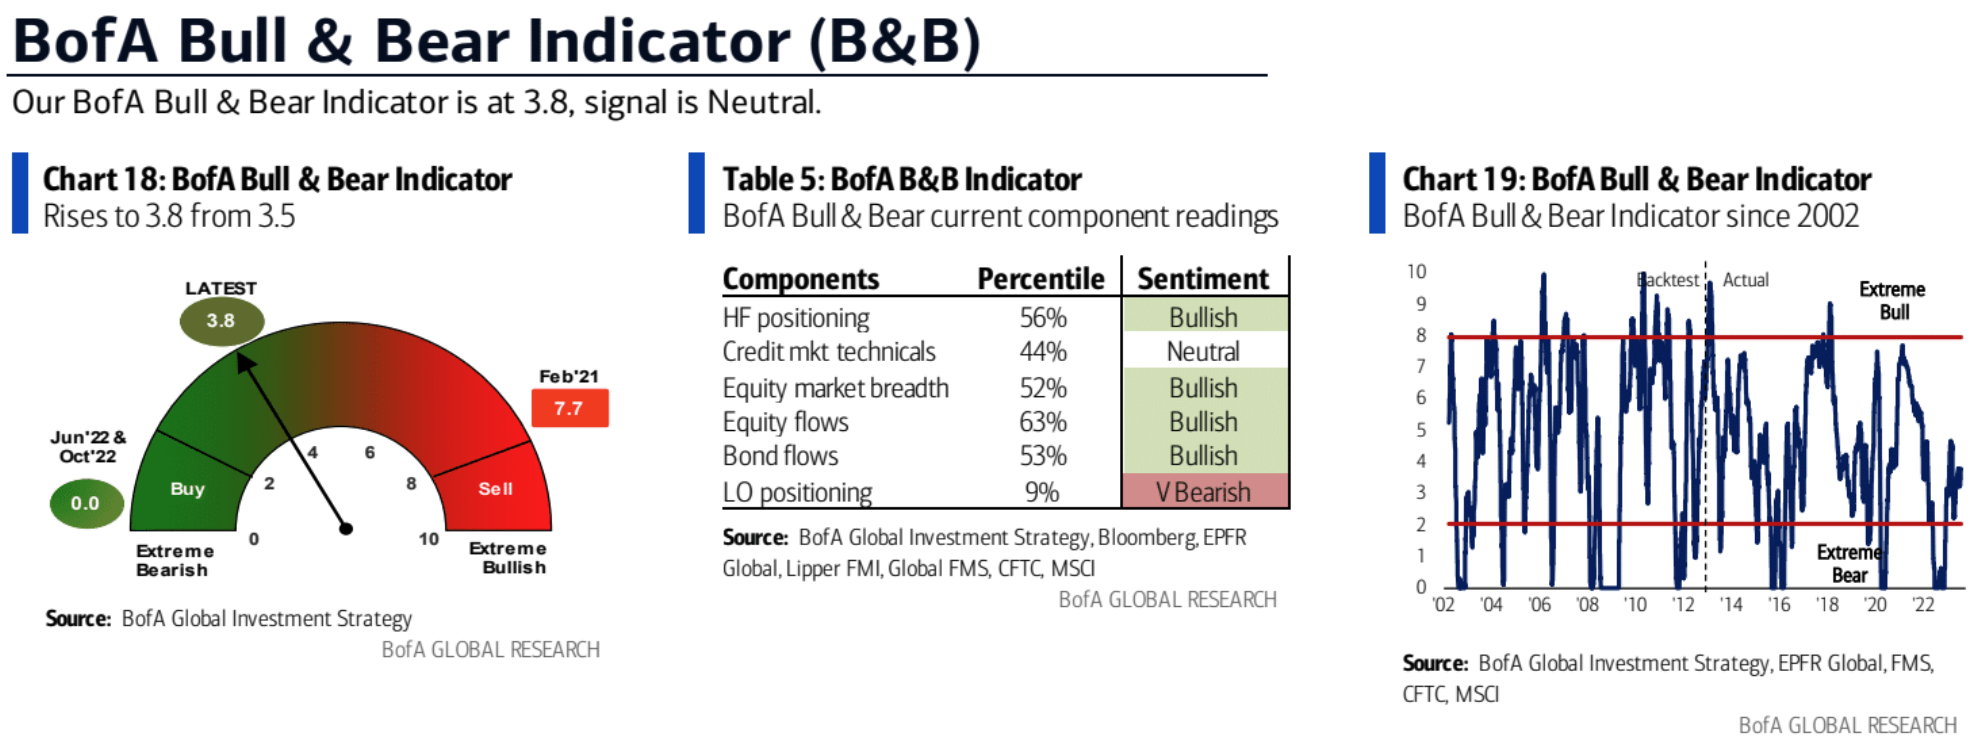
The Bank of America Bull & Bear Indicator rose from 3.5 to 3.8 last week, still in the neutral range:
This week's focus
Three major central banks will hold policy meetings. Market expectations are that the Fed and ECB will continue to be hawkish, while the Bank of Japan is unlikely to adjust its policy in this meeting due to lower-than-expected inflation data. The Fed will hold a meeting on Wednesday, the ECB will hold a meeting on Thursday, and the Bank of Japan will hold a meeting on Friday. The CME FedWatch Tool shows that the probability of the Fed not raising interest rates in the remaining three interest rate meetings this year is more than 60%, and the likelihood of a rate cut in March next year reaches 40%. Recent US retail sales and jobless claims data both indicate the resilience of the US job market and inflation, and there is still uncertainty about whether the Fed will officially give guidance to end its interest rate hike process at the July meeting.
This week, US stocks will face the earnings test of three other major tech stocks, Meta, Microsoft, and Google. Netflix's performance has already cast a shadow over Meta's quarterly outlook, as it heavily relies on the digital advertising business. Currently, the market expects Google to achieve a 9% profit growth this quarter after experiencing four consecutive quarters of decline; Microsoft's adjusted operating profit margin is expected to increase from 40% a year ago to 42%; after six consecutive quarters of decline, the market expects Meta to resume growth in the second quarter, with earnings per share increasing by 19%.
The US June PCE price index will be released on Friday. The market expects that the year-on-year growth rate of the US June PCE price index will decrease from 3.8% in May to 3.1%, and the year-on-year growth rate of the core PCE price index will decrease from 4.6% in May to 4.2%.
The NASDAQ conducted index weight adjustments on Monday, which may result in passive selling of large tech stocks. However, considering that many funds have established significant short positions in big tech or have not been able to get in before, they may take advantage of this rebalancing as an opportunity to increase their positions and narrow the gap, which could provide some buying support.
Institutional Viewpoints
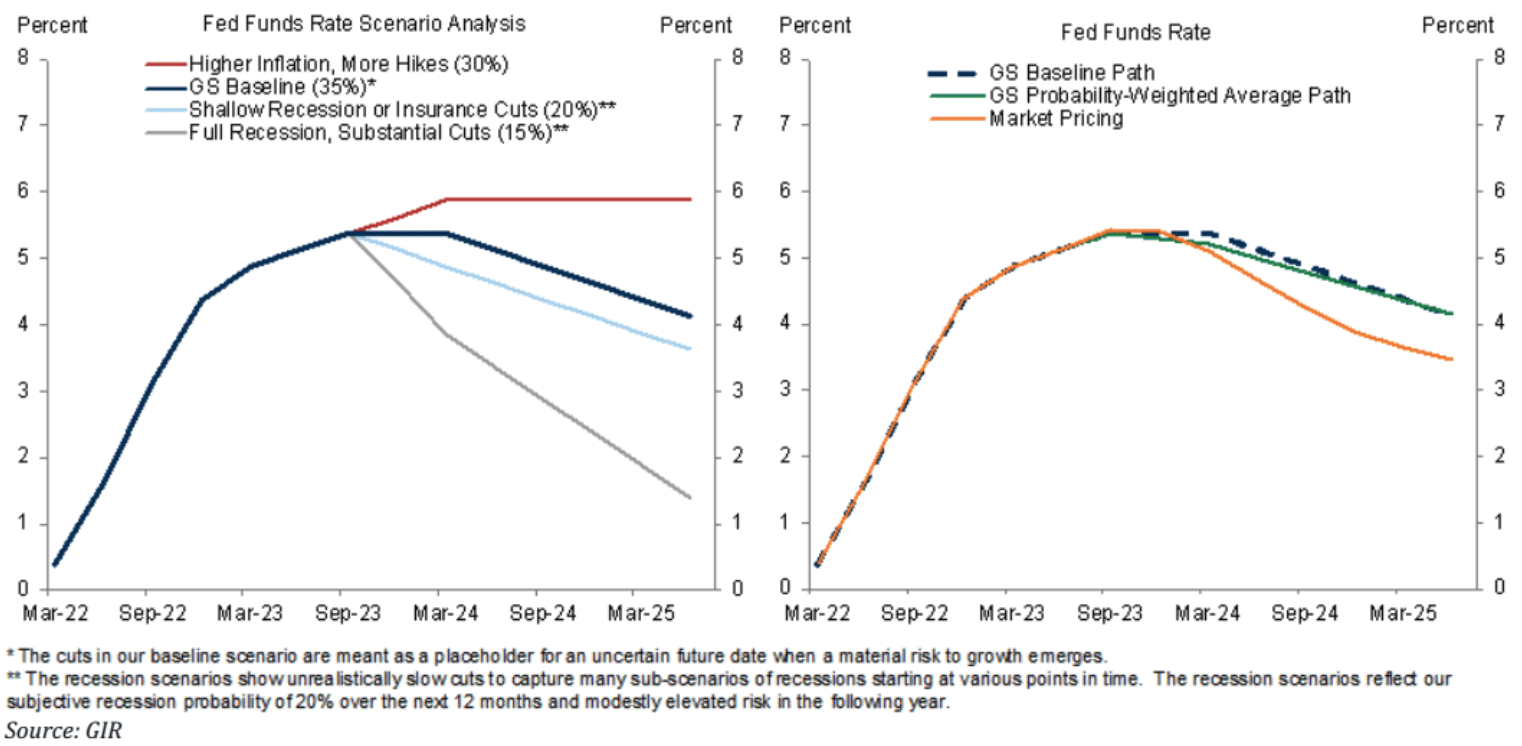
Goldman Sachs: Does not believe that interest rates will be lowered before Q1 2024, market pricing is too aggressive
David Mericle (Chief US Economist): We do not anticipate an interest rate cut until there are apparent risks to growth or a significant decline in inflation. In our forecast, we anticipate the first interest rate cut when the core PCE inflation rate falls to 3% at an annual rate in Q2 2024, and declines to 2.5% at an annual rate. Even if inflation decreases, they may still refrain from lowering rates. If growth exceeds potential, unemployment continues to reach new lows, and financial conditions become even looser, an interest rate cut may feel like an unnecessary risk. We assign a nearly equal probability to an upside scenario in a non-recessionary environment as to our baseline. We expect interest rate cuts in a non-recessionary scenario to gradually occur at a pace of 25 basis points per quarter.
Bill Gross: US Treasury yields unlikely to decline quickly
Legendary investor Bill Gross wrote in his latest investment outlook that although US Treasury yields may have already peaked this year, a bond bull market is unlikely to arrive. Gross expects the 10-year US Treasury yield to remain above 3.5% in the long term, and it may rise above 4% in the next two years. This is primarily due to the Federal Reserve's balance sheet reduction and the soaring US government deficit, which will further increase the supply pressure on the bond market.