Macro Market Weekly Report (7.10): Global yields surge, can second-quarter reports recharge faith?



Last week, US data remained strong, indicating that the most severe drag on growth from tightening financial conditions in the real estate market, which is most sensitive to interest rates, may have passed. However, this may lead to a further decline in expectations of interest rate cuts in 2024, which the bulls are anticipating. At the same time, the US Independence Day holiday last week, combined with investors waiting for second-quarter earnings, also added resistance to the stock market's upward movement.
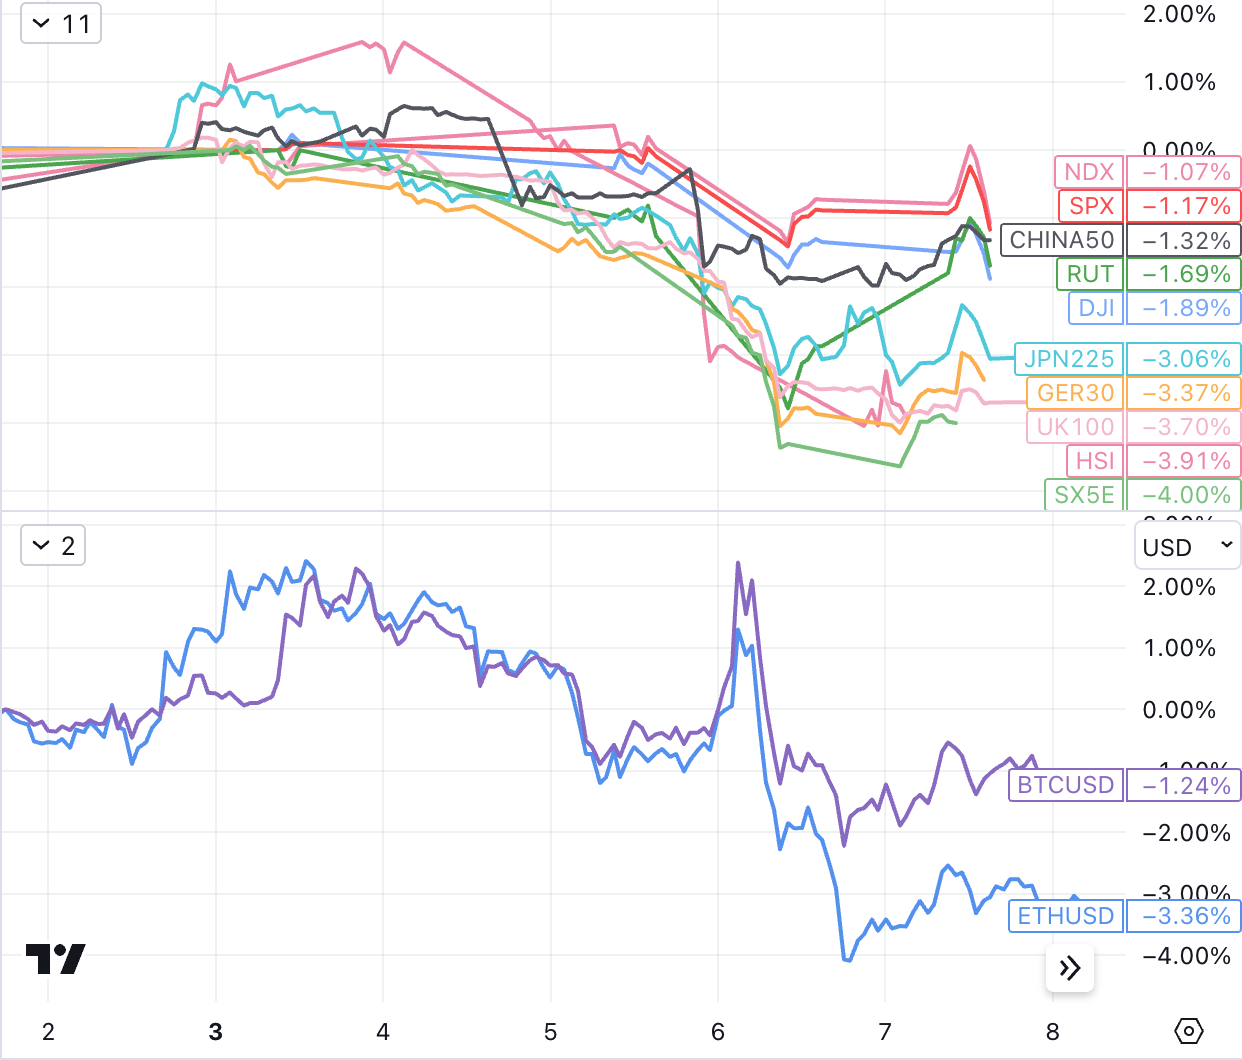
The major stock indices failed to maintain the positive momentum of the previous week, with the S&P 500 and Nasdaq falling by about 1% and the Dow Jones falling by nearly 2%. Due to the market interest rates hitting a new high for the year, there is pressure on the risk asset market, and the stock market plunged on Thursday. The brief rally after the release of the jobs report on Friday could not be sustained in the afternoon.
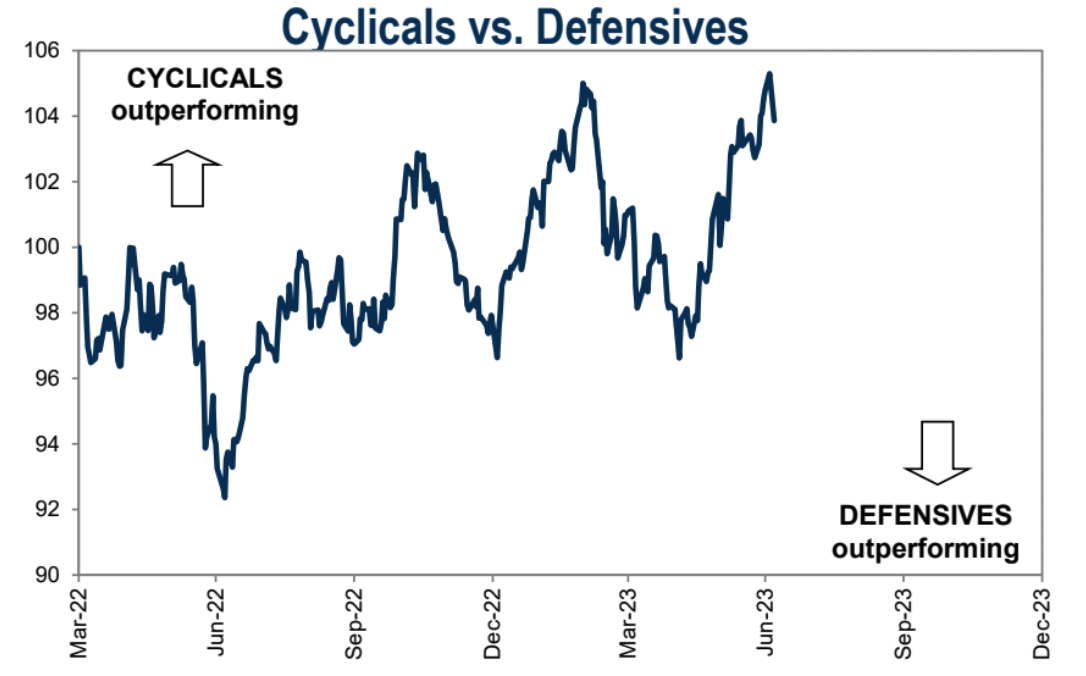
The decline in risk appetite led defensive stocks to outperform cyclical stocks last week:
Cryptocurrencies followed the stock market's decline/bond yield rise on Thursday, with Bitcoin failing to break through the $31,000 mark for the fourth time this year, which could lead to considerable disappointment among bulls.
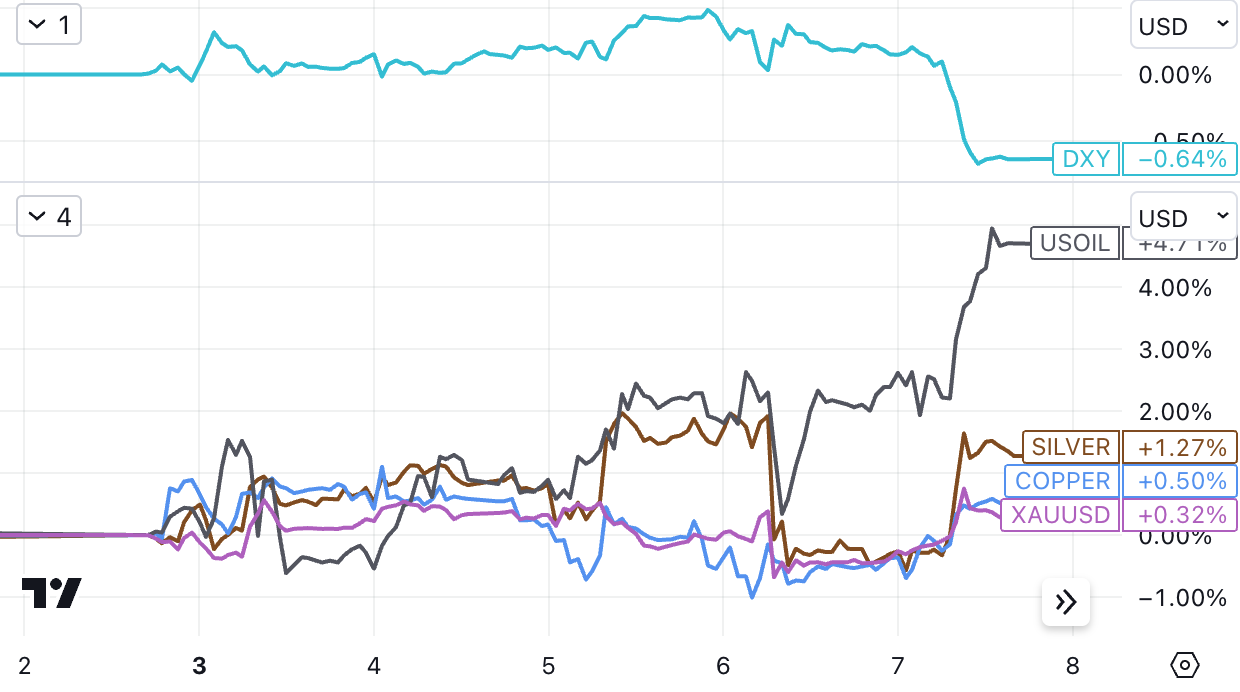
The U.S. dollar has turned the corner. Despite the rise in U.S. interest rates, the DXY continues to fall, which could be a significant signal that the dollar is in a downward trend. However, it is important to note that global major central banks have expectations of higher interest rates, and in comparison, the U.S. is the one with the lower increase.
Global Bond Yields Surge: Not All Bad News
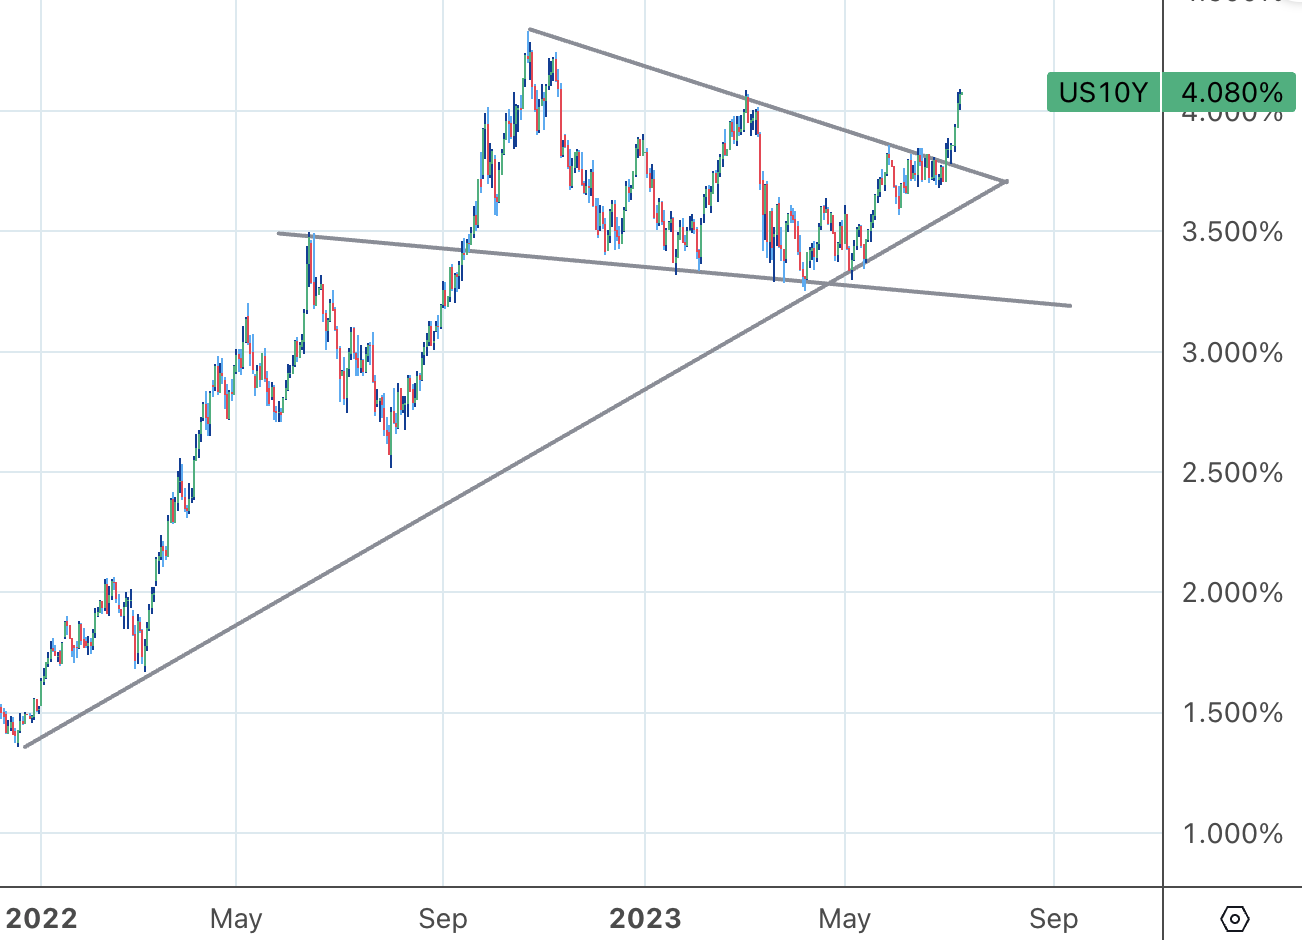
Over the past week, both the 10-year and 2-year bond yields have reached new highs for the year, with the 10-year surpassing 4% and the 2-year nearing 5%. The 10-year U.S. Treasury yield has broken through the 4% level for the second time this year, a key level that has only been breached three times since 2008.
This recent surge began in mid-May when the 10-year U.S. bond yield was only 3.4% and the 2-year yield was around 3.9%. Since then, the 2-year bond yield has risen more than 100 basis points, bringing the 2-10 year yield curve back to its highest level during a tightening cycle.
Despite these significant fluctuations, the increase in U.S. bond yields since mid-May has been smaller compared to the increases in bond yields of the UK, Canada, and Australia. UK bond yields have risen the most since mid-May, whilesp;The 10-year yield increased by nearly 100 basis points, while the 2-year increased by 175 basis points.
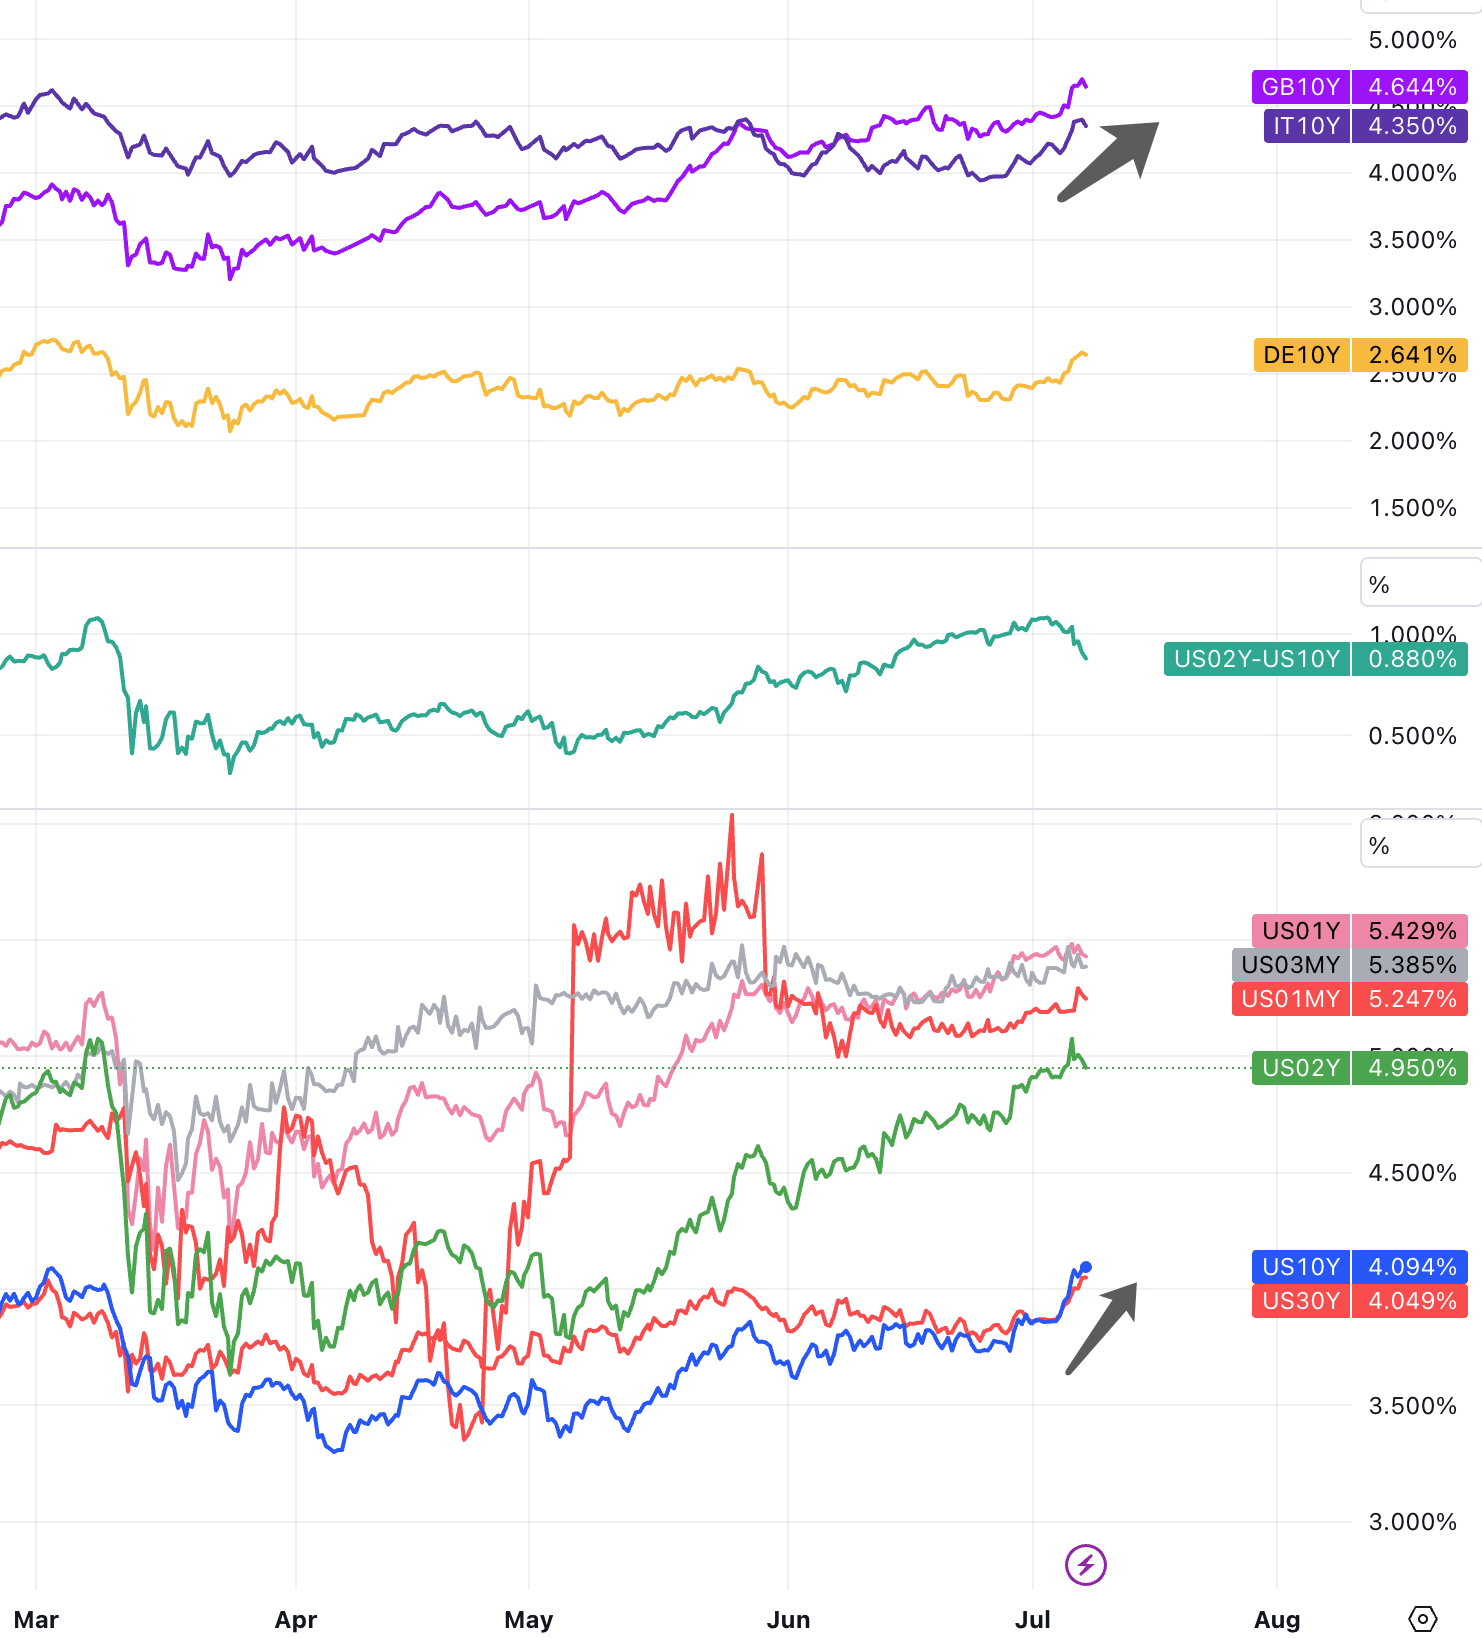
This can be understood as the market re-pricing the implied monetary policy path of the central bank. Except for Japan, the interest rate policy expectations of major developed country central banks have all increased. Since May, the market further predicts that the UK will raise interest rates again by 75-100 basis points; Australia will raise interest rates again by 50-75 basis points; and Canada will raise interest rates again by 25-50 basis points. In comparison, the market only expects a 30-40 basis point increase in the future interest rate trends of the Fed and the ECB, and the difference in inflation data may be the main reason for the differences in expectations. So this may also be one reason for the continued weakness of the US dollar index.
The accelerating rise in real interest rates (blue line) has clearly suppressed the price of gold (yellow line) in the past two months, but the suppression of the Bitcoin price has decoupled since mid-June. This is clearly due to the influence brought by the re-entry of European and American Tradfi giants. Once the cryptocurrency market lacks sustained hotspots, high interest rates are obstacles to the overall market's desire to reach new highs for digital currencies. The two have shown a relatively high negative correlation in the past year:
However, on the other hand, the rise in real-world asset yields will also bring benefits to the RWA concept projects in the Crypto industry, with the biggest beneficiary being MakerDAO, as the protocol now holds nearly $1.3 billion in US dollars.
For national treasury bond assets, every 100 basis points of yield increase can bring an additional 13 million US dollars/year income to the agreement. Since the excess surplus of the agreement may be used to repurchase MKR tokens, in fact, there should be a gap between the price of tokens and the yield of U.S. bonds. High positive correlation (negative correlation with internal lending and LSD projects in the encryption market), but due to the current market pricing efficiency is not high, this correlation may not be recognized by most people.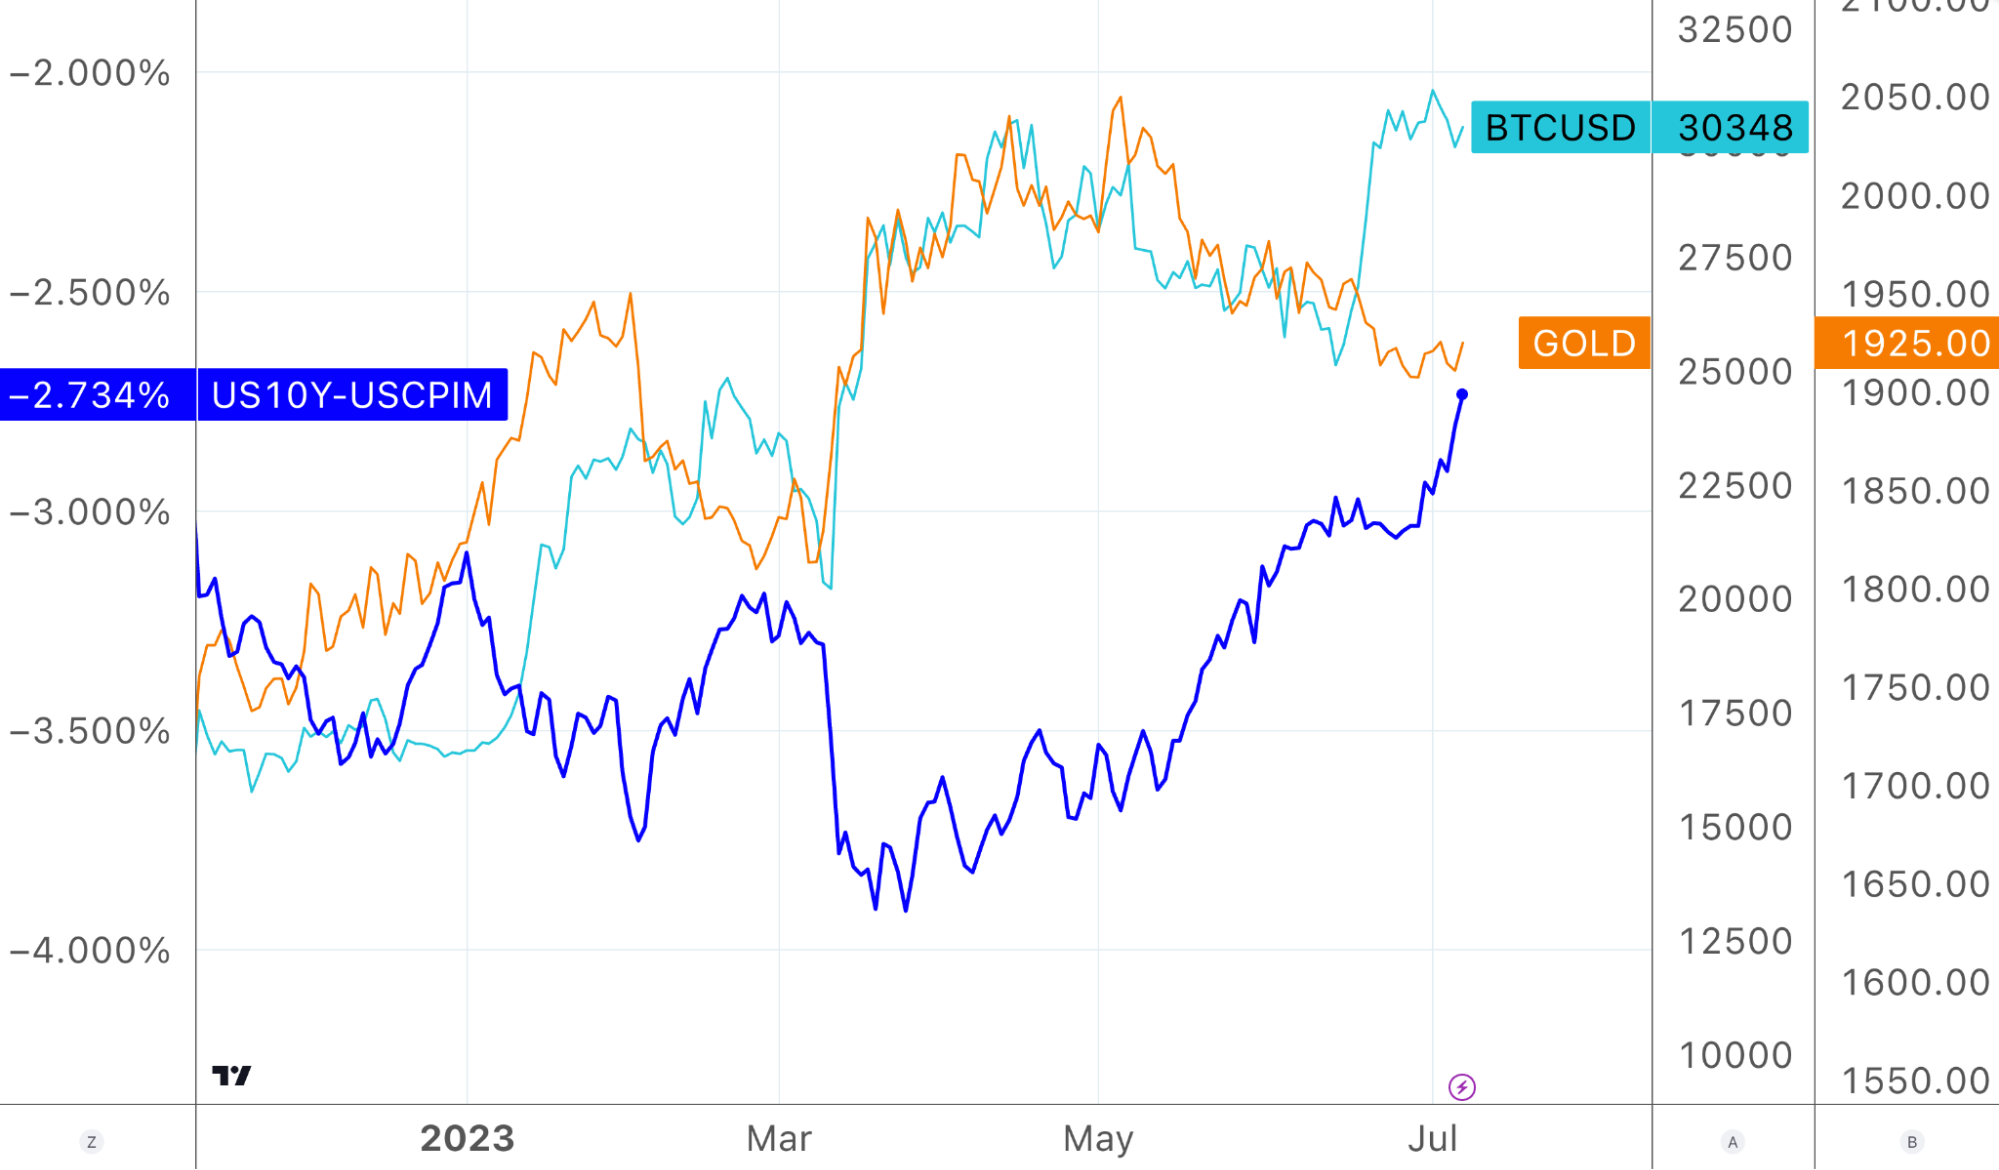
Last week's important data review
NFP data falls short of expectations, but won't shake the Fed's hawkish stance
Non-farm payroll employment increased by 209,000, below the expected 230,000, and previous months' data were revised lower. On the other hand, average hourly wages grew by 0.4% on a monthly basis, surpassing the expected 0.3%. Despite the slight deviation from the elevated expectations following the strong ADP report, the key is that the U.S. unemployment rate is 3.56% and wage growth is 0.4%, indicating that the U.S. labor market remains solid with signs of tightening.
At the June meeting, the Fed unexpectedly announced that it would raise interest rates twice instead of once in the future and projected a fourth-quarter unemployment rate of 4.1%. Considering that the current unemployment rate is still 3.56%, it is estimated that the Fed will revise down its year-end unemployment rate forecast at the next update of the economic outlook, which could lead to an upward shift in the 2024 dot plot. As reflected in the recent movement of interest rate markets, a rate cut in 2024 has been priced out as data remains strong. Short-term interest rates are likely to continue rising unless the data slows down.
FOMC June Meeting Minutes
The release of the minutes from the Federal Reserve's mid-June meeting has strengthened expectations for further interest rate hikes this year. The minutes show that most Fed officials expect the need for additional rate hikes, and some non-voting members hope to continue the hiking cycle at the June meeting instead of pausing.
Expansion in the U.S. Services Sector
The ISM Non-Manufacturing Index remains strong while the manufacturing sector continues to shrink. The June ISM Non-Manufacturing Index came in at 53.9, surpassing expectations of 51.2 and higher than last month's 50.3. Out of the 18 service industries, 15 experienced expansion in June, with accommodations and food services, as well as arts, entertainment, and recreation being the main drivers.
Meanwhile, the ISM Manufacturing Index continues to show signs of weakness. The June reading was 46.0, lower than the expected 47.1, marking the eighth consecutive month of contraction. However, in the U.S., the services sector makes up over 75% of the overall economy, so the impact of service sector data is greater compared to manufacturing. Currently, the demand for a healthy services sector is reflected in strong economic growth and widespread consumer confidence recovery.
Housing Market Rebound
Slowing Recovery in China
Last week, the manufacturing output expansion and new orders slowed down, with the Caixin/Markit Manufacturing Purchasing Managers' Index declining from 50.9 in May to 50.5 in June. The services sector PMI also dropped from 57.1 in May to a lower-than-expected 53.9 in June, marking the sixth consecutive month of expansion but the lowest level since January. The weak Caixin data is consistent with the official Manufacturing Purchasing Managers' Index, which contracted for the third consecutive month in June.
Chinese Premier Li Keqiang pledged to "spare no effort" in implementing targeted policies to strengthen China's post-pandemic recovery. According to official media reports cited by Bloomberg, Li said that China is in a critical stage of economic recovery and industrial upgrade, and comprehensive and coordinated measures are needed to stabilize growth and employment. However, Li did not disclose any specific details of the measures.
In terms of the central bank, Chinese leaders have appointed People's Bank of China Vice Governor Pan Gongsheng as the Party Secretary of the central bank. According to the WallThe "Street Daily" quoted an anonymous source as reporting that this move will make him the next governor of the central bank. Economists interpret this as strengthening policy stability, consistent with the central bank's current practice of moderate interest rate cuts and encouraging banks to provide more loans to target areas.
Fund Flow: Stocks, Bonds, and Money Market Funds All Continue to Increase Holdings, with Retail Investors Active and Institutions Slowing Down
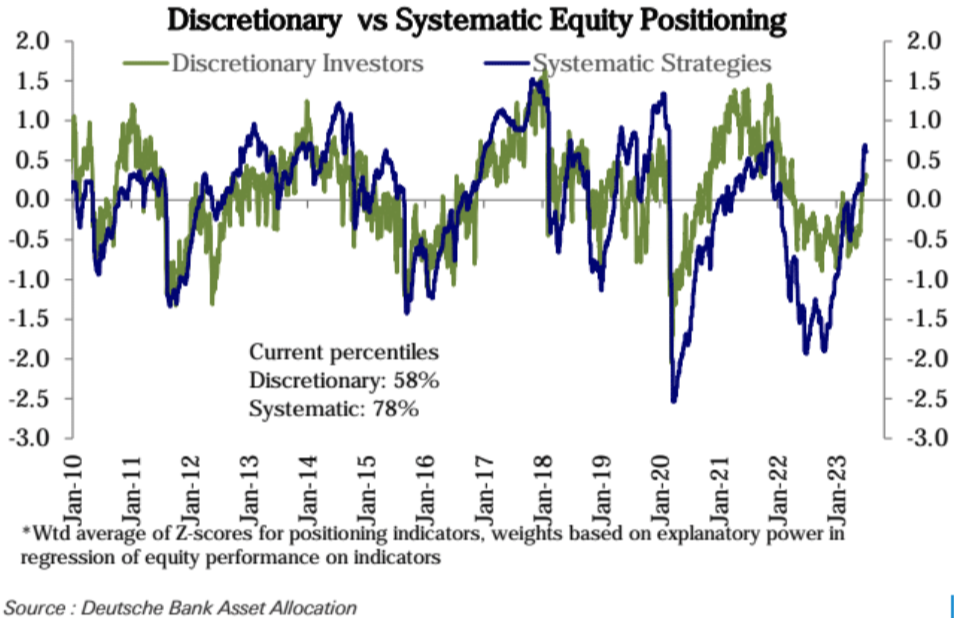
According to Deutsche Bank's statistics on discretionary and systematic investors' positions, the former slightly increased their positions last week, while the latter slightly decreased their positions. Currently, they are at historical percentiles of 58% and 78% respectively, indicating that the momentum of large institutions' stock buying has temporarily slowed down, while the positions of discretionary investors are still in the neutral range compared to historical data, suggesting there is still room for further buying.
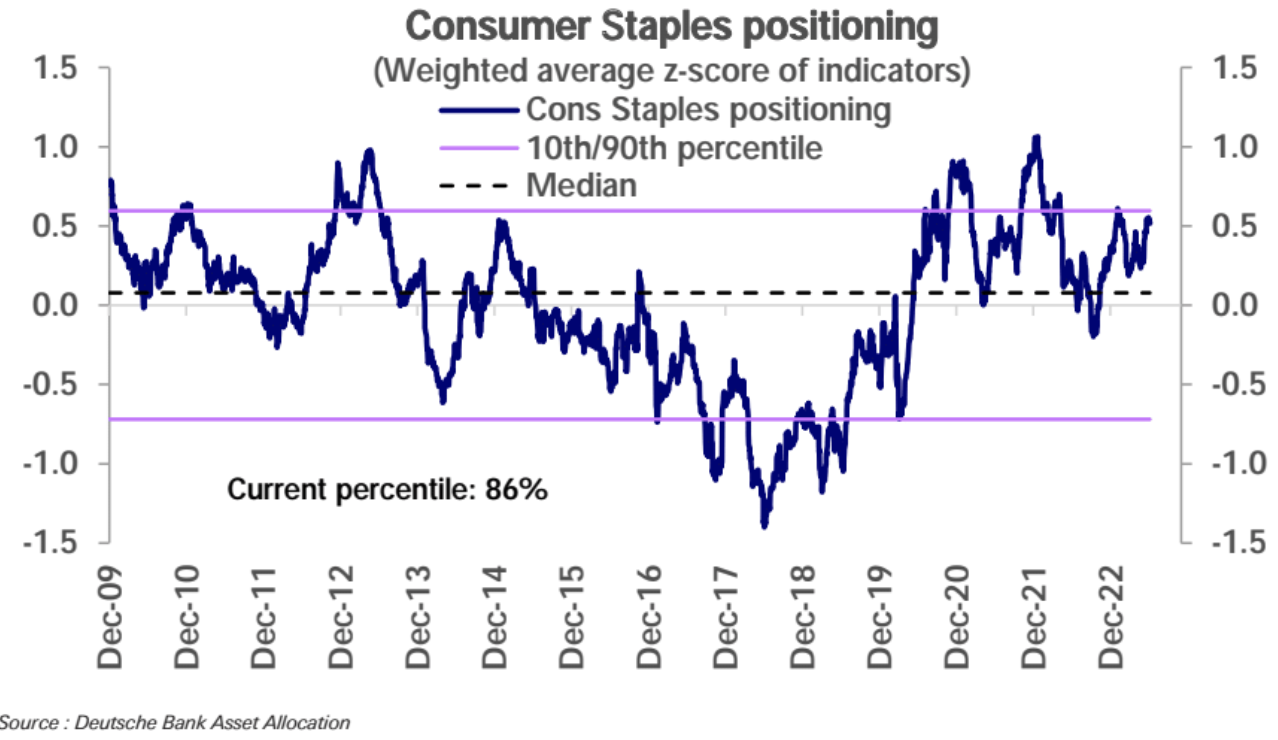
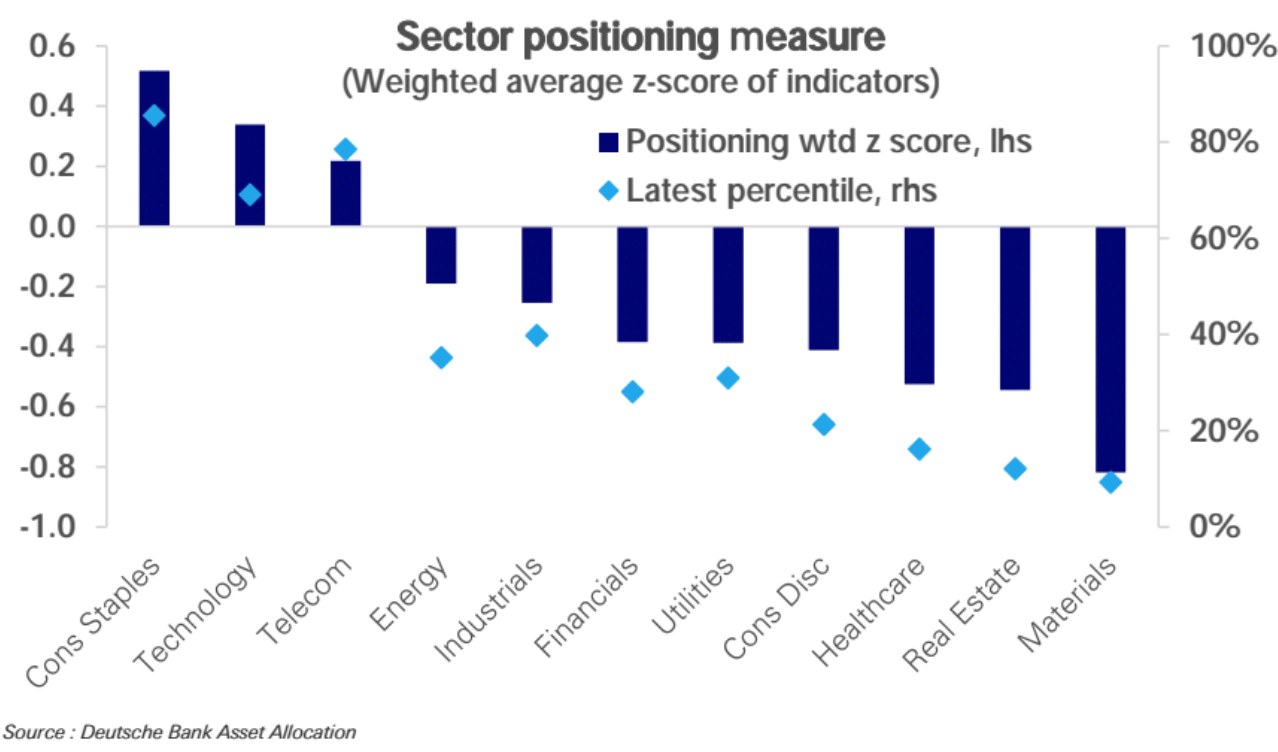
In terms of sector allocation in the US stock market: Consumer Staples (86%), Technology (69%), and Communication Services (79%) are all currently overallocated. The latter two mainly reflect the concentrated holdings of large-cap growth companies. In terms of trajectory, allocation to Consumer Staples has reached the top of the historical range, with limited upside potential; allocations to Technology and Communication Services stocks are rapidly increasing but have not yet reached the top of the historical range.
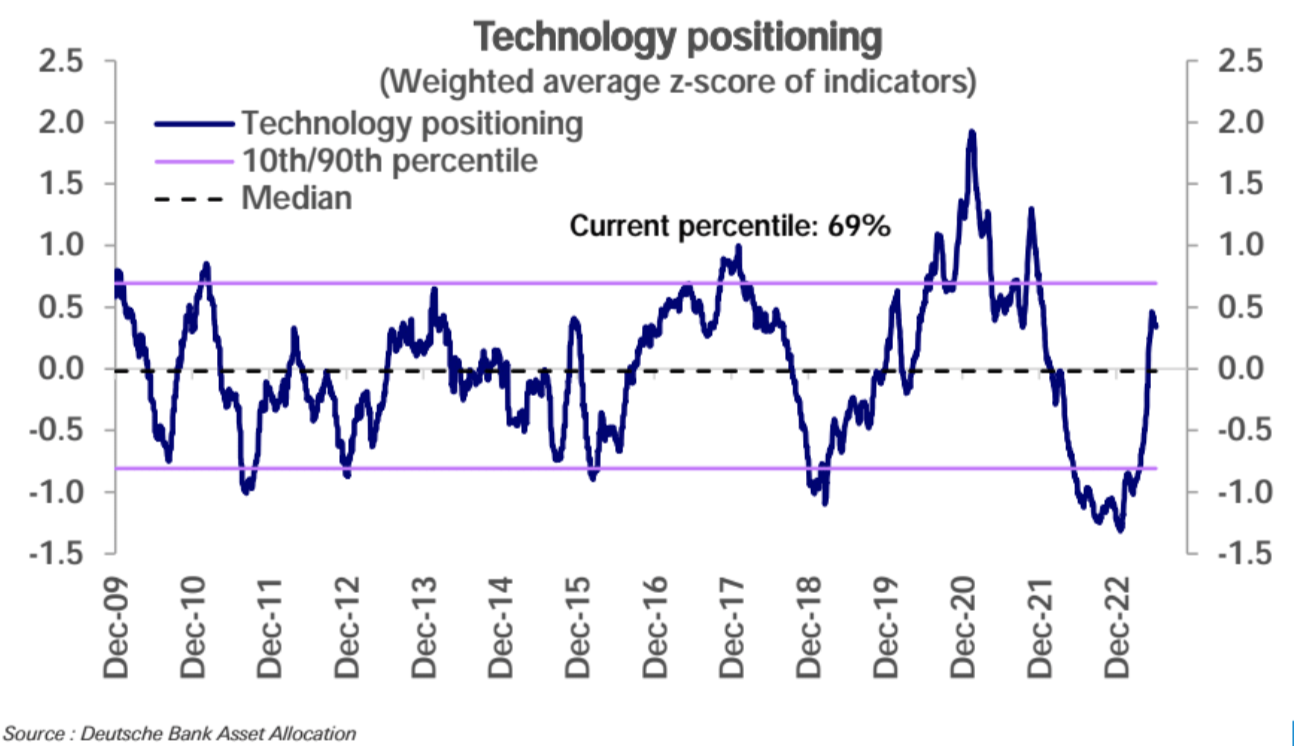
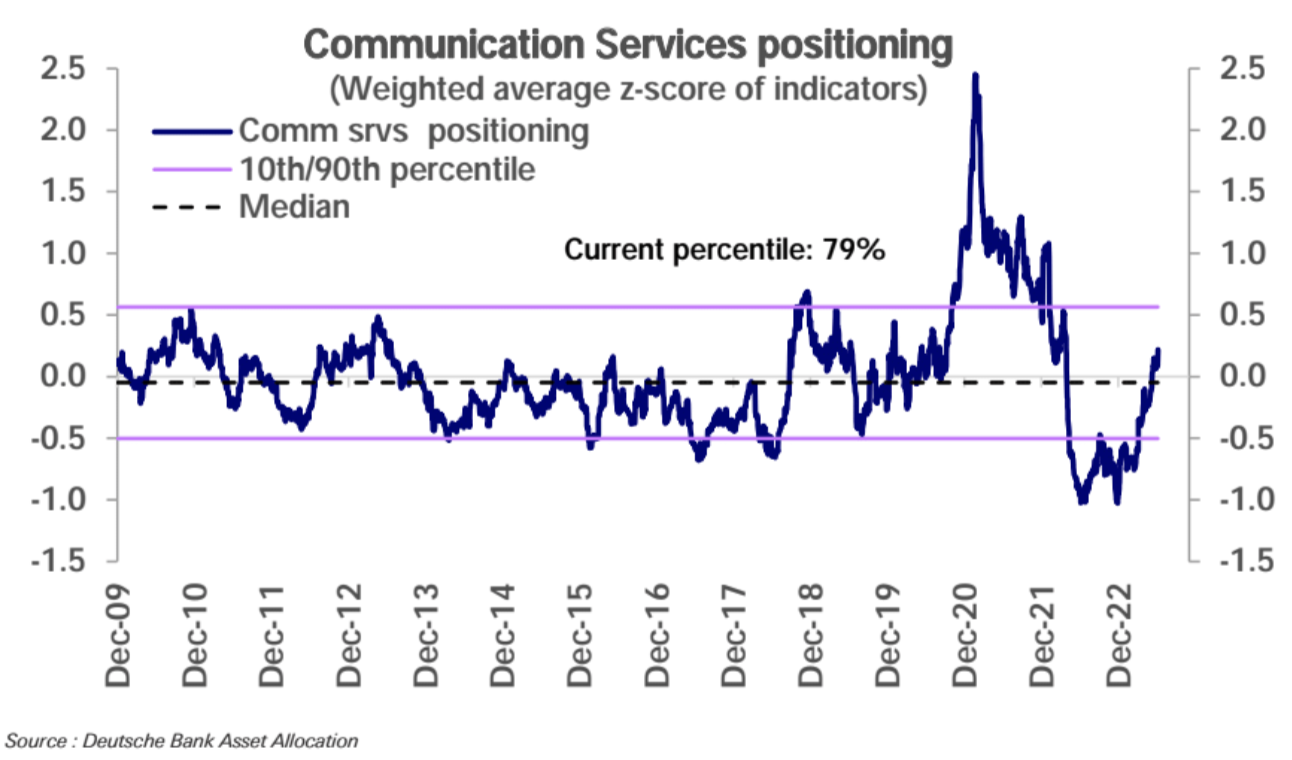
Long-term investors can pay attention to sectors that are currently relatively historically low, including raw materials, real estate, healthcare, etc:
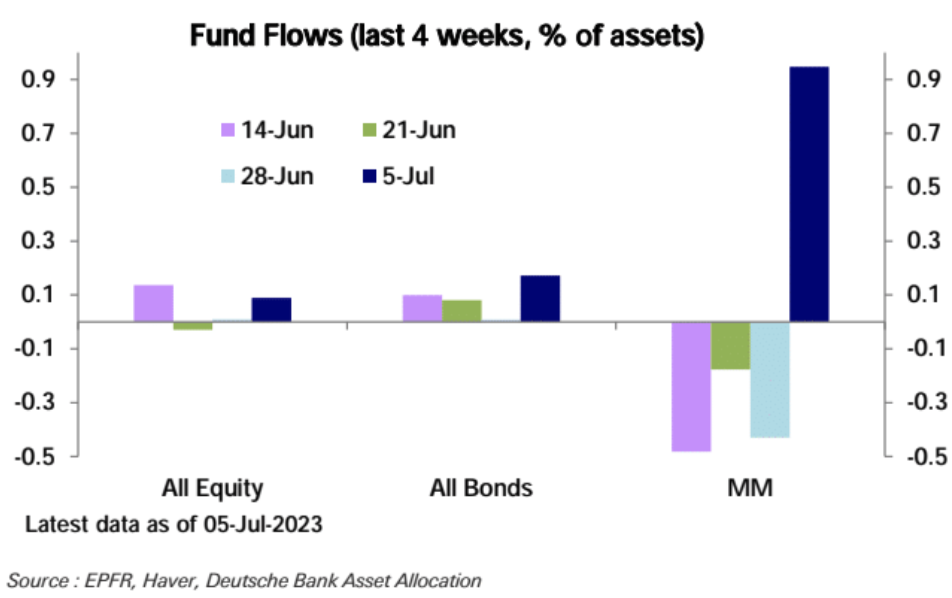
According to EPFR's international fund flow, money market funds saw the first net inflow in three weeks last week, totaling $73.6 billion, the largest weekly inflow in three months. At the same time, bond funds had a net inflow of $11.5 billion, the fastest pace in four weeks, indicating that the high-yield fixed income market is beginning to accelerate the absorption of market liquidity. However, equity funds also saw strong inflows last week ($1.48 billion), driven primarily by strong inflows from the United States ($1.38 billion):
Europe (-$1.3 billion) has experienced outflows for the 17th consecutive week, but the pace slowed down last week.
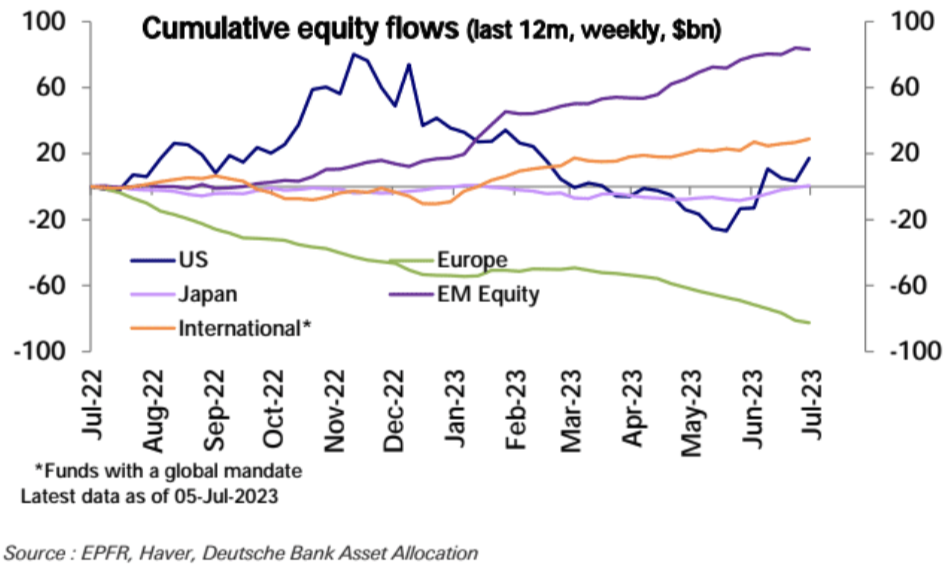
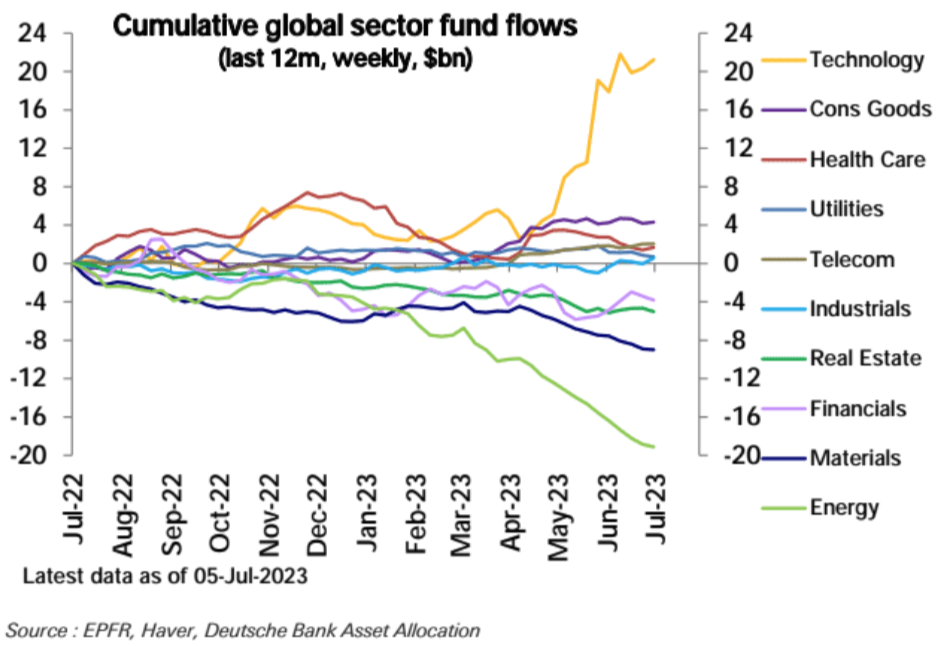
From an industry perspective, the technology sector has seen a renewed acceleration (+ $900 million), and the industrial sector (+ $600 million) has also experienced significant inflows. On the other hand, there has been an outflow of $400 million from the financial and real estate sectors. The energy sector (- $300 million) continues to see outflows, while other sectors have seen little change:
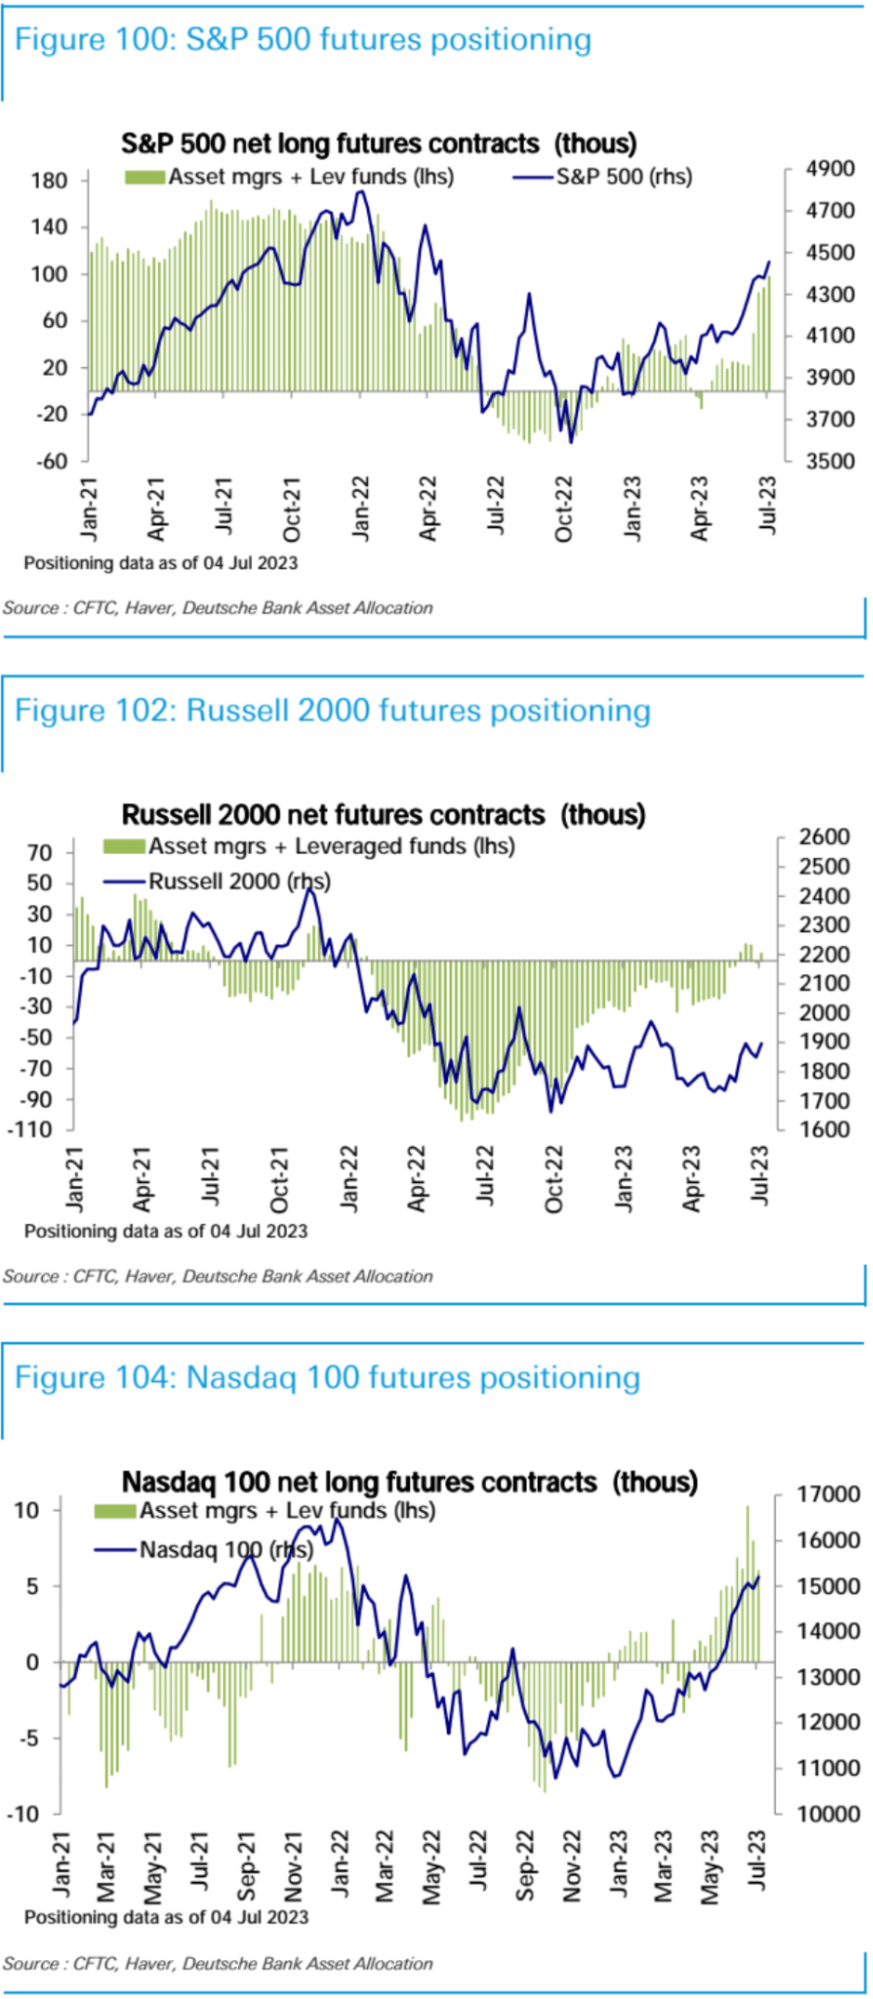
The long positions in stock index futures continue to rise, mainly driven by the sharp increase in net long positions in S&P 500 futures. The net long positions in Nasdaq 100 futures slightly declined, while the net short positions in Russell 2000 futures turned from a slight net short position to a net long position again. This is consistent with the improvement in the breadth of the spot market. Overall, the bull market led by technology stocks is spreading to more sectors:
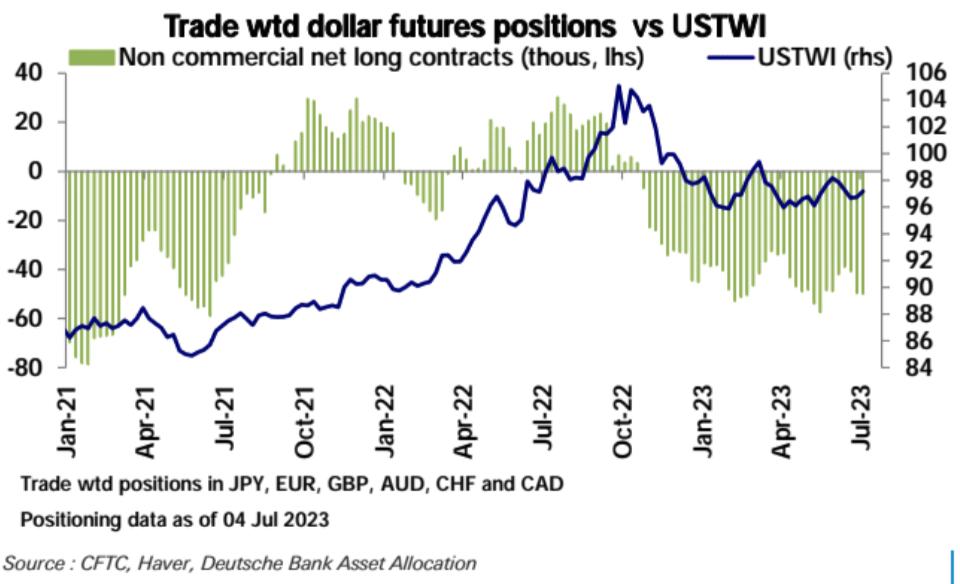
While the US dollar index is in a narrow range of volatility, the net short positions on the US dollar last week remained largely unchanged, maintaining a high level for 9 weeks:
Market Sentiment Overview
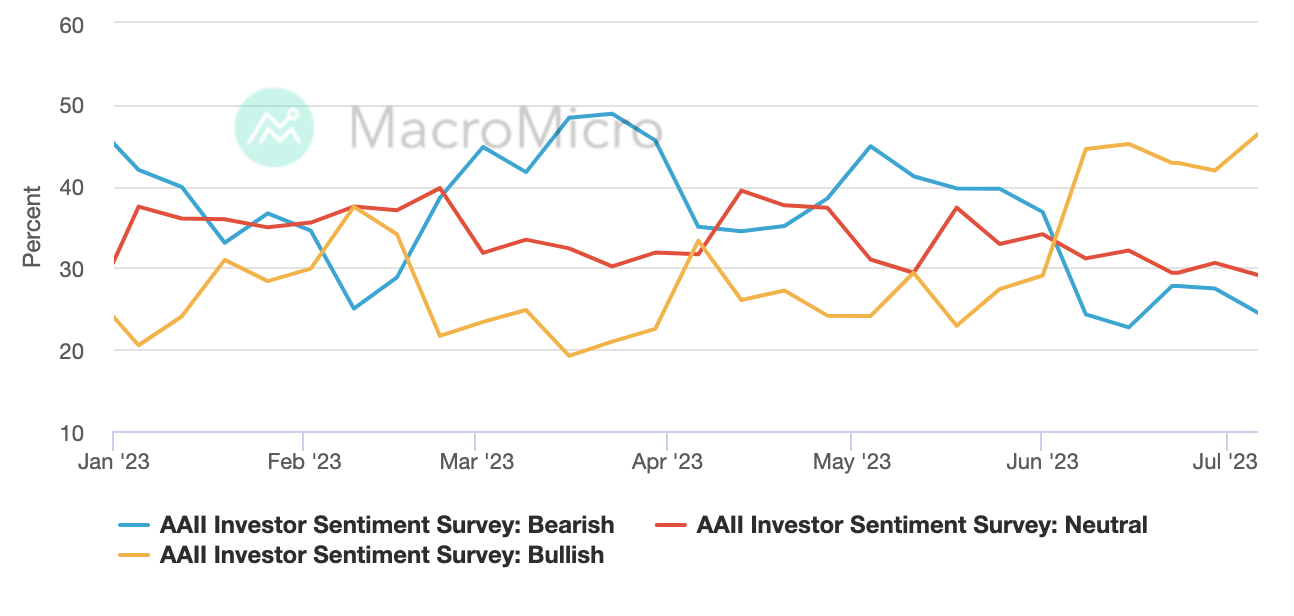
The AAII investor sentiment survey, which represents more retail investors, shows a significant increase in bullish sentiment last week, rising by 4.4 percentage points to 46.39%, reaching the highest level since November 2021:
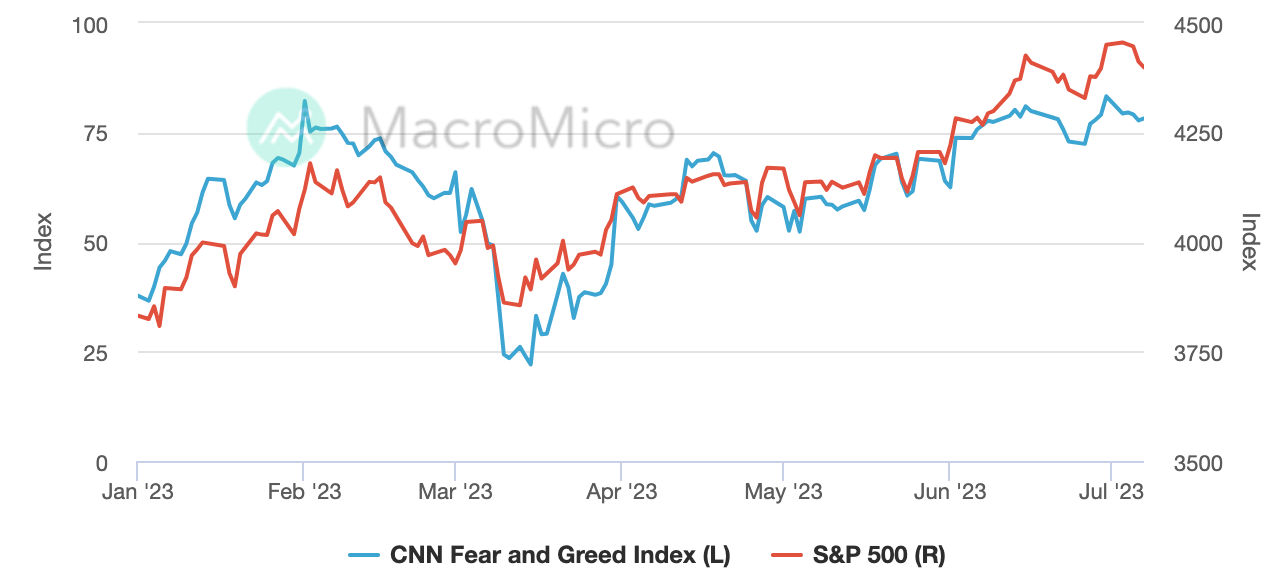
The CNN Fear & Greed Index slightly declined last week but remained above the "extreme greed" level of 75:
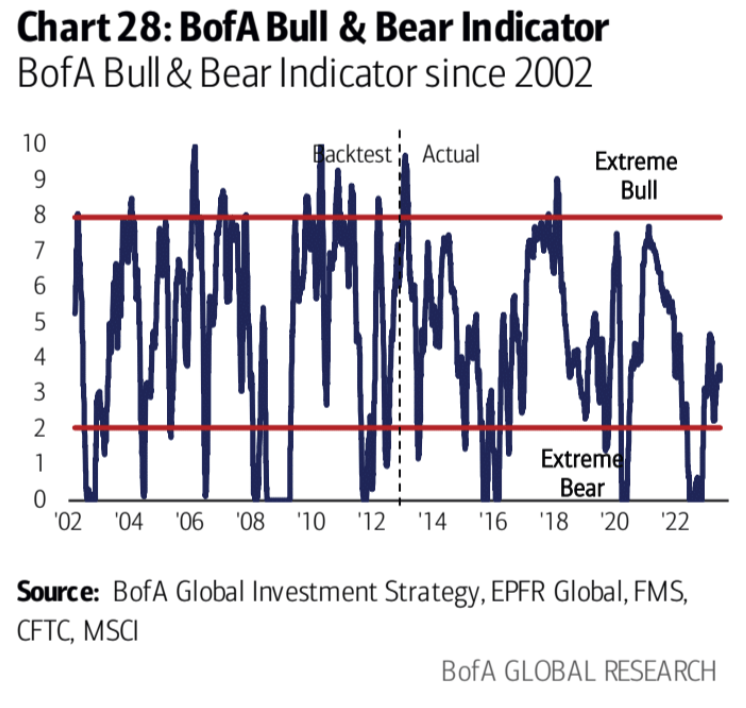
Bank of America Merrill Lynch's Bull & Bear Indicator remains unchanged at 3.2 from the previous week, still in the neutral range:
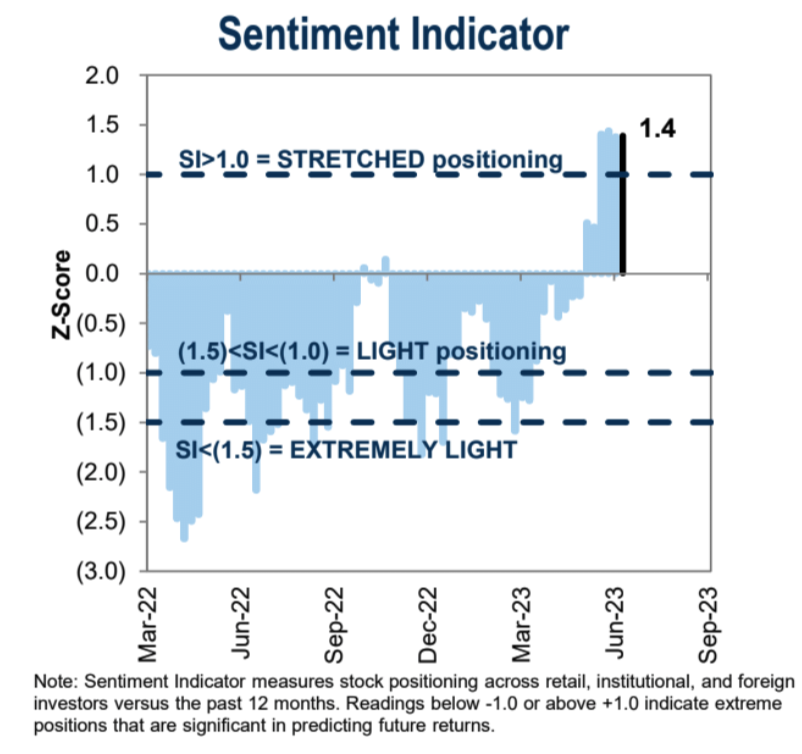
Goldman Sachs' sentiment indicator has been in the heavily long position for the fourth consecutive week, but has not yet reached the level of extreme overweight:
Focus of the Week
The second quarter earnings report of 2023 is expected to start this week, with a market consensus of a 9% year-on-year decrease in EPS for the S&P 500 index (at $220), mainly due to flat sales and compressed profit margins. Since this expectation is somewhat pessimistic, it might be difficult for the actual negative sentiment for 2023 to be significantly strengthened. Recently revised data from some institutions have actually shown some improvement in sentiment. However, the market is relatively optimistic about an 11% EPS growth (reaching $244) for 2024. Therefore, the unexpected positive surprises in this earnings season are more likely to be concentrated on the figures for 2023.
Points of interest to focus on in this earnings season include:
● Companies' ability to maintain profit margins during inflation downturns
● Impact of bank pressures on credit and lending
The market expects the year-on-year PPI for June in the United States to decrease from 1.1% in the previous month to 0.4%, while the core PPI is expected to decrease from 2.8% to 2.5%. The deflationary pressure on producer prices as a leading indicator is more apparent.
However, we should not overlook the fact that, due to base effects, this data may be the lowest level for the remaining time of the year.
From the chart below, we can see that the price index rose sharply in May and June last year, then remained steady from June to December 2022. Since January 2023, CPI has accelerated again:
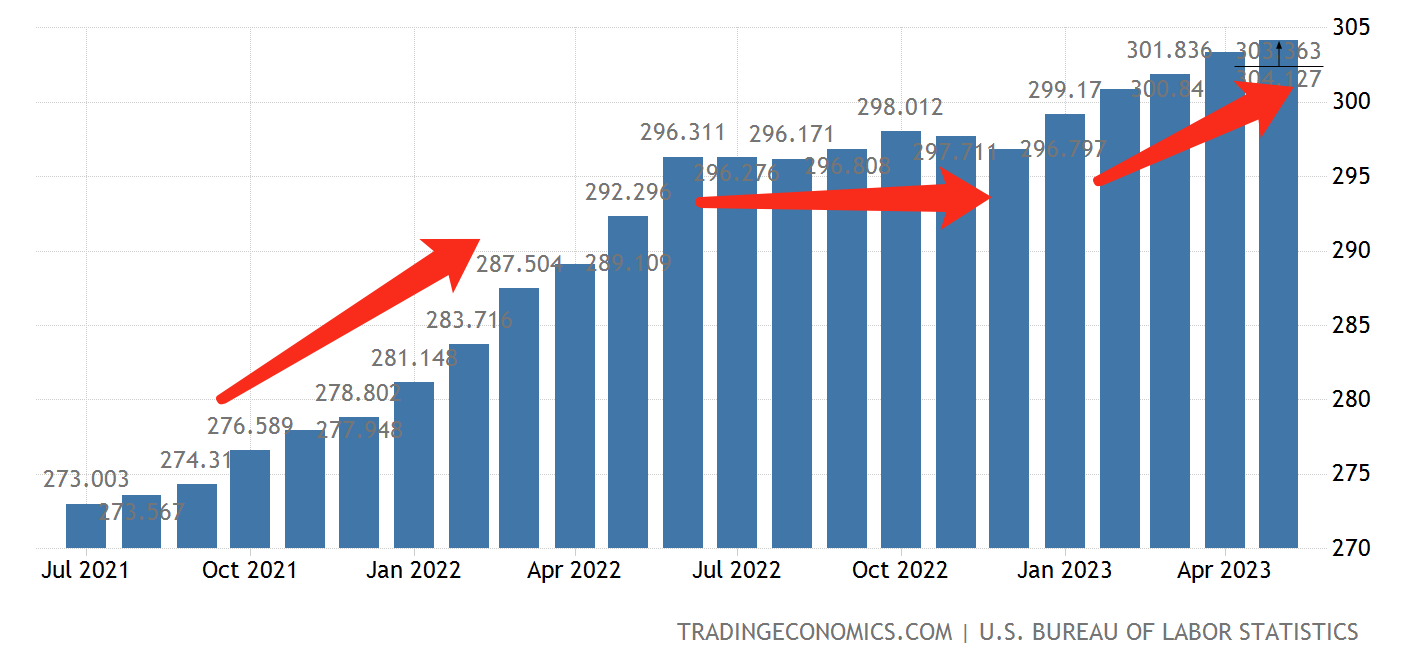
Therefore, there is a high possibility that concerns about prices and interest rates will ferment after this month, considering that last week the 10-year US Treasury bond broke through the range consolidation level from a technical perspective: