
The No-Code Data Analysis Tools You Need to Know
There are countless no-code analytics tools on the market today, allowing developers and non-developers alike to build charts and dashboards using a drag-and-drop approach.
This list covers 4 no-code data analysis tools for different use cases and industries. These tools help users save time and make informed decisions based on data.
Footprint Analytics
Footprint AnalyticsIt is a one-stop platform for data analysis on GameFi, DeFi, and NFT chains. It helps developers, analysts, and investors get actionable metrics from on-chain data.
In the past, this type of data required extensive developer resources to index and organize. Now it only takes a few minutes to realize blockchain multi-field data analysis.
exist
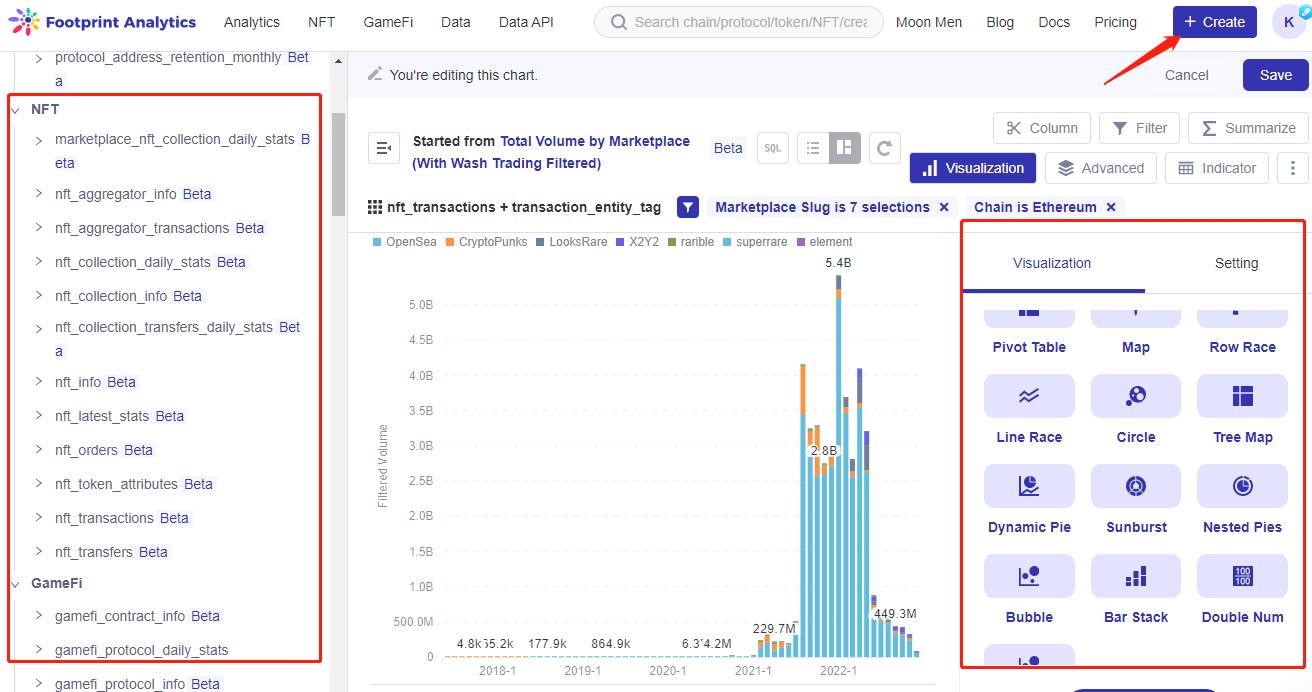
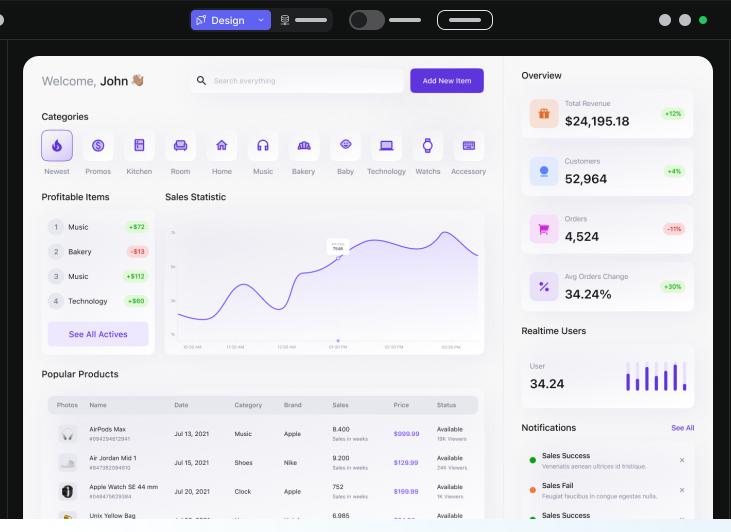
existFootprint AnalyticsOn the homepage of the official website, users can click "Create" to create different charts and dashboards to continuously track the behavioral activities of indicators in more fields.
Drag and drop to create data tables or dashboards
The platform provides an interface for washing trade API filtering. Without writing code, developers and traders can filter suspicious transactions from transactions and obtain accurate transaction data to analyze the organic market.
In addition, more data indicators are included, such asNFT project comparison、Overall performance of the GameFi market、Analysis of each chain。
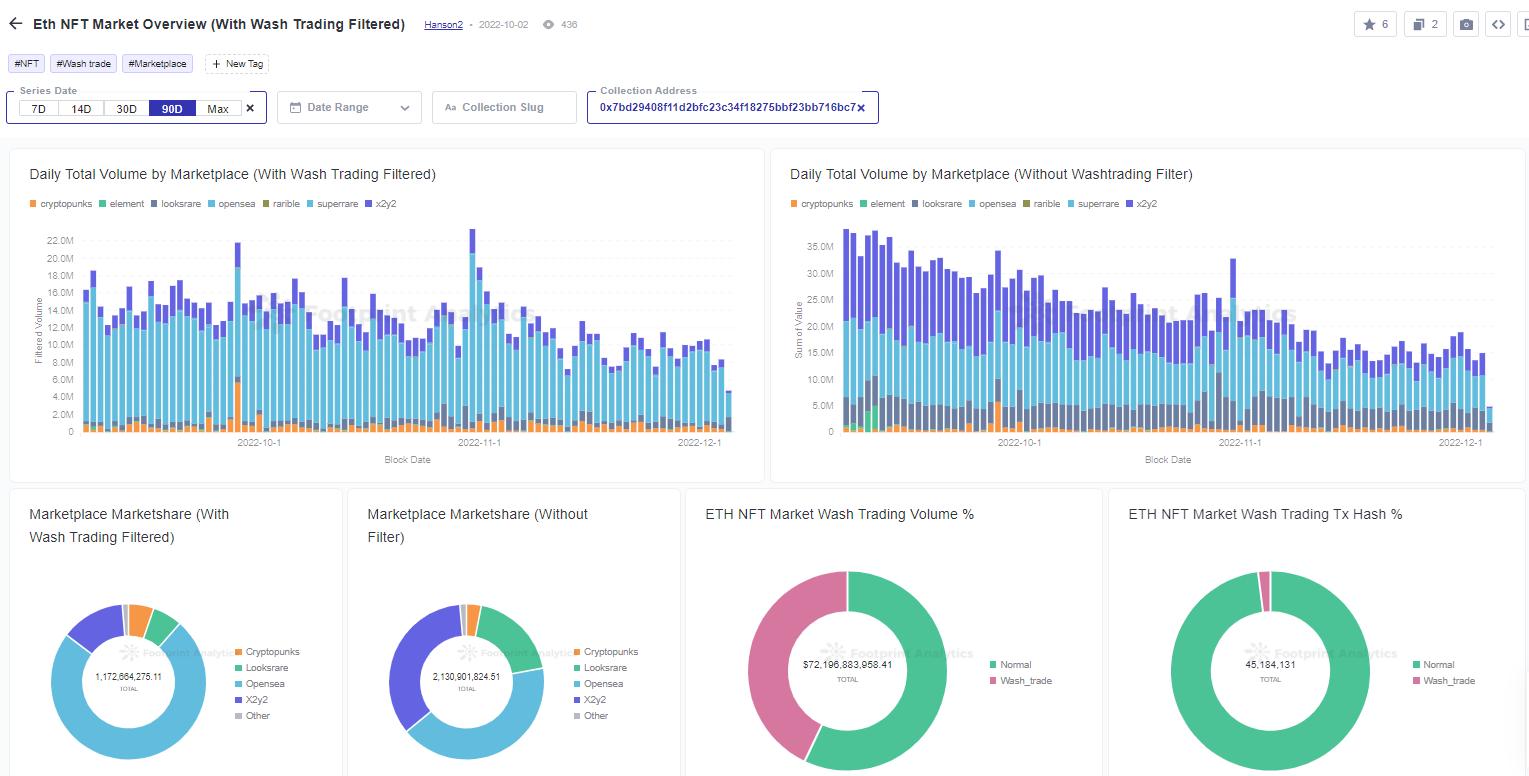
Dashboard - Wash Trading Overview
Any platform is supported to display the data of head collections on the website. Choose the metrics you need and simply embed the code into your website,Specific examples of embedding operations can be seen。
![]()
The data API can be called directly, linking any technology stack to the blockchain network. To learn more about the Footprint Analytics Data API, you canClick on this documentto view.
Code 2
Code 2 Lets you build responsive, full-featured customer-facing web applications without code. It can be content to visualize your data on dashboards and pages. Turn your data into meaningful business metrics, comprehensive reports or applications.
Use Cases:
The drag-and-drop interface allows you to create scalable web apps with pixelated designs and workflows.
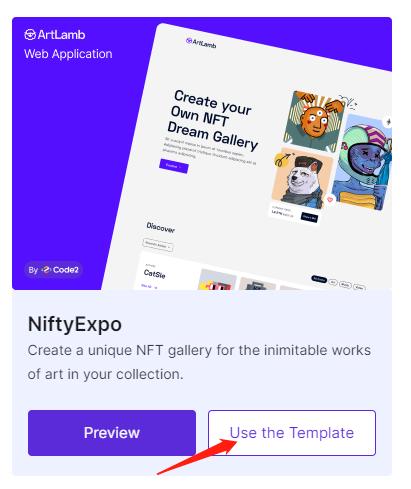
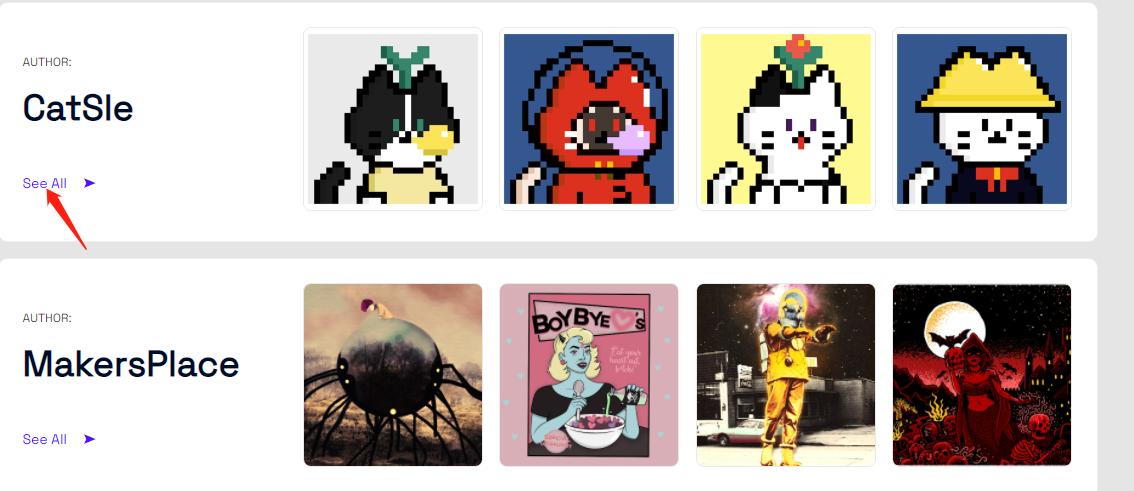
using Code 2NiftyExpo templateDisplay NFT collections so that users can createOpenSeaseries to create pixel landing pages.
Unlike Footprint Analytics, Code 2 requires its ownAdd data to databaseIn order to create the corresponding data model.
Data Dashboard
Mixpanel
Mixpanelis a tool for collecting and analyzing customer data. Customers can get these dimensions such as event analysis, funnel, retention and return visit.
The platform is thereAPIYes, has its own set of query language, you can take all the analysis results, you can also download the raw data.
Use Cases:
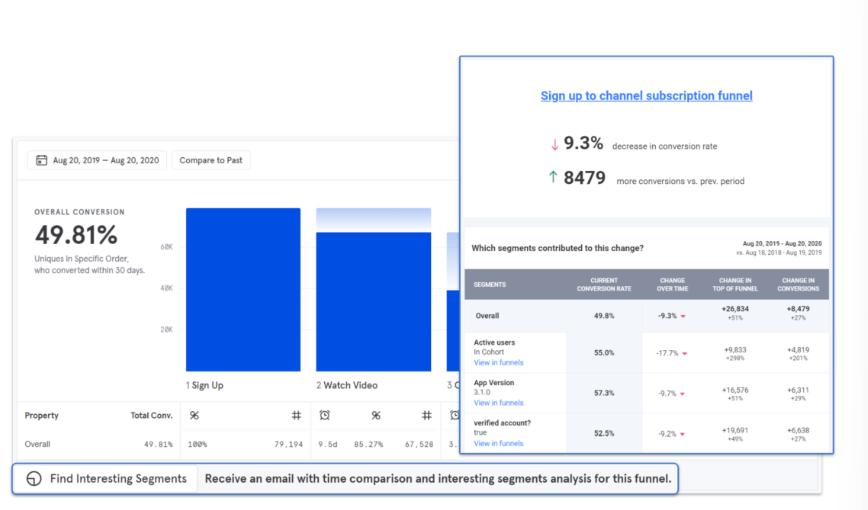
Use Mixpanel to automatically segment the funnel by each available attribute to identify user segments that contribute to increased conversions (positive or negative).
Two-way integration with partners
andAirship、IterableandOneSignalLeading messaging tools combine to send in-app messages at moments of truth for users.
For example, you can choose to encourage highly engaged users to rate your app after completing certain actions.
Reports can be shared with your team using our Slack integration
When you put a Mixpanel "short link" in Slack, it will preview the report directly, even users without platform account can see the preview. This applies to both the funnel and retention reports.
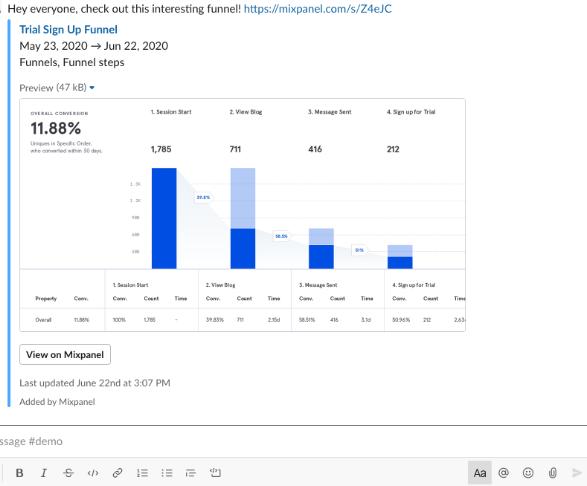
Short link displayed on Slack
Dataiku
Dataikuis a no-code "platform for AI application design, deployment, and management." With this tool, you can master every step toward real-world AI applications:
Data Preprocessing and Visualization
Machine learning model design, training, testing and validation
Data manipulation and MLops
Analysis application
Dataiku lets anyone use it, and data-driven decisions can take your business to the next level.
Use Cases:
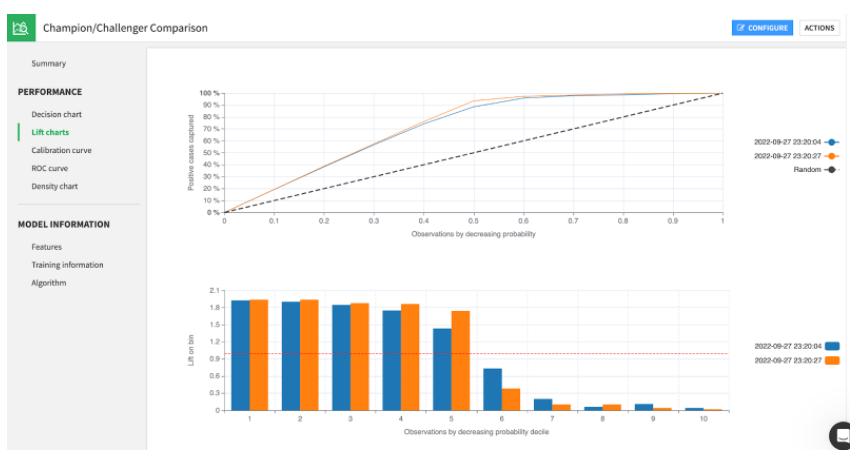
Compare Data Models
Champion vs. Challenger model evaluation is a well-known method for comparing the performance of models in production. Users can also track model performance by calculating performance metrics and data drift scores to visually examine the difference between champion and challenger model performance.
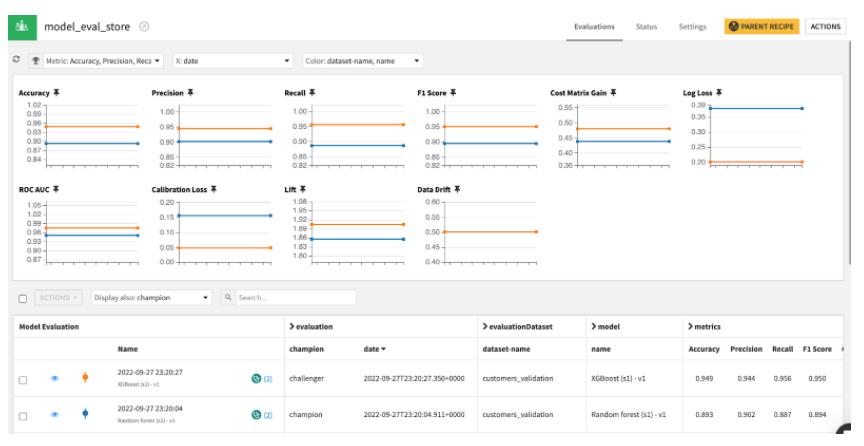
In this review store we can also create model comparisons for granular performance charts out of the box.
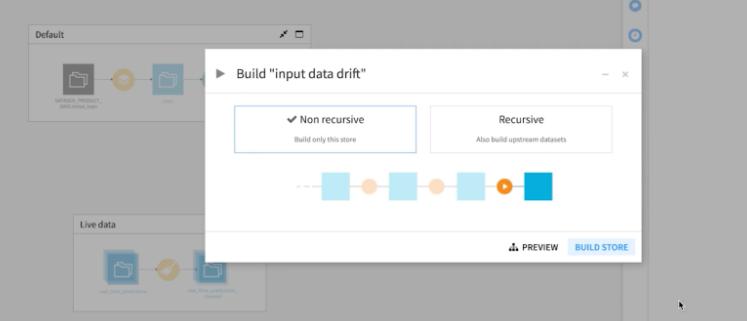
Automatic input data drift detection
Once your model is deployed, using the API Audit Log in Dataiku, you can receive in real-time all the data your model will score in production. Plus, you can track changes in data generated by the model in real time. To check if the live data is the same as the data the model was trained on, you can use a simple evaluation method in Dataiku that lets you identify andsummary。
summary
From blockchain to customer data analytics, no-code tools are gaining popularity across industries and use cases. Data is endless, but rarely enough teams and organizations leverage it to make better decisions. These tools save time and help them do so.


