
After the merger is successful, Ethereum traders need to understand the data
This article comes fromMessari, by Tom Dunleavy & Kunal Goel
Odaily Translator |
The Ethereum protocol transitioned from Proof-of-Work to Proof-of-Stake on September 15, 2022. It has also been widely recognized in terms of development depth, decentralized financial ecology, and Web3 use cases, but before entering the last quarter of 2022, there are still Some key metrics and data to watch.
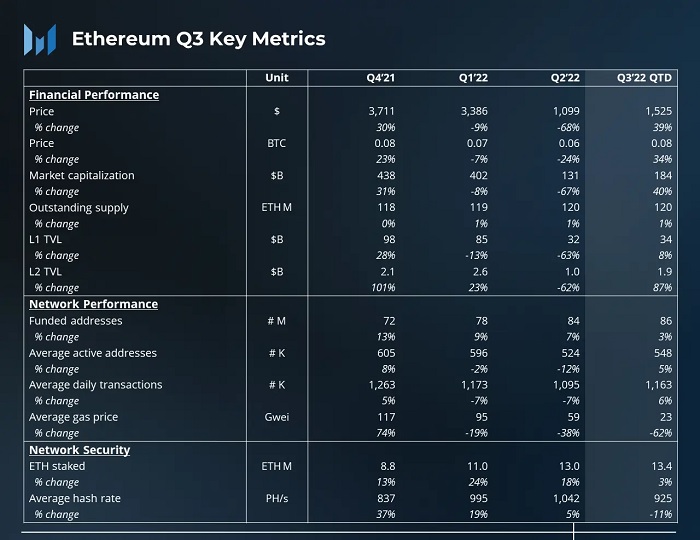
2021 Q4-2022 Q3 Key Indicators of Ethereum
secondary title
Ethereum network performance analysis
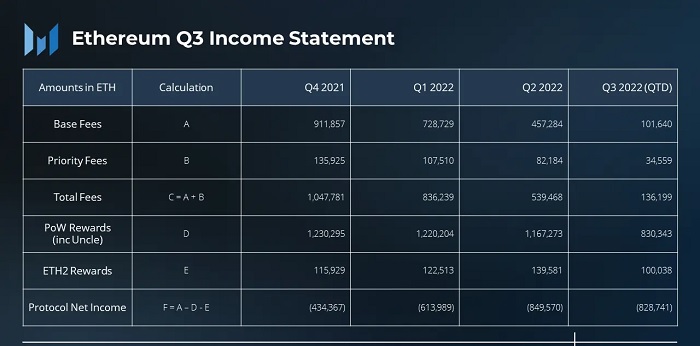
1. Highlights of the third quarterAfter the Ethereum merger, the daily block reward dropped from about 13,500 ETH to about 2,000 ETH, greatly reducing the network's security fees. The active addresses and transactions of Ethereum remained basically stable, with relatively small changes from the previous month. While addresses and numbers are likely to increase with wider crypto adoption,
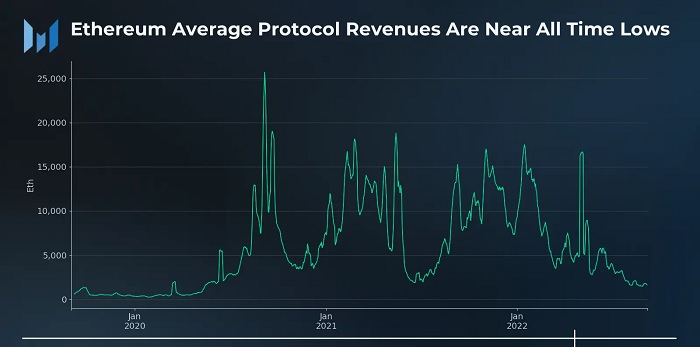
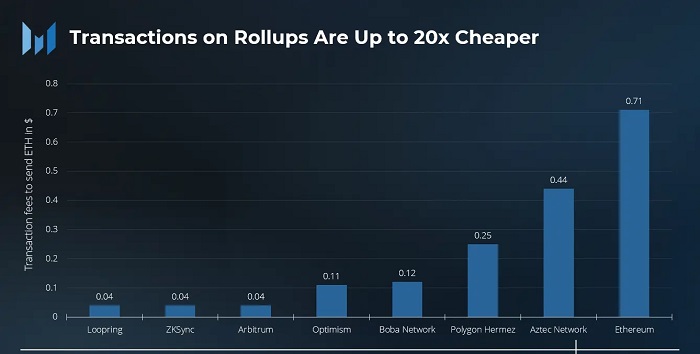
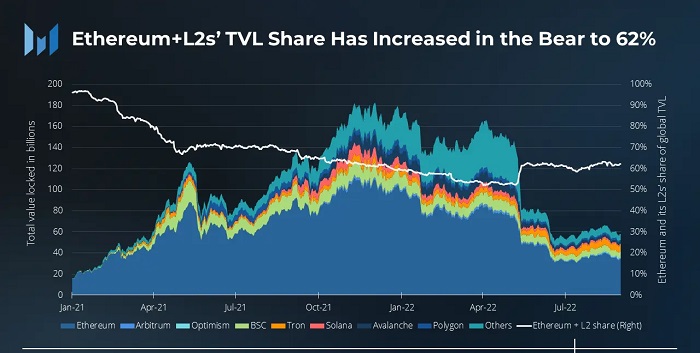
Ethereum’s network scaling still comes primarily from L2 rather than the higher performance L1.It should be noted that in the third quarter of 2022, EthereumTotal network costs plummeted, fell to the lowest level since 2020, and if this trend continues into the second half of this year, it will directly。
Affecting the merged Ethereum staking yield
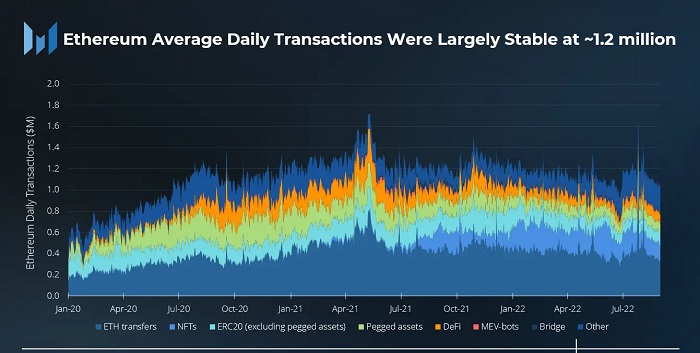
2. Network performanceIn the third quarter of 2022, the average daily transaction volume of the Ethereum network is 1.2 million, an increase of 6% from the previous quarter, of whichETH transfers and DeFi transactions increased by 7% and 14%,The average daily transaction volumes were 415,000 and 82,000, respectively. on the other hand,NFT and bridging volumes down
. NFT transactions fell 17% to 181,000 transactions per day during the quarter, and bridge transactions fell 41% to 9,000 transactions per day.
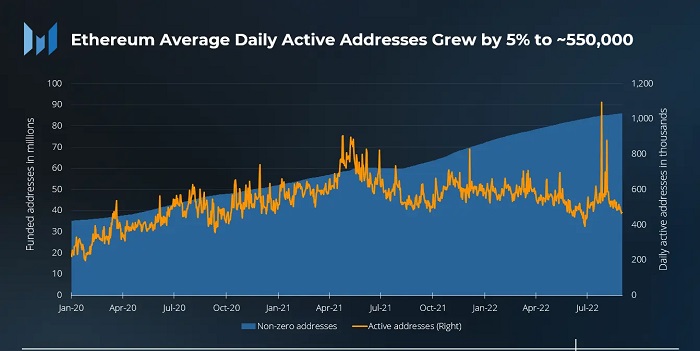
The growth of the number of active addresses on the Ethereum network is similar to the trend of transaction growth. In the third quarter, there were 550,000 active addresses per day, an increase of 5% from the previous quarter. However, this increase is mainly due to the surge of active addresses on July 27, 2022, when the famous miner Guo Hongcai (Bao Erye) announced the plan for the Ethereum PoW fork, and some wallet "maintenance activities" on Binance, so these Active addresses may not be due to an influx of new users or a new application going live.
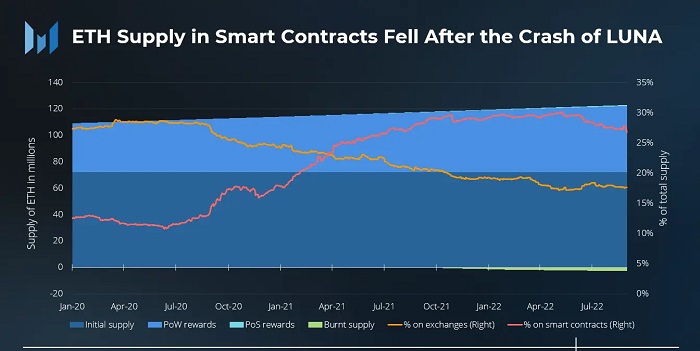
During this period, ETH supply increased by 0.7%, with an annualized growth rate of 4.2%, and all inflation came from PoW rewards, because the consumption of transaction Base fees was slightly higher than the inflation of beacon chain rewards.Since 2020, ETH in smart contracts has been on the rise as digital assets are increasingly used in DeFi and other applications. However, Terra’s debacle appears to have eroded trust in smart contracts, even in the ecosystem as a whole. On May 9, 2022, the same day Terra crashed, the percentage of ETH held in smart contracts peaked at 30% and has been trending downward since then.。
At the end of August, the proportion of ETH on smart contracts dropped to 27%, down 2% from the end of June
3. Market indicators
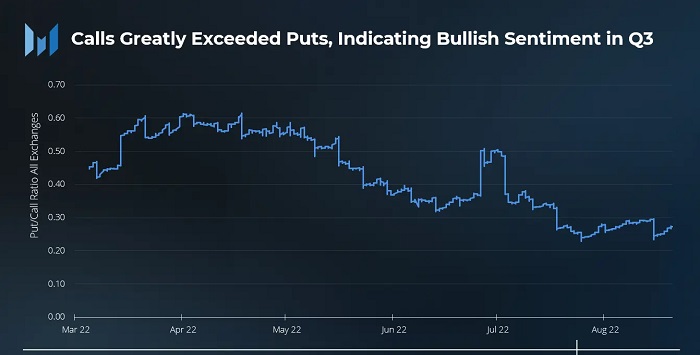
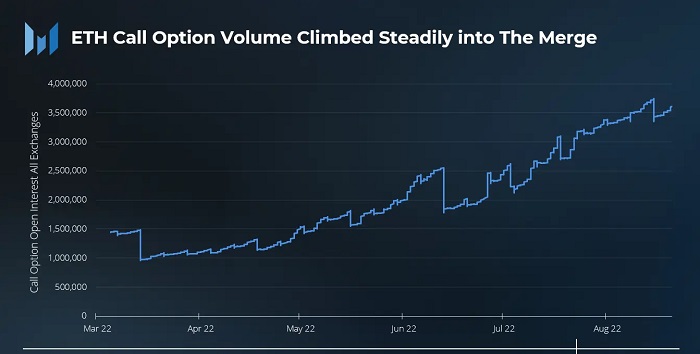
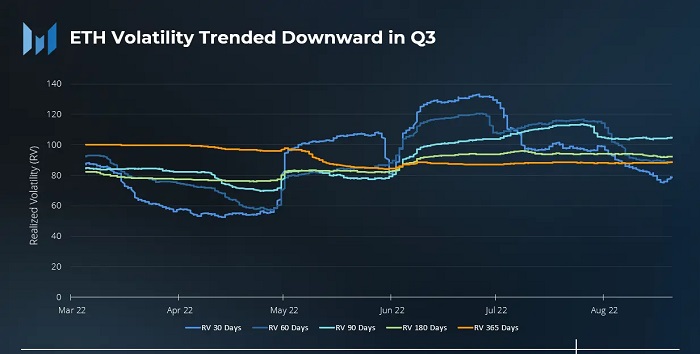
The ethereum merger event led to an increase in bullish bets in the third quarter, with the ratio of calls to puts increasing, with data showing that strike prices for call options peaked at $5,000 at expiration on September 30, compared with $5,000 in December. $2,500 at maturity on the 30th. The strike price of the call option suggests that investors may be paying more attention to the ethereum options contract, which expires in December this year.Throughout July and August, ETH's daily volatility was much smaller. Both the cryptocurrency and stock markets saw a decline in absolute volatility after a very challenging second quarter.。
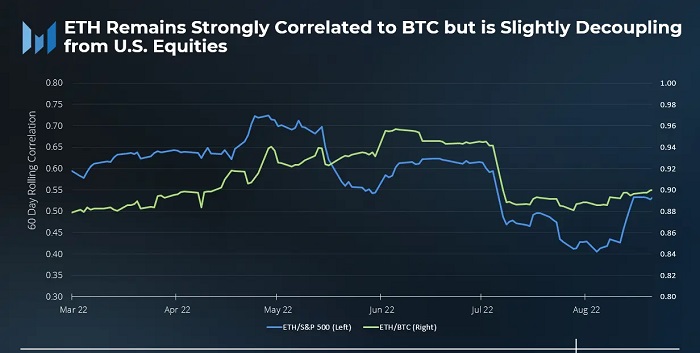
Ethereum’s Correlation With Bitcoin Remains Near 90% While Correlation With S&P 500 Decreases Slightly
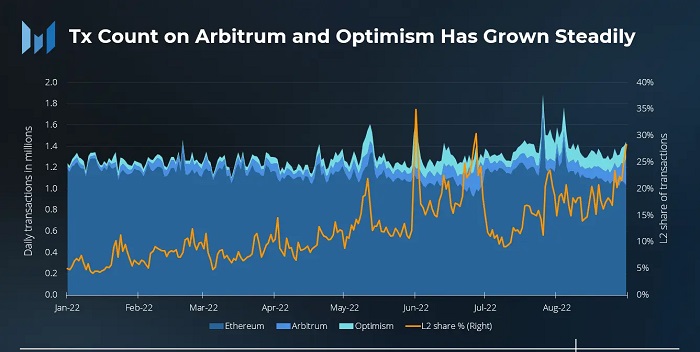
4. Layer 2 analysisWhile the average number of Ethereum transactions may remain within a reasonable range,Larger growth in L2 transactions
. Arbitrum's average transaction volume has nearly tripled, from 39,000 in January 2022 to 115,000 in August 2022. During the same period, Optimism's transaction volume also increased nearly 3.5 times, from 41,000 to 142,000 transactions.
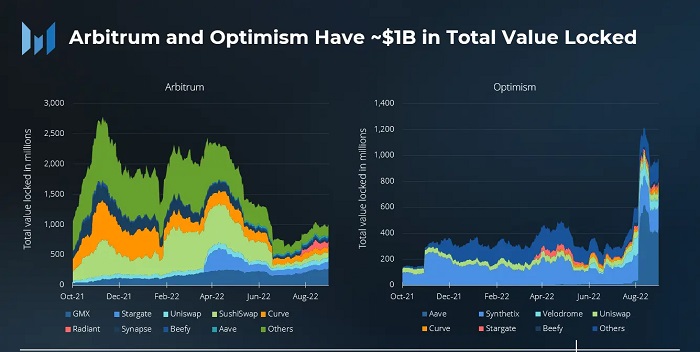
Emerging underlying ecosystems are driving L2 activity, with L2 applications attracting a lot of usage and attention, such as GMX on Arbitrum and Synthetix on Optimism, and these applications are also some of the biggest drivers of TVL on their respective platforms. However, with OP incentives going live and an Arbitrum airdrop expected, we see that L2 growth may not be coming from organic users.
4. Other factors leading to L2 growth
Arbitrum's Nitro upgrade is live, and the Arbitrum Odyssey is expected to revive again.
StarkNet announced plans to launch its own token.
secondary title
1、DEX
Subfield Analysis
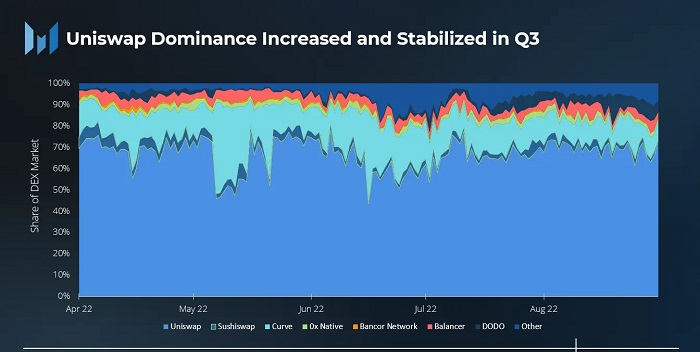
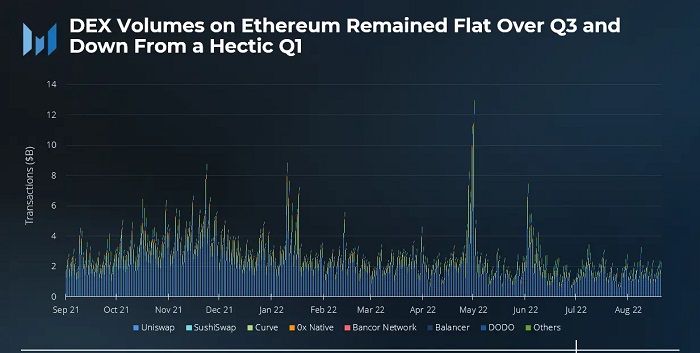
In the second quarter of 2022, the average daily trading volume of DEX was US$2.78 billion, which dropped to US$1.83 billion in the third quarter, and the year-on-year trading volume also dropped to about US$800 million. During the period, Uniswap's dominance increased from 60% at the end of the second quarter to 72% at the end of August, but remained at around 75% of the DEX market share throughout the third quarter.
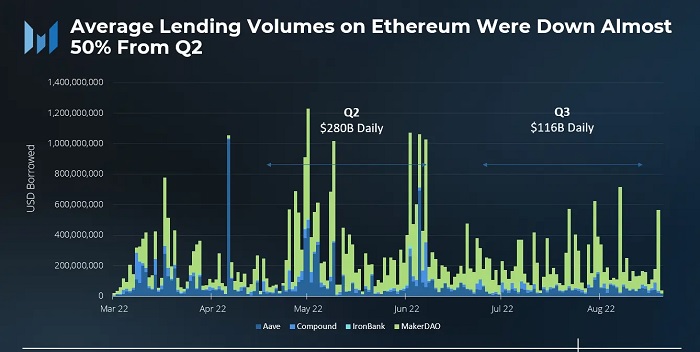
2. Borrowingthird quater,The average loan transaction volume in the crypto market has dropped sharply.
3、NFT
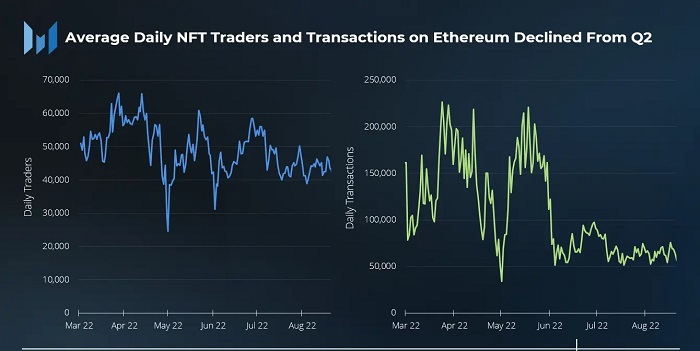
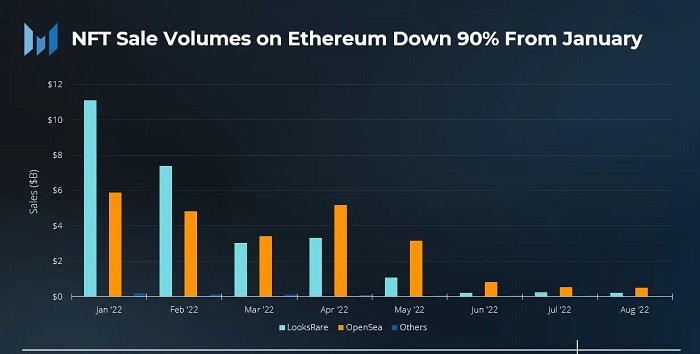
The daily average fell from US$280 billion in the second quarter to US$116 billion. July was a noticeably slow month, and trading volumes picked up slightly in August, mainly due to increased demand for spot ETH from ETH POW airdrops.The average daily trading volume of NFT has dropped significantly, but the decline in the average number of daily traders has not been as much as expected, and the NFT industry can still attract about 40,000 loyal users per day on average. The average monthly dollar volume of NFT transactions in the third quarter was down 90% from January, with less than $1 billion in sales, compared to a whopping $4.6 billion in the second quarter. have to be aware of is,The decline is not only related to the slowdown of the NFT market, but also to the falling price of ETH
. OpenSea continued to hold the largest share of NFT market transactions in the third quarter.
Sudoswap will go live in the third quarter of 2022, a liquidity pool similar to Uniswap for NFTs, and its trading volume peaked in August.
4. Stable currency
The correlation between stablecoins and Ethereum is very close. Although the trend of stablecoins and the overall trading volume are basically unchanged compared with the second quarter, some policy events in the third quarter deserve attention, such as:
Circle, the organization behind USDC, banned 38 addresses after the U.S. Office of Foreign Assets Control (OFAC) sanctioned the smart contracts of privacy protocol Tornado Cash.
MakerDAO's DAI plans to reduce its holdings of the centralized stablecoin USDC.
Tribe DAO plans to dissolve and all FEI will be redeemed.
Circle launches EUROC, a stablecoin denominated in euros.
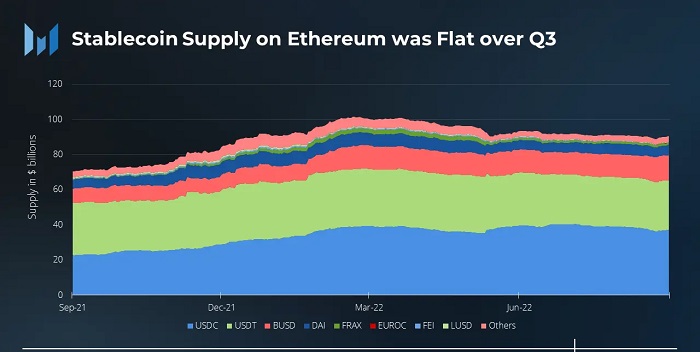
USDC's market share dropped to 41% in the third quarter. The main reason for the decline is "absorption" by BUSD, whose stablecoin market share has increased from 14% to 16%.
secondary title
L1 Competitive Analysis
secondary title
Summarize
Summarize


