Bitwise報告:RWA與預測市場持續創新高,加密正在築底


- 核心觀點:Bitwise 2026年Q2報告顯示,儘管加密市場遭遇連續第三個季度負回報(比特幣跌52%),現貨ETF流出49億美元,鏈上活動下滑,但代幣化RWA(330億美元)、預測市場(未平倉合約18億美元)及加密股票(+23%)表現強勁,應用層收入達59億美元,基本面已遠強於2022年熊市底部。
- 關鍵要素:
- 市場表現:Bitwise 10指數Q2下跌15.4%,比特幣跌至60,000美元以下,加密寒冬持續9個月,現貨ETF淨流出49億美元創歷史最差季度。
- 政策僵局:CLARITY法案因道德條款在參議院陷入僵局,2026年通過機率降至40%;Q3是關鍵窗口,若通過可能標誌熊市底部。
- 穩定幣與RWA擴張:代幣化RWA規模Q2達330億美元(年初至今+45%),穩定幣供應量維持近3000億美元,GENIUS法案將催化Q3鏈上增長。
- DeFi抗跌性:Q2比特幣跌22%時,Bitwise DeFi指數僅跌4%;Aave過去一年創收約9億美元,代幣經濟改善與機構採用推動悄然重估。
- 應用收入可觀:過去12個月十大加密應用合計收入59億美元,PancakeSwap、Hyperliquid和Aave均接近10億美元,熊市中仍穩定盈利。
- 加密股票低相關性:Bitwise加密創新者30指數上半年回報23%,是美國股票的兩倍多,且與大多數資產類別的90天滾動相關性更低。
- 基本面比較:以太坊交易活動較2022年Q2增長13倍,DeFi鎖倉價值上升超60%,穩定幣規模翻倍,只有價格未反映基本面改善。

Editor's Note: Crypto asset manager Bitwise recently released its Q2 2026 report.
The report states that the Bitwise 10 Large Cap Crypto Index fell by 15.4%, with 8 of its 10 constituent assets posting negative returns; spot Bitcoin ETFs saw outflows of $4.9 billion, marking the worst quarterly performance on record; on-chain transaction activity, volume, and DeFi assets all declined, while the correlation between cryptocurrencies and stocks increased.
Of course, there were also market highlights. Prediction market open interest reached an all-time high of $1.8 billion, with quarterly volume hitting $43 billion; the total value of tokenized real-world assets reached $33 billion in Q2, up 45% from the start of the year; crypto stocks also performed well, with the Bitwise Crypto Innovators 30 Index rising 30.6%, primarily driven by AI-related Bitcoin mining companies.
"Overall, the situation is severe. What makes it worse is that this feeling of difficulty is equally real. Although there is no statistical metric to measure 'vibes,' the current atmosphere in the crypto industry is among the worst I've seen in my eight years in the field. One reason: this marks our third consecutive quarter of negative returns, the longest losing streak since 2022 (when we had four consecutive quarters of negative returns)," wrote Matt Hougan, Chief Investment Officer at Bitwise.
Below are some key data charts extracted from the report. Enjoy~
——————————
Top 10 Key Events of Q2
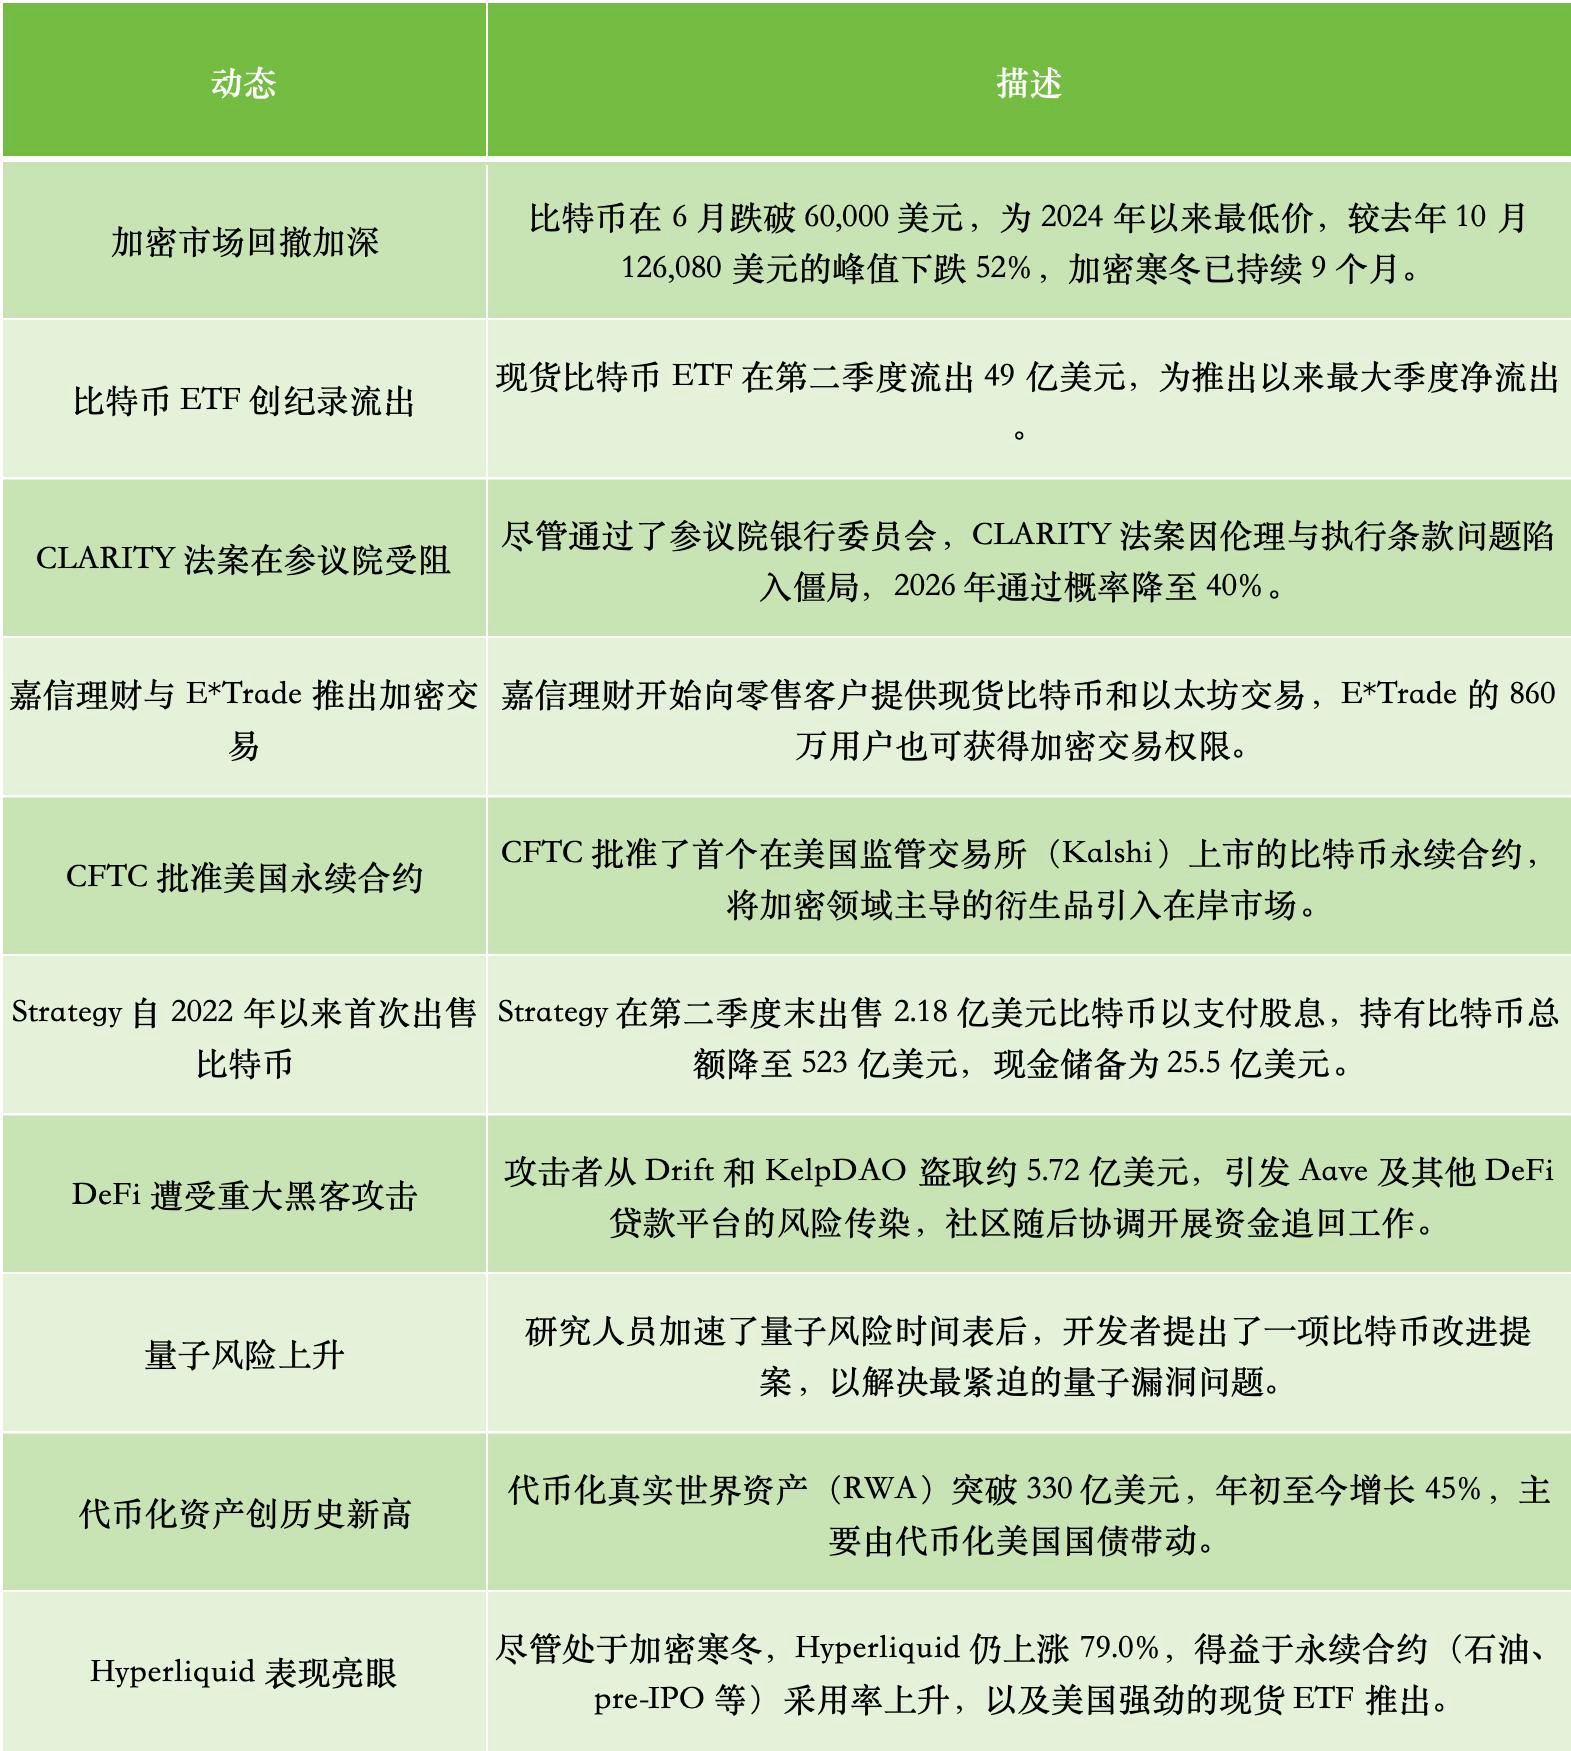
In Q2, we saw Strategy, which had professed "never selling," sell Bitcoin, starting with small test amounts and eventually selling $218 million worth of Bitcoin at the end of June to pay dividends.
Affected by these sell-offs, Bitcoin fell below $60,000 in June, hitting its lowest price since 2024, down 52% from its peak of $126,080 (October last year). The crypto winter has lasted for 9 months. Meanwhile, spot Bitcoin ETFs saw outflows of $4.9 billion in Q2, the largest quarterly net outflow since their launch.
On the policy front, the closely watched "CLARITY Act" is not progressing smoothly in the Senate, stalled by ethical and enforcement clause issues. The prediction market probability of its passage in 2026 has also dropped to 40%.
Here are the top 10 crypto events of Q2 summarized by Bitwise:
Q3 Outlook
Q3 is a crucial period for the success or failure of the CLARITY Act. This market structure bill passed the Senate Banking Committee in Q2 but stalled due to ethical clauses related to the president's family's crypto interests. Prediction markets show its probability of passage in 2026 is near 40%, down from 75% in mid-May. We believe passage before the November midterm elections is unlikely. However, bills with such probabilities often manage to pass, so we think CLARITY still has a chance. If passed, we believe this could mark the bottom of the current bear market; if it fails, short-term volatility is expected, followed by a gradual dissipation of uncertainty as the industry progresses under a pro-crypto SEC and CFTC.
Stablecoin expansion post-GENIUS Act. July marks the final sprint before the GENIUS Act takes effect in January 2027, with regulators needing to finalize rules in Q3. We expect a flurry of major enterprises to announce stablecoin projects before the official launch, such as the recently announced OpenUSD, backed by Stripe, BlackRock, Visa, Coinbase, and around 140 other companies. Since last fall, the stablecoin supply has remained near $300 billion, showing resilience during the crypto market sell-off. We believe that accelerating stablecoin growth, as the January effective date approaches, will act as a catalyst for public chains like Ethereum and Solana in Q3.
The Fed under Kevin Warsh. The Federal Reserve has a new chair, Kevin Warsh, and the market knows little about his governing style. Q3 will provide the first signals: the July FOMC meeting and the annual Fed symposium in Jackson Hole in late August. So far, Warsh has kept rates unchanged and signaled no rush to cut. By the end of the quarter, we should have a clearer picture of the Fed's direction than we do now. It's too early to predict the interest rate path, but as the Fed sets the tone for all risk assets, any outcome will be quickly priced in by the market.
The Quiet Re-rating of DeFi. Over the past month, Bitcoin has fallen about 22%, while the Bitwise DeFi index is down only 4%. DeFi is typically much more volatile than Bitcoin, so this resilience is rare and has gone almost unnoticed. We believe DeFi is undergoing a quiet re-rating: tokenomics are improving, the gap between usage and token value is narrowing, real institutions are building on protocols like Morpho and Jupiter, and Aave alone has generated around $900 million in revenue over the past year. We expect DeFi's outperformance to continue into Q3, and the market often lags in recognizing such shifts.
Significant Divergence Between Crypto Stocks and Crypto Assets
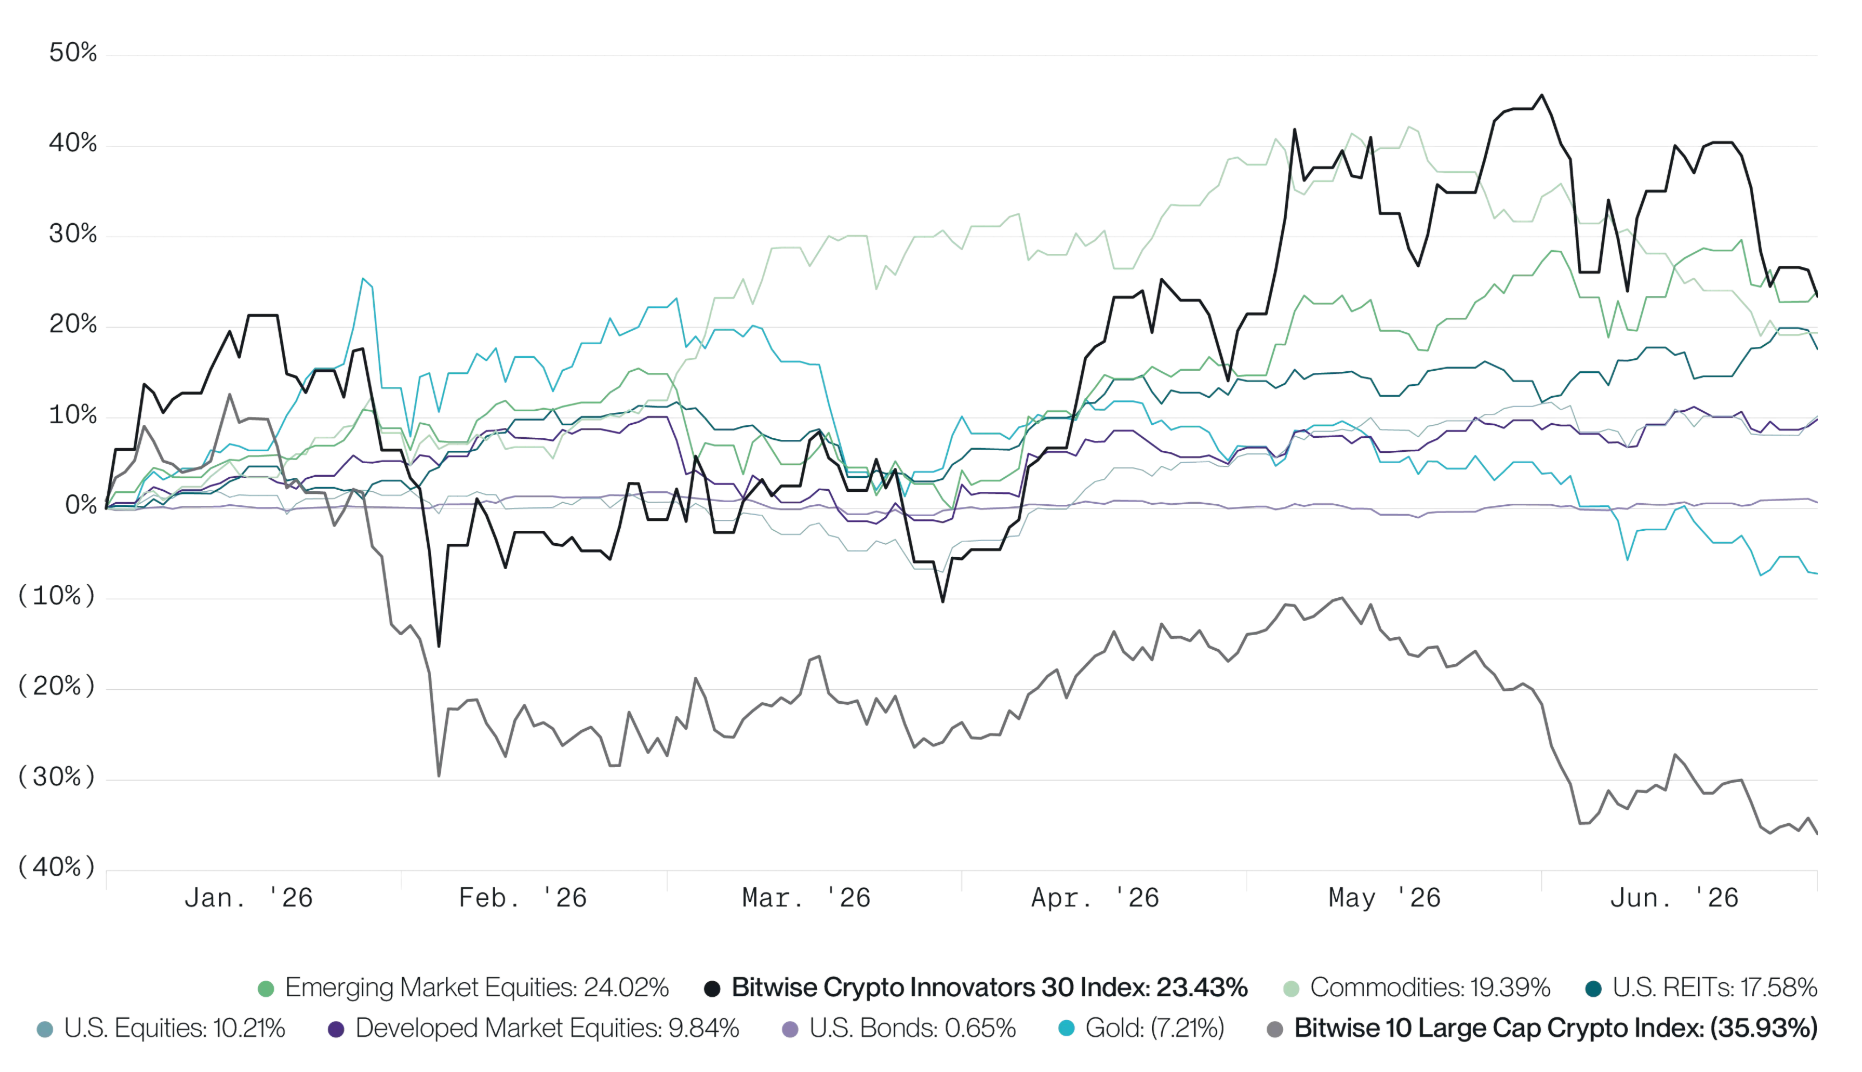
Halfway through 2026, crypto asset prices are down 36%. Among other major asset classes, only gold has fallen, by 7%, while the rest are all positive. This is partly why this crypto winter feels particularly harsh – it's a lonely winter.
Notably, however, crypto stocks have returned 23% in the first half of the year, outperforming all major asset classes except emerging market equities. In fact, the Bitwise Crypto Innovators 30 Index, which tracks the 30 largest publicly listed crypto economy companies, has doubled the return of US stocks.
This shows that even in a bear market, investment opportunities in the crypto space continue to emerge. Bitcoin mining companies benefit from AI tailwinds; stablecoin issuers and tokenization platforms ride the wave of Wall Street adoption; the connection between traditional finance and the crypto world is tightening. While I expect crypto assets to rebound in the second half, the first half has reinforced an important understanding: crypto is not a monolith but a diverse, dynamic field that deserves a broader perspective.
Here is the performance of crypto versus major asset classes:
Data from Bloomberg. Data as of June 30, 2026
Crypto Applications Generate Significant Revenue
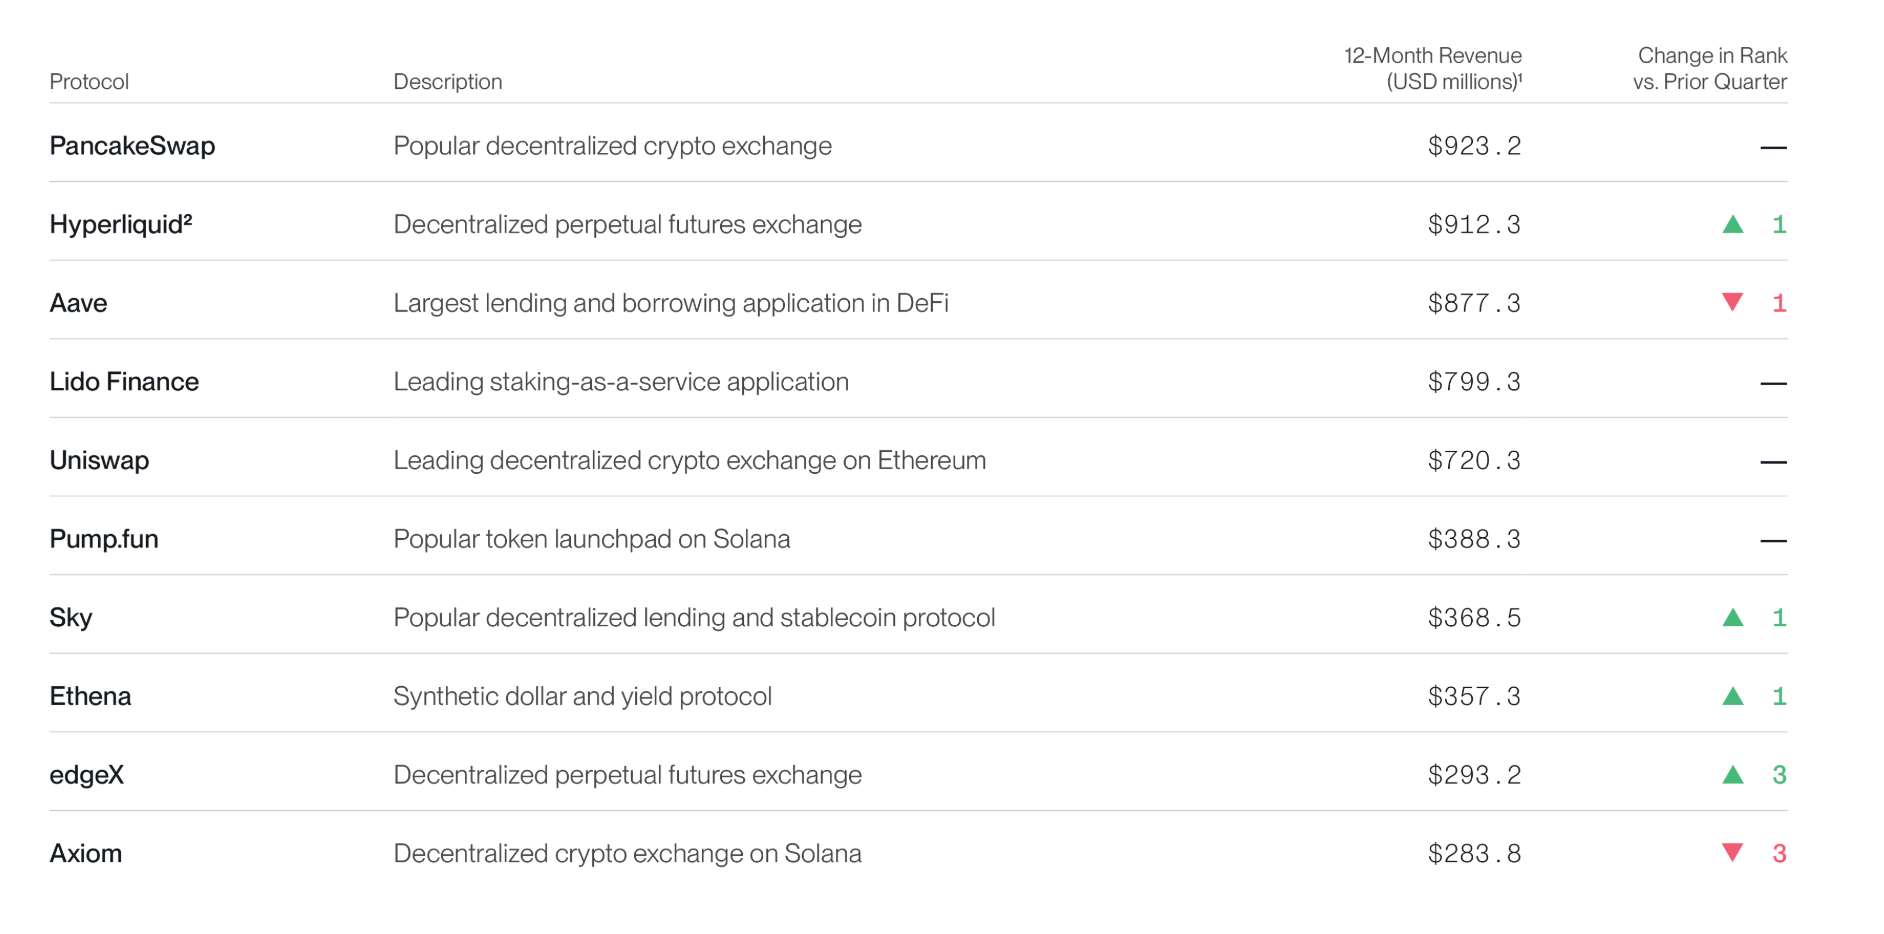
Over the past 12 months, the top ten crypto applications generated a combined revenue of $5.9 billion. The top three (PancakeSwap, Hyperliquid, and Aave) each earned close to $1 billion. These are legitimate operating businesses generating fees from trading, lending, and staking – even during a bear market.
Top 10 crypto applications by revenue, as shown below:
Data from Token Terminal, covering January 1, 2025 to June 30, 2026
(1) Revenue consists of total fees paid by users; (2) Hyperliquid revenue excludes HyperEVM fees
The Bull Market in Real World Assets (RWA)
US Treasury Secretary Scott Bessent himself stated a few weeks ago: "Digital assets, stablecoins, tokenization, and new payment systems will help shape the future of money."
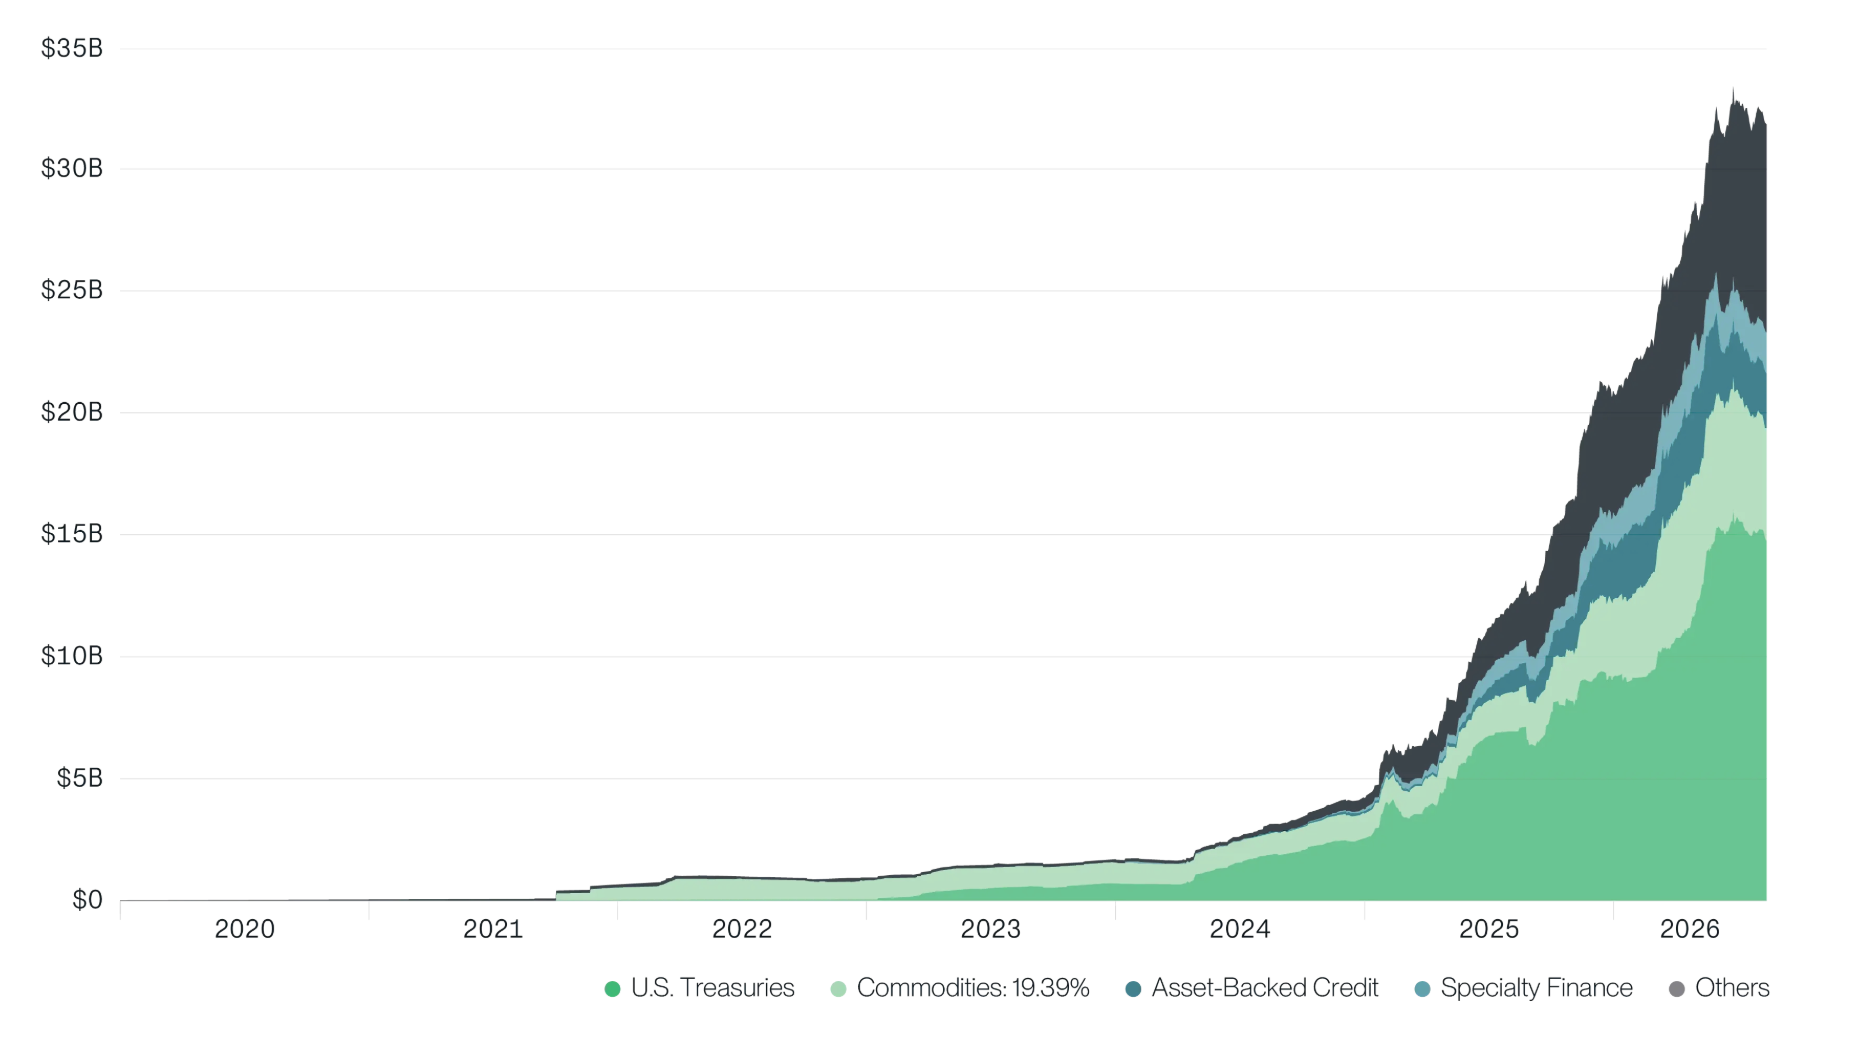
In a sense, the future he describes is already here. Tokenized Real World Assets (RWA) reached a record $33 billion in Q2, growing 12% quarter-over-quarter and 45% year-to-date, with particularly rapid growth in tokenized US Treasuries, corporate credit, equities, and venture capital.
When I see this chart, I see the world's largest asset managers moving assets onto the blockchain en masse and at full speed – this is worth paying attention to.
Tokenized Real World Asset (RWA) size, as shown below:
Data from RWA.xyz, covering January 1, 2020 to June 30, 2026
Note: The chart above excludes stablecoin issuers like Circle and Tether
Prediction Markets Continue to Expand
Open interest in prediction markets hit an all-time high in Q2, reaching $1.8 billion, with the sports category becoming the largest weight. Quarterly trading volume also set a record, reaching $43 billion.
Applications like Polymarket exemplify the stealthy adoption of crypto by retail users: millions of people are using crypto infrastructure to trade outcomes of real-world events, but most of them don't know or care that crypto provides the underlying technology.
With the US midterm elections approaching, both trading volume and open interest in prediction markets are likely to hit new all-time highs multiple times this year. After all, politics was the category that brought prediction markets into the mainstream in 2024, and the market size has tripled since then.
Prediction market open interest, as shown below:
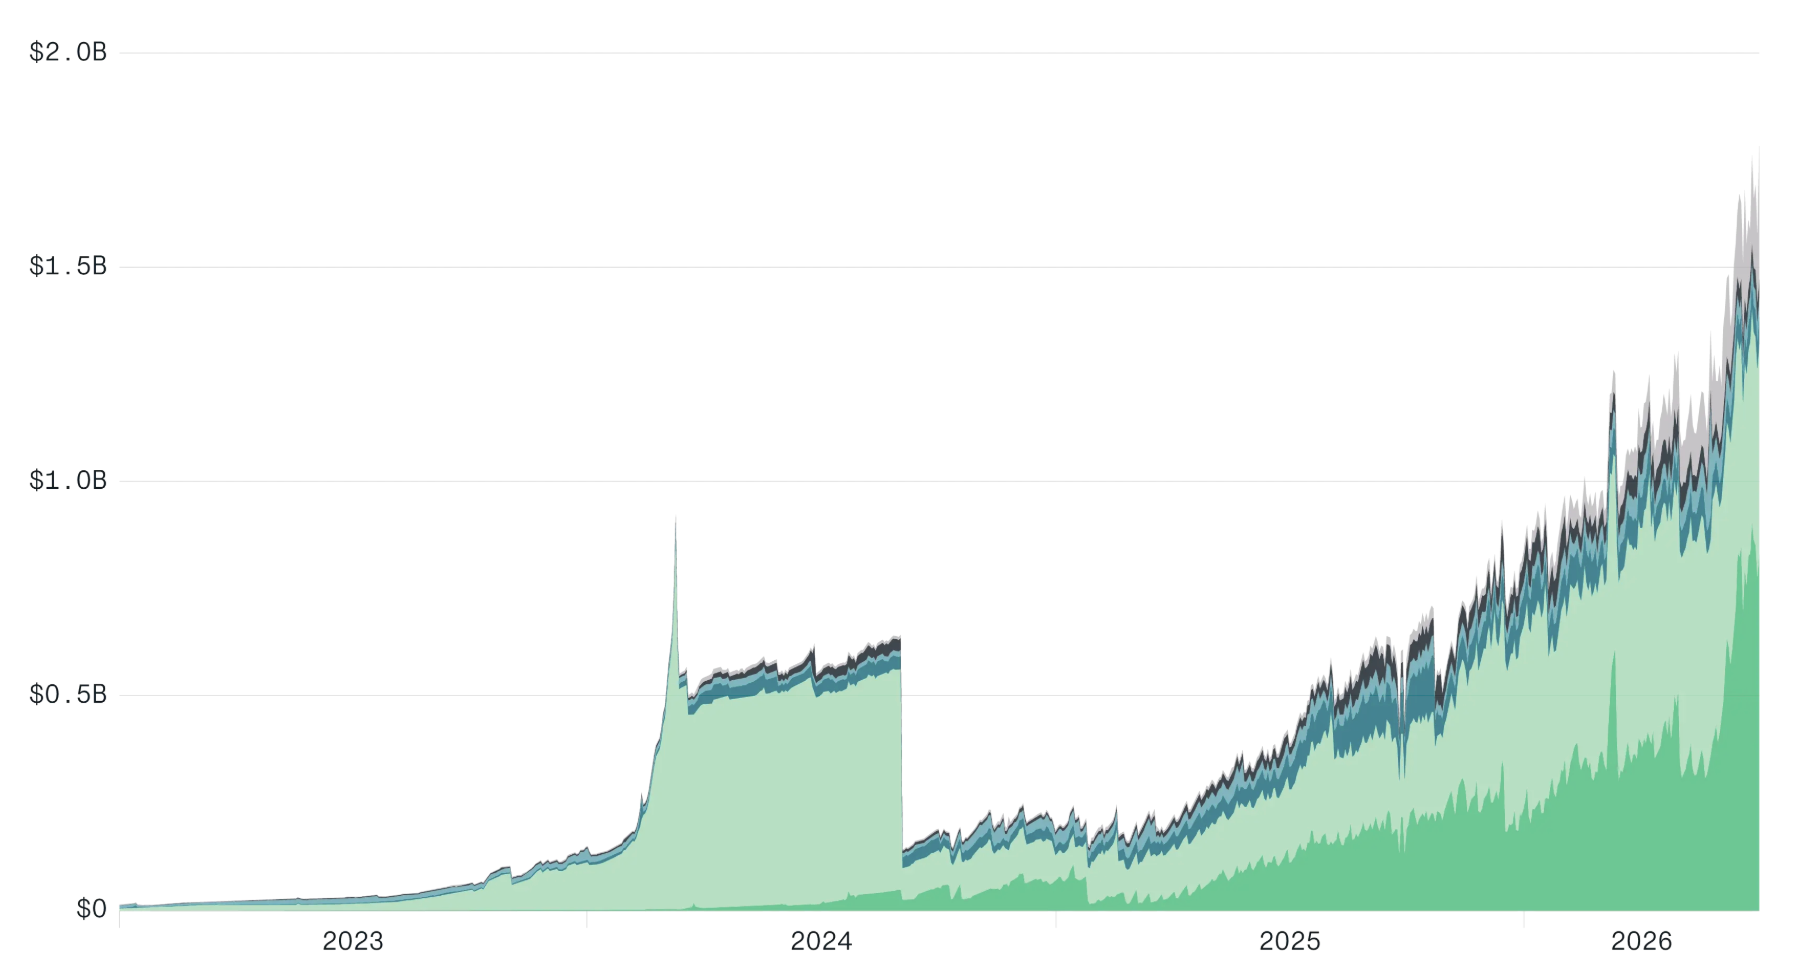
Data from Blockworks Research, covering January 1, 2023 to June 30, 2026
Low Correlation of Crypto Stocks with Major Assets
Returning to crypto stocks, one of the most interesting charts is the 90-day rolling correlation of the Bitwise Crypto Innovators 30 Index with other major asset classes. Notably, it shows a lower correlation with almost all other classes compared to US stocks: including developed market equities, emerging market equities, US REITs, US bonds, and gold. (The only exception is commodities, where both show negative correlation.)
In other words: in the first half of 2026, crypto stocks returned more than double that of US stocks while having a lower correlation with nearly every other asset in a portfolio. This combination of return and diversification is enough to excite investors.
Correlation of select assets and asset classes (90-day rolling), as shown below:
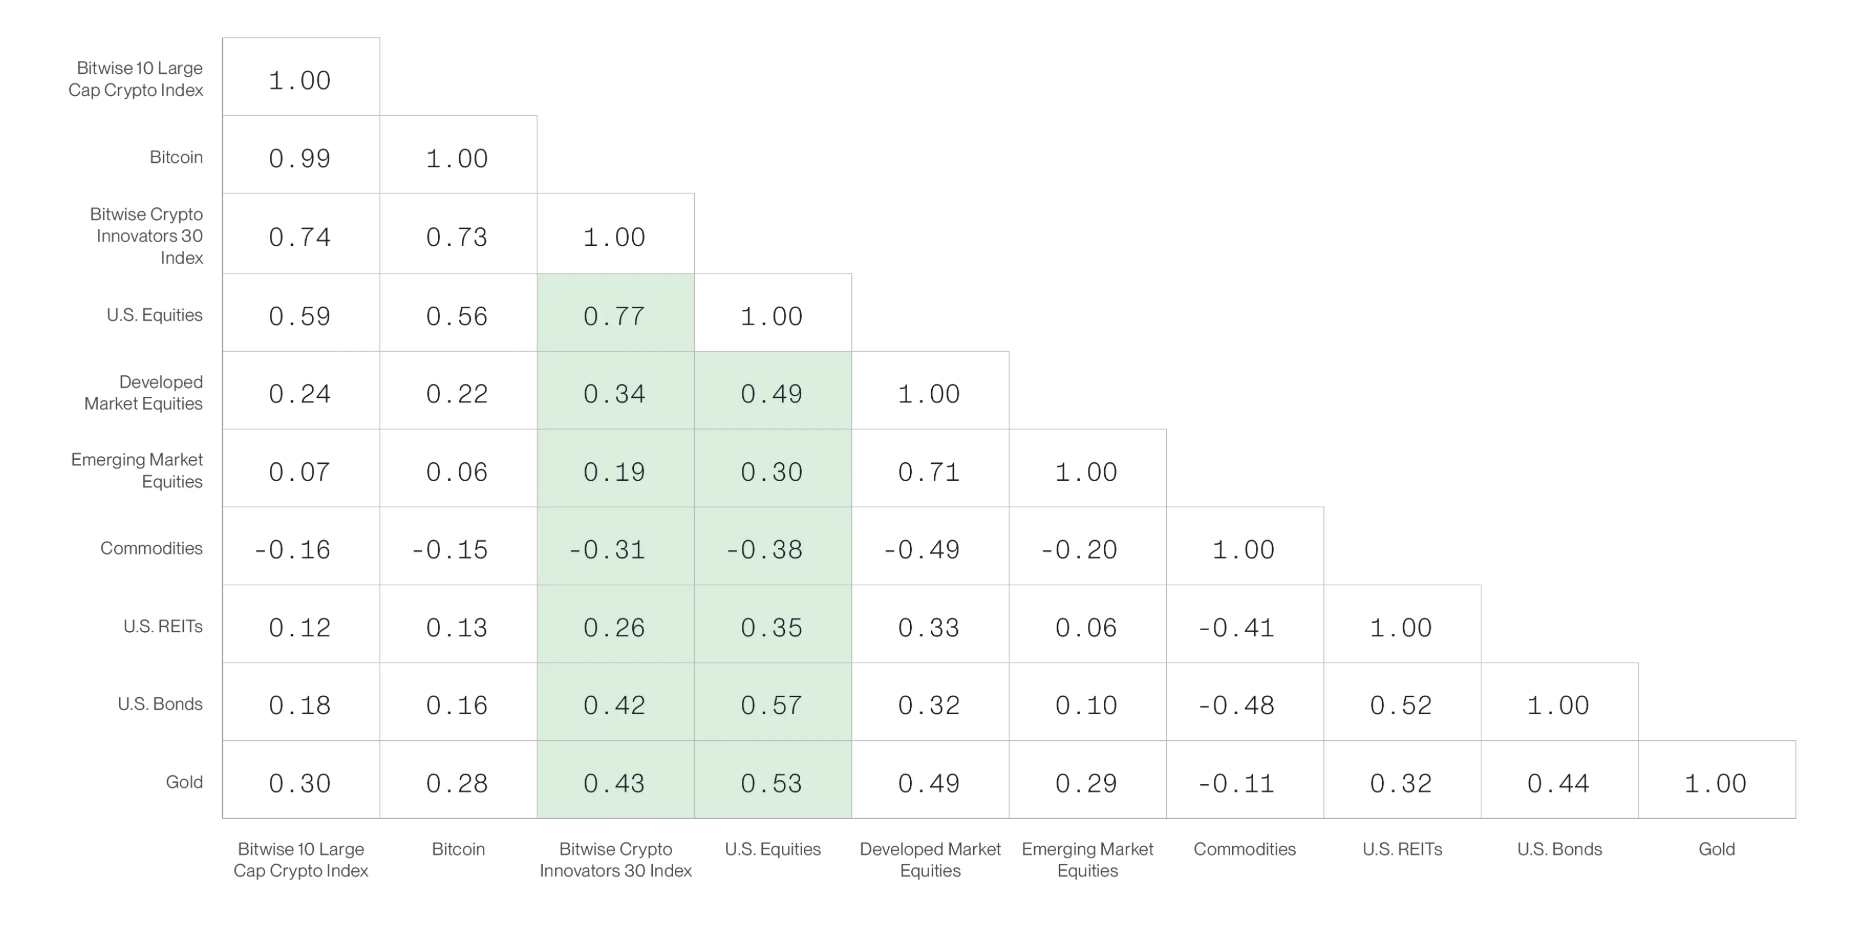
Data from Bloomberg, as of June 30, 2026
Closing Remarks
As you flip through these pages, look closely at the charts. Almost all metrics – prices, on-chain activity, trading volume – are far from their respective all-time highs. This is not surprising given that prices are down more than 50% from their October peak.
But comparing the same data cyclically to the last bear market bottom – 2022 – paints a very different picture. Ethereum transaction activity has grown roughly 13x compared to Q2 2022. Total value locked in DeFi has risen over 60%. Stablecoin size has roughly doubled. It seems only price hasn't kept pace.
I think this accurately reflects where we really are: the market is pricing an industry – one with deeper liquidity, stronger fundamentals, and Wall Street finally coming on-chain – at bear market prices, an industry whose size is already double the bottom of the last cycle.
Such foundations cannot prevent winter, but they determine what grows in spring.
That is my interpretation of this quarter. Of course, none of these 50+ charts can answer the question we get asked most often: "Has crypto bottomed in price?" But they do point to the resilient fundamentals of the crypto space – a realm where usage, revenue, and adoption continue to grow even in a bear market.
For me, this is precisely what makes it an interesting space – and the foundation on which the next cycle will be built.